Bitcoin's Next Move: $110K Breakout or $94K Dip? SMC Decides#Bitcoin Daily Chart Analysis – Smart Money Update
As of today, BTC is trading around $105,800 and is showing signs of consolidation after reaching a key resistance zone near $110K.
Let’s break down what’s happening on the chart 👇
Current Market Structure
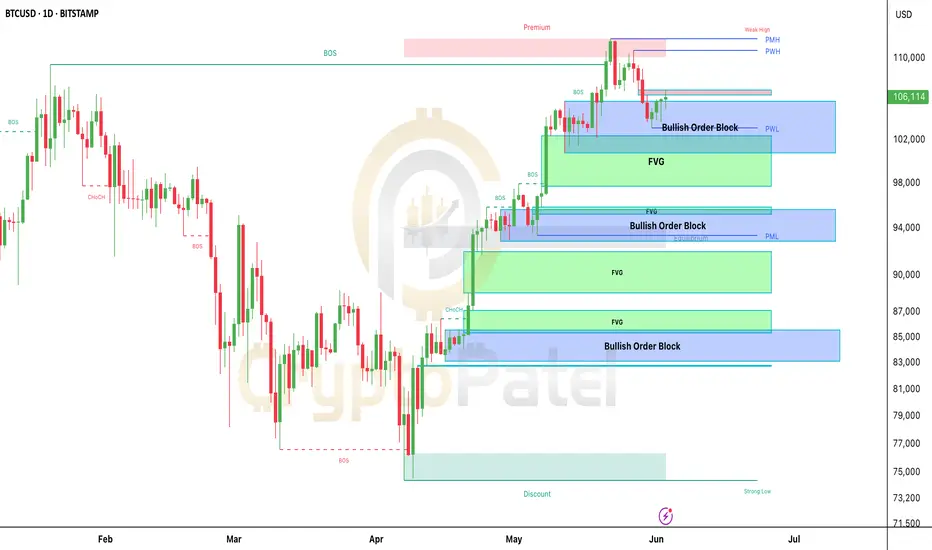
▶️ BTC has been in a clear uptrend, with multiple Breaks of Structure (BOS) confirming bullish momentum throughout April and May.
▶️ However, price recently entered a premium zone (above $110K), where it faced strong resistance.
▶️ This created a weak high, and we saw a Change of Character (CHoCH) that suggests buyers are slowing down.
Key Levels to Watch
$102K–$106K Zone (Current Area)
▶️ Price is sitting inside a Bullish Order Block + Fair Value Gap (FVG).
▶️ This is a strong support zone.
▶️ If this area holds, we could see a move back up toward $110K or even higher.
$93K–$96K Zone
▶️ Another clean Bullish OB + FVG combo.
▶️ If BTC breaks down from the current zone, this is the next major area where Smart Money might step in to buy.
$83K–$87K Zone
▶️ Deep discount zone, far below equilibrium.
▶️ If price reaches here, it’s a high-probability reversal area.
What Smart Money Might Do
▶️ If BTC holds above $102K–$105K, bulls could regain control and retest the highs near $110K.
▶️ If we break below this zone, expect a pullback toward $94K–$95K or even $87K, where more demand is waiting.
Fair Value Gaps (FVGs)
▶️ Several FVGs are visible, especially between $98K–$103K and $93K–$96K.
▶️ These gaps are areas of imbalance where price is likely to return and fill before the next move.
Summary
▶️ BTC is currently in a decision zone.
▶️ Holding above $102K = bullish continuation likely.
▶️ Breakdown = retracement into deeper bullish zones.
⚠️ As always, wait for confirmation on lower timeframes before entering any trade. Let the market show its hand.
Stay patient. Smart Money doesn’t chase—It waits.
NFA & DYOR
BTCUSDT
Bitcoin 1D Technical Commentary & Bias Path - Bitcoin is currently trading at 104,521$
- The previous weekly close for BTC wasn't bullish and the following print or the current candle print does not indicate any bullishness based on the current price behaviour
- The drawings indicate that Bitcoin printed a new ATH, trapped many retail longs, and deviated right below the ATH by publishing a strong bearish print
- The following print after the ATH liquidated many late longs and also showed high sellers interest getting aggressive, now we have 2 possible playouts for BTC
- 1st path shows we can fall and fill the inefficient gap at 97,000$ flip a market structure shift to bullish and then pierce fresh highs
- The 2nd path shows we can simply purge the 1st inefficient gap and pierce through the second one which will eventually cascade a lot of liquidation and then we can finally move higher by bringing in extreme Fear

Intraday Long Setup | June 1st 2025 | Valid Until Daily ClosePrice is retracing to a strong pivot zone (marked by the red box).
Structure remains bullish with potential for continuation after pullback.
The green box represents a high-probability long opportunity with tight risk control.
Watch for price reaction within the red zone. Entry only if confirmation (e.g., bullish engulfing, strong wick rejections) appears.
The setup expires at end of the daily candle close.

Bitcoin to 101.500 support ?Bitcoin continues to trade within a well-defined descending channel, respecting both the upper and lower bounds consistently. Price is currently rejecting the midline of the channel, suggesting bearish continuation. A fresh short position has been marked, with a tight stop above local structure and a projected target at the lower boundary near $101,528, offering a favorable risk-reward ratio. Until price breaks convincingly above the channel, the trend remains bearish.

BTCUSDT - PLANNING (next two days)BTCUSDT - PLANNING
BTC is expected to follow the pattern shown in the chart, with a corrective pullback followed by an upward move. BTCUSDT will likely retrace to around the 106k level, where it may face another wave of decline. At this point, BTC will attempt to form a peak, but don’t expect a long-term rally just yet.
Action Plan:
For Long positions: Wait for the H1 timeframe to complete its pullback. After the correction, target the 103.8k region for entries (Note: For Long trades, don’t expect it to reach 106k if negative news emerges).
Priority: Hold Short positions at higher levels and add to Shorts when the price retraces to form a new H1 peak, as shown in the chart.
Strategy: Focus on Long Scalping first, then switch to Swing Short immediately after.

BTCUSDT Price Analysis – Potential Drop Incoming! 🔲 Chart Zones
🟥 Resistance Zone (~111,000–112,000):
Price has touched this zone multiple times and failed to break higher – this is a strong resistance area. 🚫📈
🟪 Support Zone (~101,000–102,000):
A historically strong demand area where price previously bounced up. 💪📉
🔍 Current Price Behavior
📊 Price Level: Around 108,666.66
🔄 The chart shows lower highs forming, indicating weakening bullish momentum.
📉 Bearish projection drawn (blue zigzag line) suggests a potential double top forming below resistance.
📉 What’s Expected?
🔵 Big Drop Alert! ⬇️
If the price fails to break above and gets rejected again, the chart predicts a sharp move down toward the support zone.
🎯 Target Area: ~101,000–102,000 (Support zone)
📌 Summary
🧱 Resistance holding strong
💤 Momentum slowing down
⚠️ Bearish move likely
🏹 Targeting support zone for potential bounce
⚠️ Trading Tip 🧠
Watch for confirmation before entering trades! A break below the recent lows could trigger a short opportunity, while a bounce near support could offer a buy setup. 🛑📈

BTC Bull Run Ending Soon?"September could mark the climax of Bitcoin’s bull rally, triggering a correction phase as smart money begins profit-taking — key levels like $74,457 and $48,888 may become attractive accumulation zones in the upcoming bear market."
Disclaimer : This content is for informational and educational purposes only and should not be considered financial or investment advice. Cryptocurrency trading involves significant risk and may not be suitable for all investors. Always do your own research (DYOR) and consult with a qualified financial advisor before making any trading decisions.

Bitcoin Dumped form $111800 to $107800 so What next?🚨 Hope you caught the top short at that Bearish OB!
CRYPTOCAP:BTC dropped from $111.5K → $107.8K
Next Key Level: $105K
Hold = Bull Mode On 🟢
Break = Say Hello to < $100K again 😬
Reminder: Don’t gamble your hard-earned money. Trade smart.

Technical Levels Respected – BTC Reaches $108K Target📍 BTC Target Hit with Precision!
✅ As predicted in the previous analysis, Bitcoin has successfully tapped the $108K resistance zone — clean and technical execution!
📊 My chart spoke in advance... and the market listened.
🎯 Why miss out on these accurate forecasts?
📉 My strategies are not just random lines — they’re built on solid market structure, EMAs, and key price action zones.
📢 Let’s stay connected!
🧠 I’m committed to sharing educational content and professional trading insights to help you grow as a trader.
💡 Whether you're a beginner or seasoned trader, there’s always something new to learn with me.
📚 Join the journey — learn, trade, and win!
📩 DM or follow to get consistent updates and chart breakdowns.
🚀 Let’s trade smart, not hard!

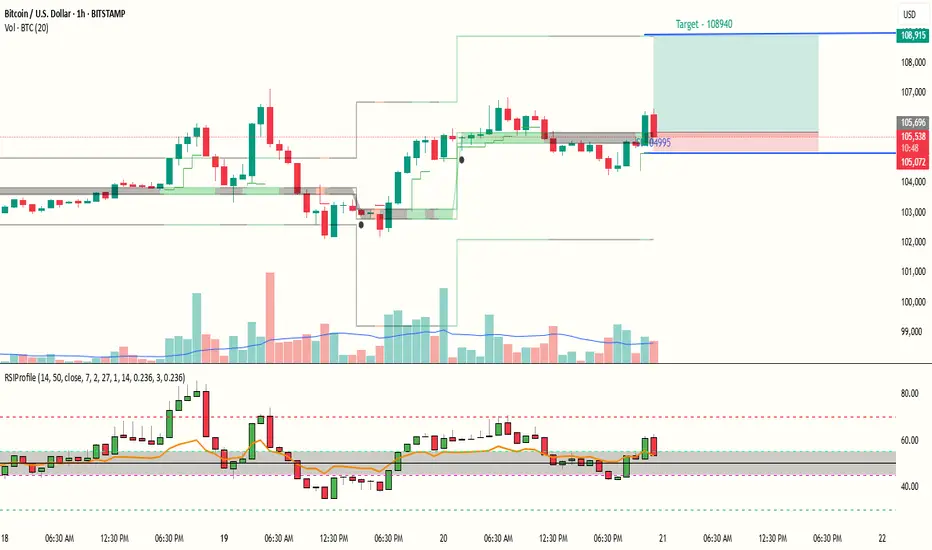
BTC ready for continuation of UP move with a reward ratio of 5RSI Profile shows a positive trend for BTCUSD and and risk reward ration is above 5. Also a Bullish triangle pattern seems to reach near complete on BTC Chart. Price is above RSI Point of Control, hence a small SL below POC and target is near the Value area High.
Entry near 105600
Target near 108940
Sl near 104995
RR : 5.16
PS : Above is only for Educational purpose and does not constitute any financial advice. Do your Own Research.
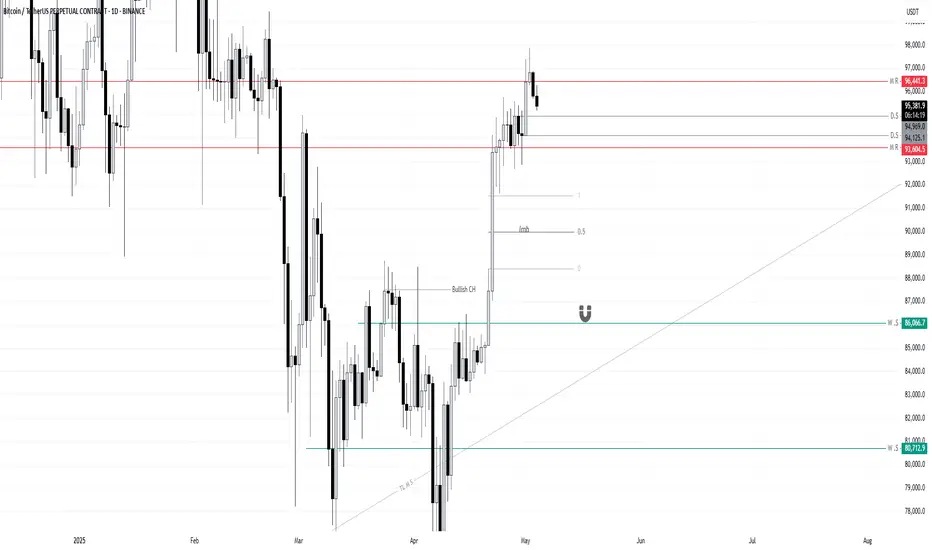
Bitcoin 1D Technical Commentary Paths- Bitcoin is currently trading at 105,148$
- Bitcoin is trading at a crucial BUY SIDE Liquidity area where breakout traps are highly possible, ATH was 109,490$ one tap above that will make retailers open aggressive longs and make them super bullish too
- Bitcoin printed an impulsive move from 88,000 which led to large imbalanced candles getting printed and it eventually printed 2 Inefficient gaps which is likely to get filled
- We have 2 paths, we either print a new high and fill 96,000 before we move up again or else we move towards the inefficient gaps and then print a new all time high

H4 BOTTOM DETECTION: WE’VE HAD TIMELY BUY SIGNALSH4 BOTTOM DETECTION: WE’VE HAD TIMELY BUY SIGNALS
Waiting for D1 to form a peak to see a price drop to 91k, but D1 stubbornly refused to decline by Sunday night, so we must rely on H4 bottom detection to go LONG.
The price zone we discussed was 102.9k, and last night BTC reached 107.2k—hitting the target. Why did it hit the target? Because BTC is rising in this wave to set up for a correction, and we expect a sharp drop to the 91k zone this week.
What should you do with BTC?
Take profits on the LONG position from the 103k zone (cash out early, around 107k).
Wait for the H4 correction and D1 peak to SHORT.
H4 will likely see a few more candles before a corrective pullback; that’s the forecast. Keep monitoring to see how the D1 peak forms.
BTC’s pullback schedule is as follows:
Visit 98,000$, take a break, refresh, and hang out a bit at this level.
Then move down to 90k–92k (we’ll plan the next steps from there).
Note: We posted 11 hours ago, and TradingView still hasn’t allowed us to publish publicly.

BTCUSD LONG? QUICK REVERSAL SET UP WITH 1:2 RRHello traders, BTCUSD has fall more and came near the previous support zone we will try to capture small reversal trade here, buy BTCUSD if 15min candle close above 103150 our trade will be only valid if it's give closing above that lvl this is advance trade set up so wait for the trade to activate.
BUY BTCUSD ABOVE 103150(15MIN CANDLE CLOSE ABOVE THIS LVL)
SL:-102048
TP:-105500/107000 ZONE
HAVE A GREAT DAY

BITCOIN - SYMMETRICAL TRIANGLE FORMING WITHIN A BULLISH TRENDSymbol - BTCUSDT
Bitcoin is consolidating. A symmetrical triangle pattern is forming within the context of a prevailing bullish trend. Based on the current technical setup, it is reasonable to interpret this consolidation as a preparatory phase for a continuation of the upward movement.
Fundamental nuances have gradually improved over recent weeks, contributing to a moderate revival in the cryptocurrency market. From a technical standpoint, the market structure on the daily chart appears constructive. Following a period of strong upward momentum, the price has entered a consolidation phase rather than showing signs of reversal. The overall market remains bullish. After approximately 2–3 weeks of consolidation, a bullish distribution pattern appears to be developing. This cycle has repeated on two previous occasions. On the daily timeframe, the presence of extended lower wicks during the consolidation phase suggests that large market participants (whales) are actively absorbing downward pressure, thereby preventing the price from entering risk zones. Accordingly, it is likely that the current consolidation could persist for a time, and there remains the possibility of a retest of the triangle’s lower boundary or even a deeper move to test the liquidity zones around 1,01,400 and 1,00,700 before resuming the upward trend.
Resistance levels: 1,03,600, 1,04,400, 1,05,000
Support levels: 1,02,500, 1,01,400, 1,00,600
A downside scenario may be considered if the price breaks through the triangle’s lower boundary and stabilizes around the 1,01,400 level, potentially forming a pre-breakdown consolidation-assuming no immediate rebound follows.
However, at present, intraday trading strategies can be considered within the range of the ongoing consolidation. A breakout to the upside and continuation of the bullish trend would likely be signaled by consolidation within the 1,03,500 to 1,05,000 range, accompanied by price compression toward the upper boundary.

bitcoin zonecould this pink line act as a mirror? Can we perhaps range sideways in this region for a while and then shoot up eventually? It appears it can happen. These prices are uncharted waters so nothing can be said for certain. But we can hope for the best. Perhaps while bitcoin ranges there will be an eth season

BTC Bulls Must Defend $103K… Or Say Hello to $99K Again Bitcoin completed a clear 5-wave Elliott Impulse and is now forming an ascending wedge (abcde structure), typically hinting at a possible correction.
Key Levels to Watch:
🔴 Key Bull Level: $103,085 – must hold to maintain bullish structure
🟠 Support 1: $99,265 – breach = deeper pullback
🟡 Support 2: $95,965 – last stronghold for bulls
Outlook:
🔼 A breakout above the wedge = continuation toward $110K+
🔽 Breakdown below $103K = expect correction toward lower supports
Strategy:
➡️ Wait for confirmation. A wedge breakdown = potential short trade setup.
➡️ Breakout = bullish continuation. Always manage risk wisely.
Stay sharp, traders!

Bitcoin At Big Resistance level so What Next?#BTC/USDT Update – Price at Critical Resistance
The chart structure remains unchanged from our previous update.
🔸 After entry, price dipped ~5% below our zone, but has now printed a strong bullish candle, signaling potential upside momentum.
🔸 However, Bitcoin is currently trading at the upper boundary of the ascending channel, acting as resistance.
Key Level to Watch:
If the HTF candle closes above $99,500, it will signal strength, and I’ll consider closing short positions and initiating fresh long setups.
Important Note:
The current pattern resembles a liquidity trap, not a clean bullish continuation. That’s why I remain cautious.
✅ Plan:
🔸 Wait for confirmation > $99,500
🔸 Use tight stop-loss – no blind trades.
Stay sharp, monitor price action closely.

BITCOIN ON THE MOVE - BULLS IN CHARGE OR A TRAP AHEAD?Symbol - BTCUSD
CMP - 96000
BTCUSD has reached a new local high of 97900. The overall market structure remains constructive. However, its sustainability continues to be influenced by macroeconomic fundamentals and the performance of the S&P 500 index.
Recent gains have been supported by improvements in the US tariff landscape and the ongoing stabilization of US-China relations. Bitcoin's rally was further reinforced by the concurrent rise in the SPX 500, with which it maintains a relatively strong correlation. During the second half of this week, BTCUSD broke out of a two week consolidation phase, surpassing the resistance level at 95500 and establishing a new local high. A corrective movement is now developing within the confines of the existing upward channel.
The 95000 level represents a key liquidity and risk zone. If bullish momentum sustains above this threshold during a potential retest, the upward trend is likely to persist in the short to medium term. Conversely, a decisive break below 95000 may lead to a deeper decline toward the 92000–88000 range.
Resistance levels: 97425, 99475
Support levels: 95500, 92000
Market attention is focused on the 95500 support level, beneath which a significant liquidity pool has accumulated. Continued growth may result from a retest-induced rebound or a market imbalance favoring buyers. However, caution is warranted as upcoming economic data releases may significantly influence price action.
Important note: A return to the sell zone below 95000–95500, accompanied by an inability to sustain upward momentum, could lead to a broader correction and potential liquidation events.

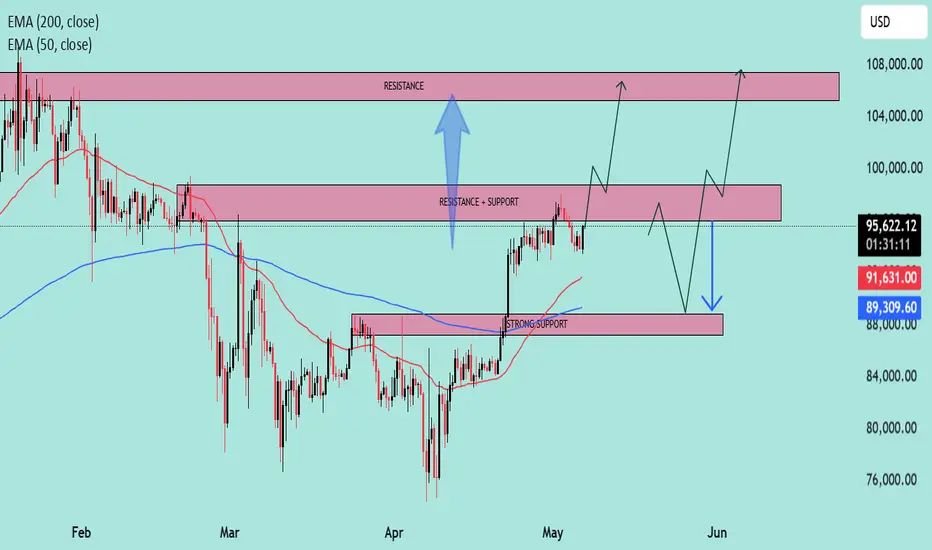
BTC at Key Inflection Zone – Breakout or Rejection Ahead?Asset: BTC/USD
Timeframe: 4H or Daily (based on visual pattern structure)
As of: May 6, 2025
Indicators:
50 EMA (Red): $91,615.79
200 EMA (Blue): $89,305.75
Key Technical Zones:
🔴 Resistance Zone: ~$104,000 – $108,000
This area has historically acted as a major supply zone.
Price has been rejected from this level multiple times, indicating strong selling pressure.
🔁 Flip Zone (Resistance turned Support/Support turned Resistance): ~$95,500 – $100,000
The current price ($95,234.23) is testing this zone from below.
A confirmed break and hold above could signal continuation toward the higher resistance.
🟢 Strong Support Zone: ~$88,000 – $91,000
Confluence of 50 EMA and 200 EMA adds strength to this demand zone.
Previous breakout level and accumulation area.
EMA Outlook:
50 EMA > 200 EMA: Short-term bullish crossover is active, indicating bullish momentum.
Both EMAs are sloping upward slightly, suggesting trend strengthening.
Price is currently above both EMAs, which acts as dynamic support.
Potential Scenarios:
✅ Bullish Scenario:
If price reclaims the $95,500–$100,000 resistance-turned-support zone:
Expect upward momentum to continue.
Target: $104,000–$108,000 zone.
Break of $108K could lead to a macro bull continuation.
⚠️ Bearish Scenario:
If price rejects the current zone and fails to hold above the $91,000 support:
Look for retest of $88,000–$89,000 area (confluence with EMAs).
Breakdown below that zone would invalidate bullish structure and signal potential deeper correction.
Summary:
Bias: Bullish above $91K, Neutral between FWB:88K –$91K, Bearish below $88K.
Key Confirmation Needed: Daily close above $100,000 for strong bullish continuation.
Risk Management: Watch for fakeouts within the $95K–$100K range due to past volatility.
As Per Technical StrategyAs per my Technical Strategy It gave sell Signal in 4 hours chart , previous buy was performed well... let us watch this sell signal. Also mainly Signal candle low has to break for further confirmation...

Bitcoin OutLook for Next Week BTCUSDT.pMarket Outlook (BTC/USD):
I’m currently observing the ₹94,125 level on the daily timeframe. A daily candle close below this level would significantly increase the probability of Bitcoin retracing toward the imbalance zone around ₹90,000.
However, there is a key demand zone near ₹86,000, which could act as a strong support and potentially push the market back upward. This area will be crucial in determining whether the bearish momentum continues or a reversal is triggered.
Let’s see how the market reacts around the ₹94,125 level. I’ll post the next update after Monday’s daily candle closes.
Thank you for your continued support — it's truly appreciated.
BTC/USD) bullish trend analysis Read The ChaptianSMC Trading point update
Technical(BTC/USDT) analysis outlines a bullish outlook with key technical levels and scenarios. Here's a breakdown of the idea:
Key Observations:
1. Trend Break and CHoCH (Change of Character):
The chart shows a clear break of the downtrend, confirmed by the CHoCH label — a common Smart Money Concept (SMC) signal indicating a potential trend reversal from bearish to bullish.
2. Key Zones Highlighted:
EVC-Buying Zone: Around 86,000 – 88,000 (aligned with EMA 200), marked as a strong accumulation area.
New Support Level: Around 92,000 – 93,000, potentially forming a bullish support after the recent rally.
Resistance Levels: Two major resistance zones near:
99,600 (intermediate resistance and target)
106,400 (final target)
3. RSI Indicator:
RSI is near 64, indicating strong momentum but not yet overbought — a potential sign of further upside.
4. Two Bullish Scenarios:
Scenario 1 (Aggressive Bullish): BTC continues upward from the current level and breaks above resistance toward the 106,447 target.
Scenario 2 (Retracement Bullish): BTC dips to the new support or even into the buying zone (86–88k), then rebounds to reach the same targets.
Mr SMC Trading point
---
Idea Summary:
The chart suggests bullish continuation, with potential pullbacks into strong demand zones. It supports both breakout and retracement entries, with targets at 99,632 and 106,447. If price holds above EMA 200 and RSI remains supportive, the upside thesis remains valid.
Pales support boost 🚀 analysis follow)

Bitcoin Wyckoff Distribution pattern Disclaimer: This is not financial advice. The following is for educational and informational purposes only.
Based on the current 1-hour timeframe, Bitcoin appears to be forming a potential Wyckoff Distribution pattern. If we see a liquidity sweep towards the upside—particularly around the 95,580 to 95,763 levels—and a subsequent bearish confirmation pattern forms on the same timeframe, we could anticipate a possible move down towards the 93,000 support zone.
Should the price fail to hold at that level, a deeper correction towards the 86,000 area could play out in the coming sessions. However, it is important to note that this scenario is valid only if a clear bearish structure forms post-liquidity sweep on the 1-hour chart.
No strategy guarantees 100% accuracy, and market conditions can change rapidly. This is merely a technical outlook and should not be construed as an investment or trading recommendation.
