Bitcoin CME gap not filled. Simple chart showing Gap Simple chart showing what remains of that CME gap and local lines of resistance above that may return BTC PA into the Gap zone.
BTC can often make a push higher on a Friday night, lining up for the weekend.
We have to wait and see what happens
BTCUSDT

Bitcoin IN CME Gap after Fib circle encounter - what now ?
As mentioned in a previous post, PA got "hit" by the same Fib circle that rejected the 2021 Cycle ATH - the difference being that PA got THROUGH the Fib circle Before turning down and so now, we slide down the outside, in a position of strength to be able to move higher when wanted.
As can be seen on the Daily chart below
This has also brought PA into the CME Gap as expected
Currently, PA is recovering having filled only HALF the gap.
I fully expect PA to return and complete the fill at some point.
Also note the rising line of support that we are heading towards. If we carry on like this, we intersect with it on 3rd March, Next Wednesday at a price around 77400
We will have to wait and see what happens there but this is also where the 50 week SMA will be and so, as said previously, I am expecting PA to bounce strongly
But this is Bitcoin....We have to wait and see what happens and react accordingly.
A Drop Lower would take us out of the Mid 20% Drops we have been having this cycle as can be seen on main chart.
The Next line of rising support on this chart is around -40% and is around the 100 week SMA
I am not to sure we will go there..... But.................

Bitcoin PA to Fill CME Gap UPDATE - Extraordinary GamesLet me explain - A CME gap, or Bitcoin CME gap, is the difference between the trading price of Bitcoin futures contracts when the market closes on Friday and reopens on Sunday. This gap occurs because the Chicago Mercantile Exchange (CME) is closed over the weekend while Bitcoin's spot market remains open, leading to price movements that are not reflected in the futures market until it reopens.
CME is old School Traditional Finance that uses Bitcoin. In fact, CME Group first started Bitcoin futures trading on December 18, 2017.
This was Way back when TradFi was putting Bitcoin down as a "Ponzi Scheme" and not many people had even heard of it.
And through its history, the CME Bitcoin Futures has often created Gaps for the reasons above. And these Gas ALWAYS Get filled. At Times, Rapidly as PA seems to bizarrely retreat to the Gap, Fill it and bounce back rapidly.
This can all be seen VERY clearly on the BTC1! ticker in TradingView. Go back through its history, you will see what I mean.
The Current Gap is, however, being fought over Very Hard by Bulls and Bears.
The CME Gap chart above shows you How Bulls have pulled the PA Back up just above the Gap.
Teasing the CME Bears
In my mind, I can see the Two Teams, New Age Finance wearing BITCOIN T-Shirts and the TradFi crew, wearing the "CME Gaps always get filled because we are Kings" T Shirts
The Daily chart shows us how the 200 day SMA acted as support just above the Gap
And the Weekly chart shows us how that 50 SMA ( red) just just out of reach on the other side of the Gap.
If we look at the Range from March - Sep 2024, we can see similar patterns.
The 2 rounded Tops , the slide down to a low.
We are currently seeing a bounce back, off the TOP of the CME Gap....PA can smell that gap, the Gap can smell BTC PA, just cannot touch it
This bounce may or may not reach the mid 90K before turning down again but it will turn down again, I am sure of that. PA is not ready to reach for New ATH
But See that Long wick down in summer 2024 ? This is what may happen to fill the Gap.
Ultimate though, We are waiting for the Weekly MACD to reach Neutral. THIS is what gives PA strength to reach higher, to a new ATH.
The CME would like that Gap filled BEFORE PA pushes up and out of Range
Because of this sharp drop in price recently, and if it continues, MACD could reach neutral by End of April ! and not June as previously
But to sustain this angle of decrease, PA would have to go as low as 55K, reaching the Long Term rising support ( Dotted line of the weekly chart. This is also where the 100 SMA ( Blue) Sits
I do not think that will happen but if PA Drops below 70K, I will begin to reevaluate my positions.
So, I expect Pa to bounce around for a while, as in the previous Range in 2024
For now, we see the Bulls and Bears Teasing each other over this CME Gap.
Who will win this battle. Will the BTC Bulls submit and allow the gap to be filled ?
I hope so, I have a buy order at 78200 ;-)
It maybe one of the last chances to buy BTC that cheap
Exciting days ahead
COME ON BTC BULLS>...

Bitcoin Daily just landed on the 200 SMA - what now ?Many people are expecting Bitcoin to Bounce off the 200 day SMA ( yellow & Arrowed)
But I just want to point out what happened last time we tanged for a long time.
We did NOT bounce of it untill PA was ready to
In fact, er fell below numerous times.
So, SORRY, don;t get your hopes up BUT we can watch and react.......
It may bounce but I doubt for long.....
Time will tell

Is Bitcoins NUPL showing us we already had 2 cycle Tops ?As explained by Trading View
"Indicator Overview NET UNREALISED PROFIT LOSS - NUPL
This indicator is derived from Market Value and Realized Value, which can be defined as:
**Market Value: The current price of Bitcoin multiplied by the number of coins in circulation. This is like market cap in traditional markets i.e. share price multiplied by number of shares.
**Realized Value: Rather than taking the current price of Bitcoin, Realized Value takes the price of each Bitcoin when it was last moved
It then adds up all those individual prices and takes an average of them. It then multiplies that average price by the total number of coins in circulation.
By subtracting Realized Value from Market Value we calculate Unrealized Profit/Loss.
The Net Unrealized Profit/Loss (NUPL) for Bitcoin can drop due to several factors.
One significant reason is the correction in Bitcoin's price
This price correction can push the NUPL indicator closer to the fear area, which begins after a drop below 0.25.
Additionally, short-term holders (STH) may still be experiencing capitulation, indicating that new investors are still underwater.
This can cause the NUPL to reflect deeper pessimism among newer investors, even if the overall market sentiment shows signs of optimism.
SO, we can see from the chart how, back in 2021, NUPL went up and peaked twice - each occasion was around the 1st major ATH and then Cycle ATH in Nov 2021.
Also note how the NUPL was lower the 2nd time round as Most major profit taking had been taken in March and so the next lowest Buy price was on the Dip before PA began to rise, and so the profit margin was lower
We have just experienced a similar thing this cycle..The peaks of profit taking were a similar number of days apart and om a similar Range to 2021
And now, we see the NUPL Dropping.
This is. to remind you, the fact that PA is dropping and Short term holders, who bought High, are now in Loss, underwater.
Does this mean that we are at cycle end ?
NOT AT ALL
But it does very clearly show how all th epeople that said "This time is different" WERE RIGHT
So, Hang on Guys and Gals, - it is different,
Keep your eyes on NUPL,it is a great way of seeing Market Profits and how, when nthis is high, Profit taking is very likely to happen
It is also a great signal as to when to BUY, when this is Low....it is usually because PA is LOW

BITCOIN TESTING $87K - FALSE OR TRUE BREAKDOWN?Symbol - BTCUSD
CMP 87100
BTCUSD has entered a risk zone, exhibiting a breakdown of the key support level. The market's attention is now on the bulls and their ability to maintain their defense. On the daily and weekly timeframes, the price is in a phase of global consolidation following a period of significant upward movement. The focus remains on the $90-91K range, a strong support area that aligns with the broader trend. Currently, a breakdown of support appears to be unfolding.
On the local timeframes (H1 - H4), the price is testing the support of the local channel, as well as the risk zone at 87,000. If the bulls are able to sustain their defense above 86,400 level, Bitcoin could potentially strengthen. In this scenario, the primary target would be $91-92K
Key support levels: 86,400, 85,530
Key resistance levels: 89,400, 91,600
Historically, the most significant price movements tend to occur after a false breakdown. However, the critical factor here is whether the breakout is genuine or false. In this case, confirmation is required — specifically, price consolidation above the key zones and levels.
Regarding my previous BTCUSD analysis, I had projected a decline to the $90K risk zone while Bitcoin was trading around $96-97K at that time. After some consolidation, the analysis proved accurate as Bitcoin dropped to the $90K range.
I believe this recent sell-off has disrupted the previous bullish structure, and a bearish structure is now beginning to take shape. I expect a retracement to the $91-92K range before the downtrend continues.

So, the Range box WAS hiding a Secret - what now for Bitcoin
2 days ago, I posted and showed why the Current Range Box of Bitcoin may have had a bearish secret and, well , It happened.
Currently, PA has fallen out of Range and is sitting on levels of Low support
And, as I have been saying since November, there is a CME Gap from 80700 down to 77535
This Gap may get filled as this could be an excellent opportunity to do so.
It is also a great chance for us mere mortals to buy a few More Sats of a Bitcoin at a cheaper price than previously.
And I will, I do not believe this cycle is over yet...
Notice the 2.272 Fib line at 78920 which will offer support and then, just below that we have a rising Long Term line of support at around 76100, depending where PA hits it, should the support above fail.
Of course, we should remember that PA may turn around now, and reclaim a higher high
We have to Watch and react to what happens...
Stay safe

Is Bitcoins Range Box maybe hiding a bearish secret ? CAUTION ?
I have been talking about his range box that PA is in for a while and, at the same time, referenceing the previous 2 times PA has done this this Cycle.
But I also pointed out recently how this range is slightly different and possibly in a bearish way..
And I just found this on a 4 hour chart, which if true, could point towards PA taking a sudden drop to bottom of Range or Lower.
As you can see, PA has ranged across and just got rejected off the Upper trendline of a descending channel. The Fib Retracements levels seem to offer support
There is a vertical line on 1st April to give you a marlker to work on as main chart is a daily and this chart is 4 hour.
PA could continue to range horizontalyt till around 3rd March before hitting trend line again.
If PA tries to break out, it will hit it earlier.
In my head, I always have that Still open CME Gap at 77K - 82K
This is a perfect opportunity to buy Bitcoin at a discount if we get down there.
I do have an open SPOT BUY order at 78600 just in case. I would not expect PA to remain down there for very long, so I have placed my order above what I consider to be the possible Low.
None of this may happen BUT I find it prudent to be aware of all possibilities.

BITCOIN PA got rejected by the same Fib Circle as Nov 2021 ATH
This may not really Mean anything other than to show how amazing Fib Circles are and how they have a legacy in the past, even if the anchors are in the future.
Let me Explain.
To Draw a Fib circle, on the whole, we place one Anchor on a Low point of PA and then place a 2nd on a high
These Fib Circles have their Anchors in Early 2023
But Look how these Circles cross PA back in 2021.
The Current Circle that PA just went through and then turned down in the 2.618
On the Left side of the chart, see that Fib Circlwe that rejected March 2021 ATH..thats the 3.618 which we will cross again from July 2025
See what happened with the inner circle, the 1.618, on both occasions the PA ran into it.
Just somethin to think about while we wait for BTC PA to Dip down to 77K and bounce back up ;-)

BITCOIN IS HEADED TO 90K?Symbol - BTCUSD
BTCUSD is reflecting a shift in market sentiment, with its current price action indicating a potential continuation of the ongoing correction. BTCUSD is currently trading within a falling channel pattern, with global market consolidation providing the broader context. There is a possibility of another retest of the 90,000 risk zone. On the medium-term timeframe, Bitcoin has failed to maintain its position near its all-time high, entering the local selling zone below the 99,800 level, and is now within the upper consolidation range. This shift is accompanied by a noticeable negative sentiment within the cryptocurrency market. Altcoins continue to experience persistent declines without any signs of recovery, further highlighting the lack of positive prospects. At this stage, Bitcoin appears to be reacting to the lack of fulfillment of promises from President Trump, as well as ongoing market manipulation and geopolitical tensions. These factors are contributing to the market’s protracted correction phase. New coins created ahead of the U.S. election have siphoned liquidity from the market, adding to the bearish sentiment. This situation, combined with a global trade conflict, has led to a significant market downturn.
Support levels: 95,800, - 91,300, - 90,000
Resistance levels: 1,00,300 - 1,02,670
Technically, Bitcoin may continue its downward movement, potentially testing the 90,000 support level again. As the price approaches this level, the risks surrounding it will increase. Currently, the asset is in a consolidation phase between 95,800 and 1,00,300 which could precede a breakdown and further decline towards 90,000. However, considering Bitcoin’s sensitivity to U.S. political actions, there may be a temporary rise towards the 1,00,300 level before the asset resumes its decline. The likelihood of the price testing the 95,800 level for a breakdown and subsequent fall remains high. However, on a broader scale, the asset still maintains a bullish outlook, with strong support placed in the 90K-91K zone.

Could Bitcoin PA head down to fill CME Gap at 82K-77K usdt
And the answer is "Very possibly"
50 SMA ( RED ) -100 SMA ( BLUE ) - 128 SMA ( GREEN ) - 200 SMA ( YELLOW )
For a start, Lets Look at what the 50 SMA did in the previous range.
PA bounced off that 50, having tested it 4 weeks previously ( see wick down )
I can see no reason why that would not happen again if PA reaches this point.
But we are now seeing the 50 beginning to flatten out after 3 months of PA ranging.
The CME Gap exists since 11 Nov 2024
Price range of Gap is 80720 down to 77535
On the main chart, See how that 50 SMA is currently flattening out just under this range ?
If PA comes down to the 50 SMA for support, it will fill that CME gap.
Notice also how there is a similarity to the pattern of PA from that Range in 2024, though it seems we are experiencing a contracted version.
As mentioned in previous posts, this range is also different in that we are under a 618 Fib Ext.
Little Support below.
This does not mean we will not bounce, indeed, I think we will but ultimately, I can see PA visiting that CME Gap, even if it is just a flash Wick down.
It is a superb opportunity to buy BTC at a lower price

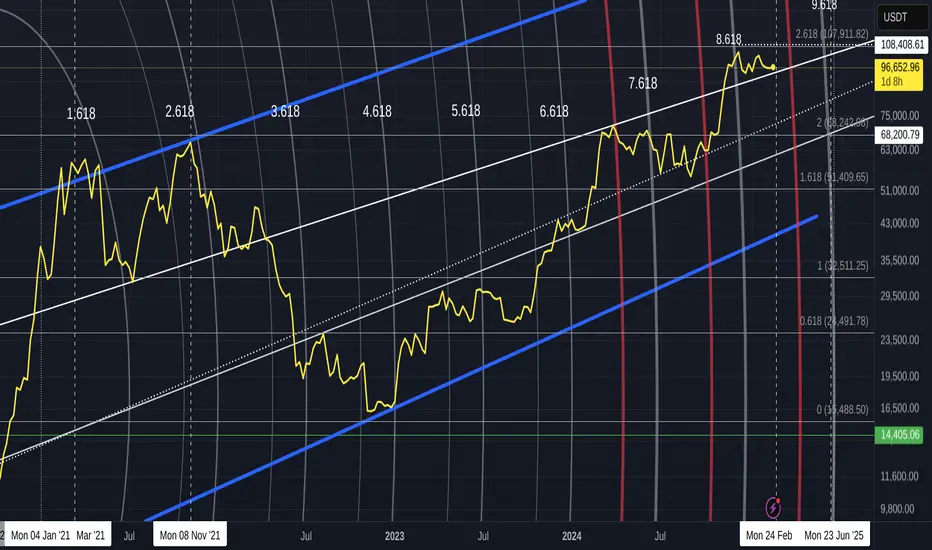
Here is why Bitcoin cycle ATH in Q4 maybe @ 250 K USDT
This is my oldest chart
I trust this chart - Keeping iot simple
See the Pennant PA is currently in, under resistance of the 2.618 Fib Ext.
Previous 618 Ext have been support this cycle and this leads me to think we will remain here a while.
The Rising line of support we are in pushes PA to an apex in June and PA will react shortly before that time. ( PA may drop below support and then return before June)
Weekly MACD currently falling Bearish, resetting and should be Neutral by June and so I am seeing PA rising from there.
See how PA reacts to a Fib Circle. In this Cycle,
Note that this apex of the triangle we are currently in is just after the 9.618 Fib Circle.
IF we range into the Fib circle in June, I fully expect PA to Rise after
Last time we ranged into a Fib circle with a Neutral MACD, was in Jan 2023 on the 4.618.
This lead to a rise of just under 100%
The Upper Blue Trend Line is the Ascending line of the previous Bitcoin ATH Tops, back to 2017 on this chart but to 2013 on Longer range charts.
Many charts have confluence for a cycle Top in Q4 2025 and so, using that blue line, the expected push higher from BTC PA when it breaks out of pennant in June ( or near June), we end up around the 250K USDT mark
This would, like in Jan 2023, lead to a increase in Price around 100% ( a little more actually )
While this is all based on Assumptions that PA remains Calm and in Range while the MACD resets itself from Oversold, it has happened before and there exists the chance it will again
Obviously, PA may fall through the floor and so we all need to have plans for Both Bullish and Bearish scenarios. ( there is a strong possibility of a Dip to Mid 70K and swift return )
But over all, I find THIS chart to point towards a more realistic cycle Top ATH of 250 K
Some LOG charts point to a near 1Million USDT Cycle top and that, given the market Cap required, is probably not going to happen THIS cycle....... But it will one day
As ever, we take Bitcoin PA as it comes.....and react accordingly.
This week is going to be Fun
End of Month on Friday - Monthly patterns showing some interesting things.
I'll explain those next week after month close.

Simple reasons for and against a Bitcoin push in near futureThere are so many people coming out with so many idaes about why Bitcoin should reach for New ATH's in March and, to some degree, it is possible though I am not to sure it would be a good idea now. Something will happen in March though, I am sure ogf that, just not to sure what.
For me, I like to keep things fairly simple. It has worked for me for many years.
So, Lets be simple about this and Look at some basic things
First of All, The Dreaded Hack yesterday that took the market into shock - Many ALTS Bled and are Still in shock.
Bitcoin took it in its stride and fell by -4.7% - It was Less than many a normal days pull back ! And today, we are Green. This shows MASSIVE under laying strength. The Support Structure of Bitcoin is Huge.
So, the the chart.
Reasons for a Push higher.
The Strength PA has, as just mentioned, is an obvious example of a simple reason to expect a push higher.The Daily MACD is Way down low, pretty well oversold and just ranging there, waiting....
But one thing I want to point out is the trend line that PA is running up. This is the trend line, with origins back 2017, that catapulted PA to the final 2021 ATH. It is strong support, that eventualy broke as the bear market cracked its whip, in 2022. But not before it support PA on two more occasions.
So, Can it do it again ?
PA does not need to react till we begin getting close to that Apex of the triangle we are now in, Which is in JUNE, But with the daily MACD Low and MACRO acceptance of Bitcoin and Trumps push to welcome Crypto, things may advance Quicker. PA certainly has the ability to move higher in the near future
The down side of that is simply, PA would run out of "steam"
Which brings me to why we may not see a push till JUNE and even then, that may just be the initial stage of the final push to cycle ATH. ( which I have said many times previously, is likely to be in Q4, maybe Early Q4 )
Look at this WEEKLY MACD chart
See where that projected line comes down to the Neutral zone...The date of intersection..JUNE
The last time weekly MACD was up here, as you can see, It fell in a very controlled manner and the angle of descent is the same as this projected line.
That happened while BTC PA Ranged across for 6 months
So, there it is, Nice and simple.
JUNE is the best time, or just before, for PA t make a move but it may try some Dances in the time till then
It can continue Ranging across in the Price range of 109K to 91K till then, Still making people money and keeping the world happy.
We can dive Deeper into all kinds of data, onchain etc, get all techie and confound people with new words...but end of the day, Bitcoin will still do the same thing as it always does.
MACD trading is a Latent method, as MACD shows you data after the event.....but it shows Trends.VERY WELL
My money is on the trend Range we are currently in, ending in around End of May to June.
This will lead to a series of New ATH's over 109K, all the way up to Cycle ATH in Q4
What happens than, That is going to be interesting to see.......but thats another story
Stay safe
BTCUSD SHOWING A GOOD UP MOVE WITH 1:7 RISK REWARD BTCUSD SHOWING A GOOD UP MOVE WITH 1:7 RISK REWARD
DUE TO THESE REASON
A. its following a rectangle pattern that stocked the market
which preventing the market to move any one direction now it trying to break the strong resistant lable
B. after the break of this rectangle it will boost the market potential for break
C. also its resisting from a strong neckline the neckline also got weeker ald the price is ready to break in the outer region
all of these reason are indicating the same thing its ready for breakout BREAKOUT trading are follws good risk reward
please dont use more than one percentage of your capitalfollow risk reward and tradeing rules
that will help you to to become a bettertrader
thank you

BTCUSD SHOWING A GOOD DOWN MOVE WITH 1:10 RISK REWARD BTCUSD SHOWING A GOOD DOWN MOVE WITH 1:10 RISK REWARD
DUE TO THESE REASON
A. its following a rectangle pattern that stocked the market
which preventing the market to move any one direction now it trying to break the strong resistant lable
B. after the break of this rectangle it will boost the market potential for break
C. also its resisting from a strong neckline the neckline also got weeker ald the price is ready to break in the outer region
all of these reason are indicating the same thing its ready for breakout BREAKOUT trading are follws good risk reward
please dont use more than one percentage of your capitalfollow risk reward and tradeing rules
that will help you to to become a bettertrader
thank you

BTC#16: Price reaction has changed positively.BTC break out SW?💎 💎 💎 In recent days, although important data information has been released, BTC is still in the Sideway zone and there are some positive signs. We continue to plan the next 💎 💎 💎
1️⃣ **Fundamental analysis:**
📊 Financial report, Fed Logan said that if the labor market remains strong, better inflation data does not necessarily mean the Fed can cut interest rates. Inflation data in the next few months will be very important; also pay attention to changes in geopolitics and policies; the impact of these factors on the economy is being closely monitored.
🚀 GameStop is considering investing in Bitcoin and other cryptocurrencies.
Three sources said GameStop is exploring investing in alternative assets, including cryptocurrencies, especially Bitcoin. GameStop shares rose nearly 20% in after-hours trading following the news.
2️⃣ **Technical analysis:**
🔹 **D Frame**: We can see that although the price has not yet escaped the Sideway zone, the continuous appearance of higher lows is a positive signal to pay attention to.
🔹 **H4 Frame**: After the price reaction at 94x, although the 97x zone has not been penetrated, the price reaction in this area is giving positive signals
🔹 **H1 Frame**: The price structure has a change from bearish to bullish. If the trendline area continues to hold, there is a high possibility that the bulls will continue to dominate next week.
3️⃣ **Trading plan:*
⛔ The economic data released last week brought many fluctuations to the US dollar, but the price of BTC still did not have any significant changes. However, with the current price reaction, we should not apply the trading strategy in the SW price zone anymore. The 2 price zones have been tested quite a lot. This is a sign of an upcoming strong fluctuation
✅ The short-term price structure is in favor of the bulls. We can consider looking for a position if the price structure shows signs.
💪 **Good luck trading!**

BTC#14: Bitcoin Is Resurgent? Bulls Are Back or Just a Scam?💎 💎 💎 As analyzed in the previous article, BTC tested the trendline and then turned down. However, the price did not fall too much and we saw a recovery. Let's plan BINANCE:BTCUSDT the next trade 💎 💎 💎
1️⃣ **Fundamental analysis:**
📊 The US dollar index DXY is up more than 0.50% on the day and is currently at 108.40; US regulators are piloting tokenization, using stablecoins as collateral.
🔹The Texas Bitcoin Reserve Act has been submitted to the Senate Finance Committee for consideration;
🔹US Senator from Florida proposes Bitcoin investment bill.
🔹 New bill in Montana, USA allows investment of up to $50 million in Bitcoin;
🚀 Standard Chartered Bank: Bitcoin expected to break record high as US Treasury market environment is favorable for digital assets.
📌 Overall policy implications for Bitcoin have restored optimism to the market.
2️⃣ **Technical analysis:**
🔹 **D Frame**: A green pinbar appeared at the end of the week, bringing positive signals to the market. The current price line is also supportive as the price breaks above the candle wick top.
🔹 **H4 frame**: Although the downtrend has not been broken, the 96K area is still acting as an important support zone. 2 pinbars are a clear sign that we will see a recovery for BINANCE:BTCUSD
🔹 **H1 frame**: The temporary downtrend price structure has been broken. However, the resistance zone of 98k - 100k is also very close.
3️⃣ **Trading plan:*
⛔ The current SW zone has been maintained for quite a long time. We will need to wait for clarity on the price line because the downtrend price structure in the H4 frame has not been broken yet
✅ Currently, looking at the positive price reaction for this area, the market is leaning more towards the bulls. However, establishing a BUY position at this time is riskier. We can wait for the price structure as on the H1 chart to choose a position.
💪 **Good luck trading!**

OMUSDT - TRIANGLE BREAKOUTSymbol - OMUSDT
OMUSDT is a noteworthy asset in the current market context, as it stands out as one of the few coins exhibiting bullish momentum while many altcoins are experiencing successive declines. The situation may be partially influenced by BTCUSD, should Bitcoin undergo a more significant downturn, this could impact the broader market, as no asset would be immune. However, locally, Bitcoin appears to be forming a resistance breakout. If the bullish trend persists, OMUSDT could find a catalyst to support its upward movement.
At present, attention is focused on the resistance level of the triangle pattern and the base of the 5.6755 structure. Two potential bullish scenarios should be considered: growth following a breakout above resistance or a rebound after a false breakdown of support.
Resistance levels: 5.9822, 6.3000
Support levels: 5.7500, 5.6755
Currently, the price is consolidating within the bounds of the triangle. However, once the resistance is broken, the market may enter a realization phase, with a potential sharp upward impulse. Beyond the 6.3000 level, there are no significant resistance levels to be encountered.

BTC#13: Market Shaking! Where is BTCUSDT Price? 💎 💎 💎 As predicted in the previous article, the price touched the H1 trendline zone and then had a correction back to the 96K support zone. Now we will continue to plan for BTC 💎 💎 💎
1️⃣ **Fundamental analysis:**
📊Maryland, the United States plans to establish a strategic Bitcoin reserve fund
🔹US non-farm payrolls increased by 143,000 in January, lower than expected;
🔹Trump plans to announce retaliatory tariffs as early as Friday
🚀 Interest rate futures traders expect the Fed to make another rate cut in May
📌 Overall, the current fundamentals are still supporting BTC's upside potential. However, market liquidity is still being affected by Trump's tariff policies and potential future trade wars from these policies
2️⃣ **Technical analysis:**
🔹 **D frame**: A long-tailed pinbar appeared when the price reached the 99K resistance zone. However, the 96K support zone is still doing its job well. For a clearer view, we will evaluate the smaller time frames
🔹 **H4 frame**: The bearish price structure is still intact with no signs of change.
🔹 **H1 frame**: Although the bearish price structure was broken, it immediately turned down. The price reaction at the current support area is weak.
3️⃣ **Trading plan:**
⛔ Looking at the multi-frame price structure, it can be seen that this is not a suitable time to establish a BUY position. Basic information from the market is also showing concern about the upcoming tariff policy. If there is a change in the price structure from H1, then this possibility should be considered.
✅ Trading with the trend is still the top priority, 2 pinbars in time frame D also show that the market sentiment is leaning towards the bears.
💪 **Good luck trading!**

GBPNZD trade idea i'm looking for bearish move GBPNZD trade idea i'm looking for bearish move because previous daily candle closed in bearish and i need a 4h candlestick close in bearish engulfing so i go for short

BTC#12: Gathering signs from the price line
💎 💎 💎 Is plan #11 helping you make a profit?💎 💎 💎
🔥 As we analyzed the possibilities of BINANCE:BTCUSDT in the previous article, BTC temporarily entered the SW process. And here is the next plan for BINANCE:BTCUSD 🔥
1️⃣ **Fundamental analysis:**
📊 The Trump administration has taken the first step in loosening cryptocurrency regulations. The US SEC plans to reduce the cryptocurrency enforcement team
"eliminate excessive regulations" on digital assets.
🚀US senators from the state of Ohio have proposed a bill to establish a Bitcoin reserve fund and accept it as a form of payment.
📌The US sovereign wealth fund plan is expected to be implemented within 90 days
2️⃣ **Technical analysis:**
🔹 **D frame**: Looking at D frame, we can see that the downtrend is not over yet. If today's price surpasses yesterday's candle wick, we will see a more optimistic market situation.
🔹 **H4 frame**: The bearish price structure is not over yet. Currently, if the support zone of 96~97K is still waiting for evaluation
🔹 **H1 frame**: You can see that the price is close to the trendline. However, we are in a bearish price structure -> Don't rush to decide on this area.
3️⃣ **Trading plan:**
⛔As you can see on the chart, the downtrend has not been broken yet. We still need to wait for confirmation of the 96~97K area by the price structure. Be patient to wait for a better buying position and less risk
✅ Currently, finding a SELL position is in accordance with the price structure, but this price zone is not suitable for establishing a position. You can wait for the price to touch the larger trendline zone and consider the price reaction in that area to establish a position
💪 **Wish you successful trading!**

BTCUSDT TRADING POINT UPDATE >READ THE CHAPTIAN Buddy'S dear friend 👋
SMC Trading Signals Update 🗾🗺️ crypto Traders SMC-Trading Point update you on New technical analysis setup for crypto currency BTC USDT. Crypto traders last time post signals 🚀 hit sucksfully My target 🎯. Now post new analysis setup for crypto BTC USDT still holding it up 💪 trend 📉📈 now if close below and close above technical analysis BTC USDT close below 👇 97k next support strong 🪨💪 level of 89k. Don't close this level pullback up closed above 102k Next target 109. Wait for closing any said it take entry
Key Resistance level 102k + 106k + 109k
Key Support level 97k - 91k 89k
Mr SMC Trading point
Pales support boost 🚀 analysis follow)

BTC#11: Will BTC rise or fall?. Market structure perspective
💎 💎 💎 Did you make a profit in post #10? Please share and comment your thoughts 💎 💎 💎
🔥After the Monday morning dump, we witnessed an amazing recovery of BINANCE:BTCUSD . Market sentiment has improved significantly. We continue to plan for BINANCE:BTCUSDT as follows:🔥
1️⃣ **Fundamental analysis:**
📊Data: Stablecoin on-chain trading volume decreased by 10.5% in January and legal CEX spot trading volume decreased by 18.2%
🔴According to Bybit CEO Ben Zhou, the total value of actual crypto liquidations is higher than $2 billion, he estimates this figure at around $8-10 billion.
🚀Donald Trump signed an executive order to establish a US national investment fund.
📌 In general, market liquidity is falling sharply, the loss after the recent correction has brought a cautious mentality to the majority of investors in the cryptocurrency market.
2️⃣ **Technical analysis:**
🔹 **D Frame**: Yesterday's D candle marked the amazing recovery of BTC. Currently, the price structure of frame D is still maintained as an increasing price structure.
🔹 **H4 Frame**: Gives us a different perspective. Although BTC has recovered, the price structure of frame H4 has not been broken. We will have to wait a while before seeing a more positive signal
🔹 **H1 Frame**: As you can see, BTC is still running in the downtrend channel. The KEY 977xx zone will play an important role in predicting the next direction
3️⃣ **Trading plan:**
⛔At the present time. Although the D candle is a positive sign, in the smaller time frame we still do not have a price structure confirming the recovery of the main trend. Whether placing a BUY or SELL order in this area is very dangerous because there is no confirmed price structure. You should wait to get the best trading position
✅ Based on my personal experience, I will wait for the price reaction in this 97K area. If a supportive price structure appears, we can have a good position following the main trend in the D frame.
💪 **Wish you successful trading!**
📌 For any questions, please contact us directly. I am ready to answer you for free
