BTC/USD Bearish Outlook Analysis BTC/USD Bearish Outlook Analysis 📉🧠
📊 Technical Overview:
The BTC/USD chart is showing signs of a bearish structure formation, suggesting increased downside momentum in the short term.
🔻 Resistance Zone:
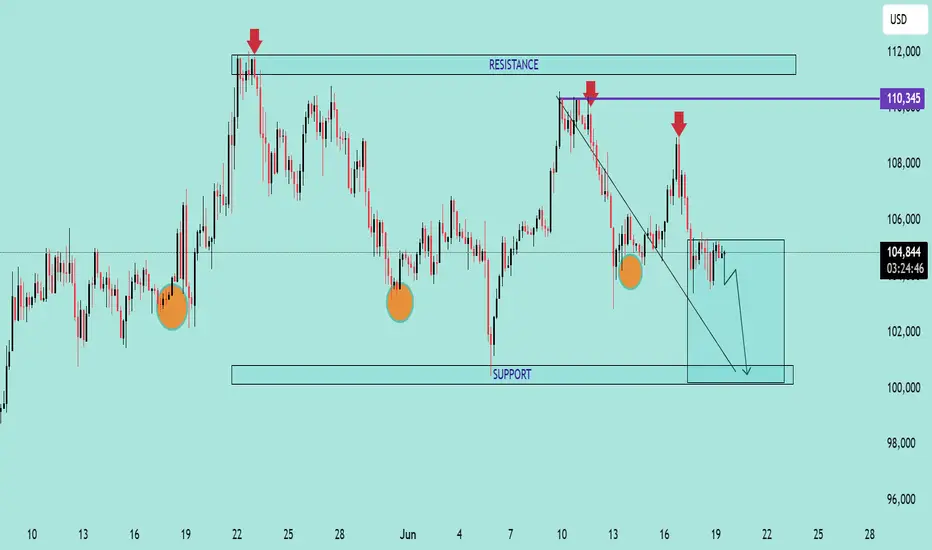
Clear resistance is identified near $110,345, marked by multiple price rejections (🔴 red arrows).
Price failed to break above this zone several times, indicating strong selling pressure.
🔸 Support Zone:
Strong support lies near the $100,000 psychological level.
Price has respected this zone multiple times (🟠 orange circles), indicating buyer interest.
📉 Current Price Action:
A descending trendline breakout attempt failed and price is now consolidating just below $105,000.
Price is forming a bearish flag/consolidation structure after recent rejection.
A breakdown from the current box range is likely to push BTC toward the support zone at $100,000.
📉 Bearish Scenario:
If BTC breaks below $104,000, expect continuation towards $100,000.
A daily candle close below support could signal further downside.
📈 Invalidation:
Bullish invalidation occurs if BTC reclaims and closes above $108,000, with volume, retesting resistance at $110,345.
🧭 Summary:
BTC/USD is exhibiting a lower highs structure within a descending channel. Unless it breaks above the resistance zone, the bias remains bearish with a high probability of retesting support.
Btcusdtanalysis
BTC/USD Potential Bullish ReversalBTC/USD Potential Bullish Reversal 🟢📈
🔍 Technical Overview:
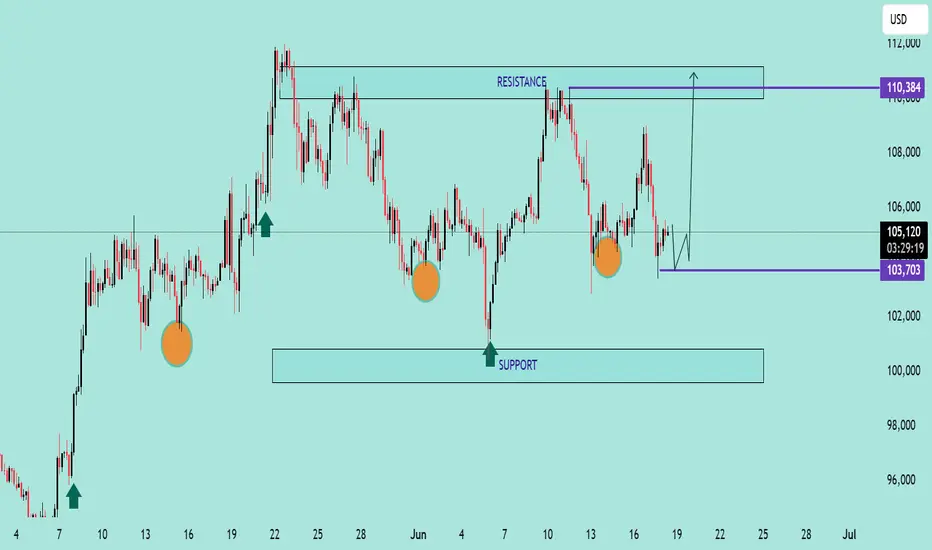
The chart shows a potential bullish reversal pattern forming near a key support zone. Price action has consistently bounced from the support range between $100,000 – $103,700, marked by multiple higher lows (🟠 orange circles), suggesting strong buyer interest.
📌 Key Levels:
Support Zone: $100,000 – $103,700 🛡️
Immediate Resistance: $110,384 🔼
Current Price: $105,202 💰
📊 Pattern Observed:
The price structure shows a possible inverted head and shoulders pattern forming, with the right shoulder currently developing. If this structure completes and breaks the $106,000–$107,000 neckline region, we can expect a bullish breakout toward the resistance target of $110,384 or higher.
📈 Bullish Confirmation:
Bullish rejection from support area ✅
Clean structure with repeated higher lows 📈
Potential breakout arrow suggests move toward the top resistance zone
⚠️ Watch For:
Price must hold above $103,700 to maintain bullish bias
Break below this level may invalidate bullish setup and retest the broader support zone near $100,000
📌 Conclusion:
BTC/USD is setting up for a potential upside breakout if the neckline is broken. Traders should monitor for bullish confirmation before entering long positions.
🔔 Strategy Suggestion:
Buy Zone: $103,700 – $104,500 (on bullish confirmation) 🛒
Target Zone: $110,000 – $111,000 🎯
Stop-Loss: Below $103,000 🛑
BTC/USDT 4H Analysis – Bullish Cup Formation 📈 BTC/USDT 4H Analysis – Bullish Cup Formation ☕🚀
🔍 Chart Overview:
The 4-hour chart of Bitcoin against USDT on Binance displays a clear "Cup" pattern, suggesting a strong bullish continuation setup. The price action reflects a rounded bottom forming after hitting a solid support zone.
🟣 Key Zones:
🔻 Support Zone: ~$101,000–$103,000
Strong buying interest was observed here with a sharp wick rejection, forming the bottom of the cup.
🔺 Resistance Zone: ~$110,000–$112,000
This area has acted as a historical rejection zone and now stands as the next major target for bulls.
📊 Technical Insights:
The price is gradually curving upward, respecting the rounded cup pattern, often a precursor to a breakout.
A clean break above the resistance zone may trigger continuation toward new highs, possibly above $112,000.
The price is currently at ~$107,700 and gaining momentum with higher lows forming consistently.
🎯 Price Projection:
📌 Target: $111,500–$112,000
📉 Invalidation: Break below the $103,000 support
💡 Conclusion:
If the bullish momentum continues and breaks past resistance, we can expect a powerful upside breakout. Traders should watch for volume confirmation near the resistance zone for potential entry or breakout trades.
📍Pattern in Play: Cup Formation
⚠️Watch for pullbacks before breakout attempts.

BTC/USD – Bearish Continuation from Rising Channel BTC/USD – Bearish Continuation from Rising Channel 🚨🧱
This chart indicates a bearish market structure with the following key technical features:
🔍 Chart Analysis:
Change of Character (CHoCH) 🔄
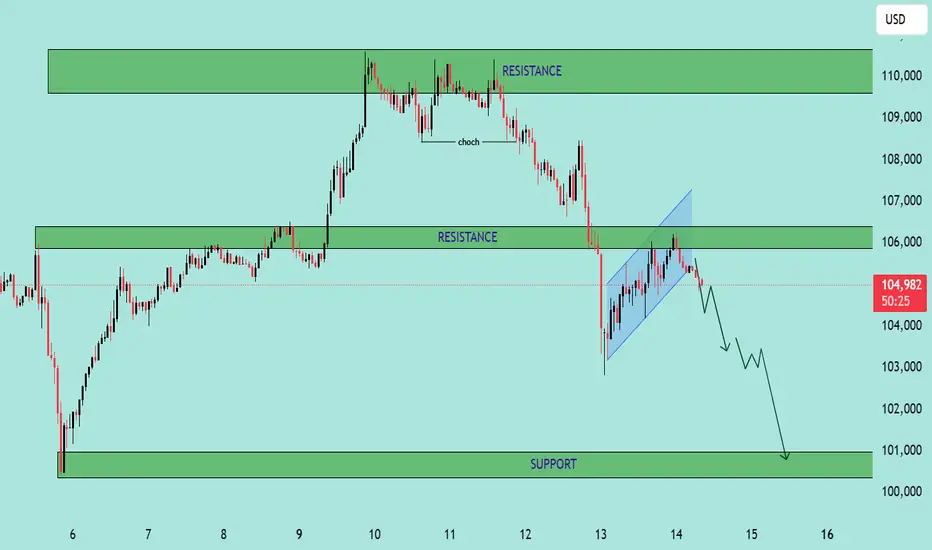
A shift from bullish to bearish was confirmed by a strong breakdown after the CHoCH marked at the top.
This breakdown invalidated previous bullish structure.
Bearish Flag Formation 📉📐
After the impulsive drop, price formed a bearish flag (rising channel), suggesting a potential continuation move to the downside.
Resistance Rejection 🚫
Price is currently testing and rejecting the 105,800–106,500 resistance zone, previously a support turned resistance.
The rejection from this level adds further bearish confluence.
Downside Projection ⬇️📍
If the pattern plays out, the projected move shows a potential drop toward the major support zone at 100,000–101,000.
📌 Key Levels:
Resistance Zones:
105,800–106,500 🧱
109,500–111,000 🧱
Support Zone:
100,000–101,000 💚
🧠 Conclusion:
The chart suggests that BTC/USD is in a bearish continuation phase, with strong rejection from key resistance and a confirmed breakdown from a bearish flag. Traders should watch for confirmation of continuation below 104,500 to target the 100k support level. Risk management is crucial near volatile zones.
$BTCUSDT quick short setup. OPENED CRYPTOCAP:BTC Short
Stop Loss : High $106300
Target : $104k
$102.5k

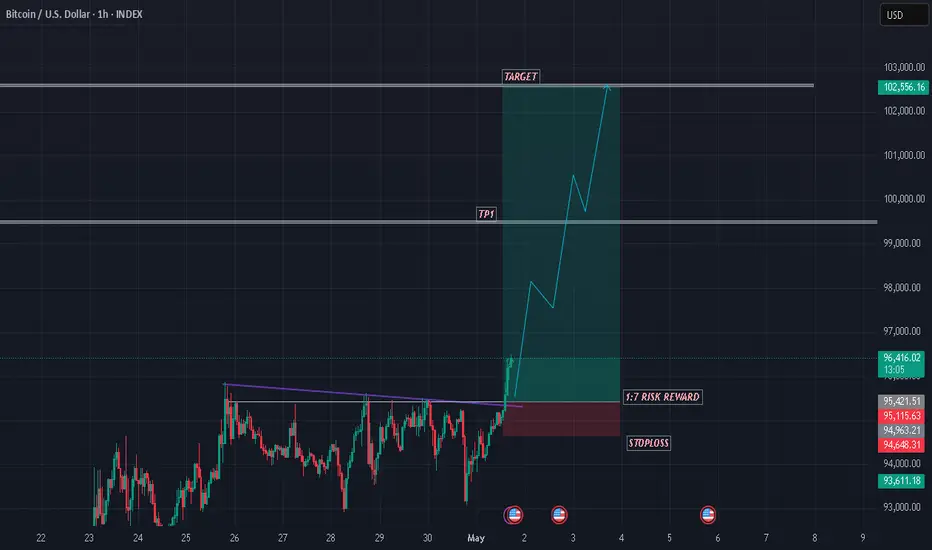
BTCUSD SHOWING A GOOD DOWN MOVE WITH 1:7 RISK REWARD BTCUSD SHOWING A GOOD DOWN MOVE WITH 1:7 RISK REWARD
DUE TO THESE REASON
A. its following a rectangle pattern that stocked the market
which preventing the market to move any one direction now it trying to break the strong resistant lable
B. after the break of this rectangle it will boost the market potential for break
C. also its resisting from a strong neckline the neckline also got weeker ald the price is ready to break in the outer region
all of these reason are indicating the same thing its ready for breakout BREAKOUT trading are follws good risk reward
please dont use more than one percentage of your capitalfollow risk reward and tradeing rules
that will help you to to become a bettertrader
thank you

Technical Analysis – BTC/USD Technical Analysis – BTC/USD
📅 Date: June 11, 2025
🔍 Key Observations:
🔴 Resistance Zone – $110,000 to $111,800
Price has tested this resistance block twice (🔴 red arrows) and rejected both times, indicating strong selling pressure in this zone.
Rejection candles show long upper wicks, suggesting failed attempts by bulls to break above.
🟢 Support Zone – $101,800 to $103,500
This demand zone has been respected multiple times (🟢 green arrows), showing a solid base for potential bounces.
Price action previously rallied strongly after touching this level.
📦 Supply to Demand Play
Price made a sharp bullish move from support to resistance (📘 blue box shows the impulsive move).
After reaching resistance, the price is failing to break above, indicating possible exhaustion of bullish momentum.
📉 Potential Move:
🔽 Short-Term Bearish Bias
If price fails to hold current levels and breaks below the small consolidation (after blue box), we may see a drop to ~$105,583 (🔵 purple line = key level).
If that breaks, next likely destination is the support zone around $102,000 (⬇️ downward arrow path).
⚠️ Risk Notes:
🔁 Watch for any false breakouts or liquidity grabs above resistance.
📉 If bearish momentum increases below $105,583, sellers may take control in the short term.
✅ Trade Idea (Hypothetical):
Sell/Short near resistance (⚠️ confirmation needed like bearish engulfing or failed breakout)
Target 1: $105,583
Target 2: $102,000 zone
Stop-loss: Above $111,800 (invalidates setup)
📌 Summary:
BTC/USD is currently stuck between a well-defined resistance and support range. Unless bulls break above $111,800 with strong momentum, the structure favors a potential pullback toward the demand zone. ⚖️

BTCUSDT Trade Analysis📊 BTCUSDT Trade Analysis
Previous Move (Sell)
✅ Sell executed successfully – target reached (🎯).
📈 New Trade Setup (Buy)
💡 Current Plan:
Switching to buy now as the market has reached the previous sell target.
New Target:
Next major resistance area near 111,025 – 111,072 USDT range (🟩 target box at the top).
📍 Key Levels:
Entry Zone: Above 105,000 USDT mini-resistance area (🟧 mini-resistance box).
Support: Around 102,999 USDT (blue support line).
Current Target (Buy):
Target zone: 111,025 – 111,072 USDT.
📌 Trade Plan Summary
Entry: Above 105,000 mini-resistance area break.
Target Point: 111,025 – 111,072 USDT 🟩.
Stop Loss: Suggested below 102,999 USDT to limit downside (🔴 red zone).
🎯 Conclusion:
🔵 Target for the buy move is well-defined and positioned above current resistance levels.
🟢 Awaiting price action above mini-resistance area for a safe entry for the next bullish leg!

H4 BOTTOM DETECTION: WE’VE HAD TIMELY BUY SIGNALSH4 BOTTOM DETECTION: WE’VE HAD TIMELY BUY SIGNALS
Waiting for D1 to form a peak to see a price drop to 91k, but D1 stubbornly refused to decline by Sunday night, so we must rely on H4 bottom detection to go LONG.
The price zone we discussed was 102.9k, and last night BTC reached 107.2k—hitting the target. Why did it hit the target? Because BTC is rising in this wave to set up for a correction, and we expect a sharp drop to the 91k zone this week.
What should you do with BTC?
Take profits on the LONG position from the 103k zone (cash out early, around 107k).
Wait for the H4 correction and D1 peak to SHORT.
H4 will likely see a few more candles before a corrective pullback; that’s the forecast. Keep monitoring to see how the D1 peak forms.
BTC’s pullback schedule is as follows:
Visit 98,000$, take a break, refresh, and hang out a bit at this level.
Then move down to 90k–92k (we’ll plan the next steps from there).
Note: We posted 11 hours ago, and TradingView still hasn’t allowed us to publish publicly.

BTCUSD SHORT! With 1:3 RR SET UPHello traders, I'm back with another advance trade set up, in BTCUSD 1H tf price is making LL & LH formation which suggests potential reversal from its highs. in bigger tf BTCUSD also comes near the previous resistance zone, so here we can go with short set up for good Risk to reward ration.
Short BTCUSD if 1H candle close below 102700
With SL:- 104500-105000 zone and Tp1)100000 & Tp2) 98000-96000 range it's a Swing trade so we have to wait for our tp, it's advance trade set up so entry will be valid only if it closes below 102700 lvl. Once you get 1:1 RR trail your sl and book part profits👍 I will post update in comments, have a great day

BTCUSD SHOWING A GOOD DOWN MOVE WITH 1:15 RISK REWARD BTCUSD SHOWING A GOOD DOWN MOVE WITH 1:15 RISK REWARD
DUE TO THESE REASON
A. its following a rectangle pattern that stocked the market
which preventing the market to move any one direction now it trying to break the strong resistant lable
B. after the break of this rectangle it will boost the market potential for break
C. also its resisting from a strong neckline the neckline also got weeker ald the price is ready to break in the outer region
all of these reason are indicating the same thing its ready for breakout BREAKOUT trading are follws good risk reward
please dont use more than one percentage of your capitalfollow risk reward and tradeing rules
that will help you to to become a bettertrader
thank you
Bitcoin (BTC) Technical Outlook – Caution Advised for Retail Tra🪙 Bitcoin (BTC) Technical Outlook – Caution Advised for Retail Traders
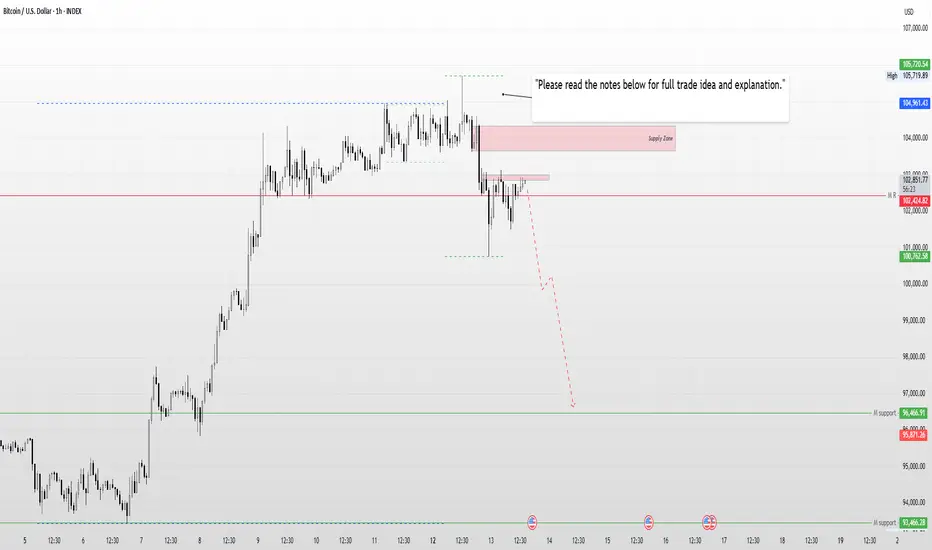
The broader market structure for BTC remains bullish, no doubt. However, on the daily timeframe, we’ve observed a clear bearish move, indicating potential short-term weakness.
Key Resistance Levels to Watch:
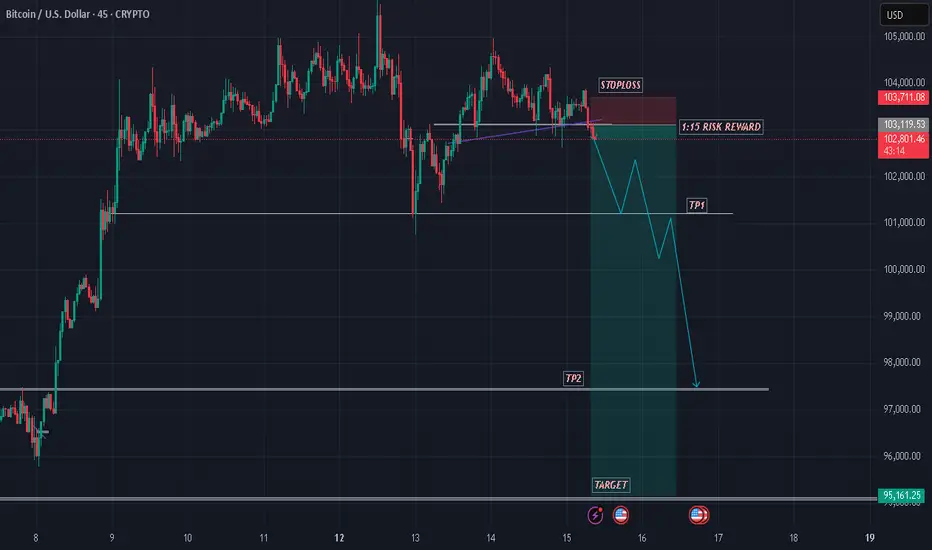
First Resistance: 102,851
Second Resistance: 103,665
Both of these levels could act as potential zones for a sell-off, especially if BTC shows signs of exhaustion near these zones. If price reacts bearishly here, we could see a corrective move towards the 96,466 level, which serves as a reasonable downside target.
Important Scenario to Monitor:
If the market attempts a liquidity hunt above the second resistance at 103,665, the situation could get tricky. While this might look like a breakout, it may not sustain bearish momentum beyond that level — indicating market indecision or a possible trap.
⚠️ Final Note for Retail Traders:
BTC is currently creating confusion, and retail traders should exercise extra caution. The market might visually appear to be setting up for a sell, but could quickly reverse, shaking out early entries. Avoid trading emotionally and wait for clear confirmation before entering positions.
BTCUSD SHOWING A GOOD UP MOVE WITH 1:10 RISK REWARD BTCUSD SHOWING A GOOD
UP MOVE WITH 1:10 RISK REWARD
DUE TO THESE REASON
A. its following a rectangle pattern that stocked the market
which preventing the market to move any one direction now it trying to break the strong resistant lable
B. after the break of this rectangle it will boost the market potential for break
C. also its resisting from a strong neckline the neckline also got weeker ald the price is ready to break in the outer region
all of these reason are indicating the same thing its ready for breakout BREAKOUT trading are follws good risk reward
please dont use more than one percentage of your capitalfollow risk reward and tradeing rules
that will help you to to become a bettertrader
thank you
BTC/USD 1H – Bullish Breakout with FVG Entry & $91K TargetChart Breakdown:
📈 Trend Structure:
BTC is moving in an ascending channel with:
🔵 Resistance Line on top
🟢 Support Line below
🔁 Recently, it broke out above the resistance with a bullish move!
Key Zones & Levels:
🟦 Fair Value Gap (FVG)
This is your potential buy zone:
✅ Entry Point: $86,135
❌ Stop Loss: $85,098
🎯 Target: $91,000
📌 Plan:
Wait for price to retrace into the FVG zone
Look for a bullish bounce ✅
Enter long at $86,135
Set your SL and target accordingly
Risk-Reward Setup:
Risk: Small (below FVG zone) ❗
Reward: Big upside toward $91,000 🚀
Gain Potential: +5.74% ($4,948 per BTC)
Visual Flow:
1️⃣ Price breaks resistance 🔼
2️⃣ Pullback expected to FVG 🔽
3️⃣ Entry triggers around $86,135
4️⃣ Targeting moon shot to $91K 🌕
Conclusion:
This setup shows a bullish continuation with solid RR.
If BTC holds the FVG on a retest, the move to $91K looks likely!

BTCUSD SHOWING A GOOD DOWN MOVE WITH 1:10 RISK REWARD BTCUSD SHOWING A GOOD DOWN MOVE WITH 1:10 RISK REWARD
DUE TO THESE REASON
A. its following a rectangle pattern that stocked the market
which preventing the market to move any one direction now it trying to break the strong resistant lable
B. after the break of this rectangle it will boost the market potential for break
C. also its resisting from a strong neckline the neckline also got weeker ald the price is ready to break in the outer region
all of these reason are indicating the same thing its ready for breakout BREAKOUT trading are follws good risk reward
please dont use more than one percentage of your capitalfollow risk reward and tradeing rules
that will help you to to become a bettertrader
thank you

BTC/USD) breakout up trand analysis Read The ChaptianMr SMC Trading point update
bullish analysis of Bitcoin (BTC/USD) on the 4-hour timeframe, showing a potential breakout and rally scenario. breakdown:
---
1. Market Structure:
Downtrend Channel: Price has been moving within a falling channel.
Double Bottom Pattern: Marked by two green arrows — a bullish reversal signal.
Breakout Attempt: Price is testing the upper trendline and 200 EMA (~$83,952), suggesting possible breakout.
---
2. Key Zones:
FVG (Fair Value Gap): Around $78,678 — a demand zone where price could retest before moving higher.
Breakout Confirmation Zone: ~$85,130 — breaking above this with volume signals strength.
Target Point: $95,206 — an upside target projecting ~31.77% gain from the breakout.
---
3. Indicators:
200 EMA: Currently acting as resistance. Break above it confirms bullish momentum.
RSI: Around 60 — pointing upward with bullish divergence from recent lows, showing increasing buying pressure.
---
4. Scenarios:
Scenario 1 (Bullish Continuation):
Breaks above trendline and 200 EMA.
Retest (optional) and then heads toward $95,206 target.
Scenario 2 (Retest First):
Price dips into the FVG/demand zone.
Finds support and launches upwards, confirming a strong base.
Mr SMC Trading point
---
Summary of the Idea:
This is a buy setup on breakout or on pullback:
Aggressive Entry: Break and close above $85,130.
Safe Entry: Pullback into $78,678 area (FVG).
Target: $95,206
Risk Zone: Below $78,000 (invalidates bullish structure).
Pales support boost 🚀 analysis follow)

BTC/USD) Bullish reversal analysis Read The ChaptianSMC Trading point update
This is a bullish reversal analysis on BTC/USD (Bitcoin to USD) on the 4-hour chart, suggesting a potential long opportunity after a sharp corrective move.
---
Key Breakdown of the Chart:
1. Strong Downward Move with Potential Reversal:
Bitcoin experienced a sharp drop from the 88k region to ~74,387.50, now hitting a key demand zone (marked as "Orderblock").
2. Bullish Reaction Expected:
From the Orderblock support zone, a bullish reversal is anticipated.
The projected move aims to fill the imbalance and test the target zone between 87,152.94 and 88,557.14.
3. RSI Oversold:
RSI is around 32.27, indicating oversold conditions and adding confluence for a potential bounce.
4. EMA (200):
The 200 EMA lies around 85,153.85, which may act as dynamic resistance on the way up.
Mr SMC Trading point
5. Price Target:
The expected upside move is approximately +13,722.85 points (+18.75%), aiming for the supply zone above 87k.
---
Conclusion / Trade Idea:
Entry Zone: Near 74,387.50, the orderblock/demand area.
Target Zone: 87,152.94 – 88,557.14
Bias: Bullish short- to mid-term reversal.
Confluences: Oversold RSI, clean support zone, potential trendline bounce, and price inefficiency above.
---
Pales support boost 🚀 analysis follow)

BITCOIN MAY DROP TO 74K - BEARISH STRUCTURE INTACTSymbol - BTCUSD
CMP - 84600
BTCUSD is undergoing a shift in market structure, transitioning into a bearish phase following the breakdown at 90K. A deeper correction is currently developing, which, in my view, represents a logical and technically sound progression for a healthy market. It is concerning when the market only experiences upward movement driven solely by buying pressure, such as in the case of large-scale injections of funds into high-yield investment programs (HYIPs).
A correction in Bitcoin’s price or even a trend reversal could inject vitality back into the market. From a fundamental perspective, traders have not seen the expected active support for cryptocurrencies from the US, which was previously suggested during Trump's election campaign. Additionally, issues such as crypto exchange hacks, fraudulent coins, and Bitcoin's dominance are exerting negative pressure on altcoins.
Bitcoin’s current downturn, with the possibility of a further drop to the 75K-73K range, could present an opportunity for fundamentally strong altcoins, assuming the declining Bitcoin dominance index also continues to trend downward. The simultaneous reallocation of funds from Bitcoin to altcoins, along with a rebound in Bitcoin from a strong support level, could rejuvenate the prospects for an altcoin season.
Resistance levels: 88150, 90700
Support levels: 75000, 73570, 66830
A modest retracement towards the 88100 to 90700 range is possible before the price begins its descent. While Bitcoin may attempt a deeper pullback, the current market imbalance, coupled with the absence of a clear driving force or supportive factors, suggests that the price may continue to fall in the medium term, potentially reaching the liquidity zone between 75K and 73K

Bullish Reversal Trade Setup for BTC/USD – 4H Chart AnalysisZone: Around 76,094 USD
This zone aligns with a demand/support area, highlighted by the purple rectangle.
Price has sharply dropped into this zone, suggesting a potential reversal or bounce opportunity.
⛔ Stop Loss
Level: Around 73,312 USD
Placed below the support zone to allow some volatility wiggle room.
A break below this could invalidate the bullish setup.
🎯 Target Point (Take Profit)
Level: 87,271 USD
Risk-to-reward ratio is approximately 1:3+, offering solid trade potential.
This level corresponds to a previously established resistance zone or supply area.
📊 Indicators
EMA 50 (red): ~82,106 USD
EMA 200 (blue): ~85,250 USD
Current price is below both EMAs, suggesting short-term bearish momentum, but this setup banks on a mean reversion or swing back up.
📈 Trade Idea Summary
Parameter Value
Entry 76,094 USD
Stop Loss 73,312 USD
Take Profit 87,271 USD
Risk/Reward ~1:3
Setup Type Bullish Reversal
🧠 Extra Notes
Wait for confirmation (candle reversal pattern) in the demand zone before entering.
Be cautious of fake-outs or breakdowns below support, especially with broader market weakness.

BTCUSD SHOWING A GOOD DOWN MOVE WITH 1:10 RISK REWARD BTCUSD SHOWING A GOOD DOWN MOVE WITH 1:5 RISK REWARD
DUE TO THESE REASON
A. its following a rectangle pattern that stocked the market
which preventing the market to move any one direction now it trying to break the strong resistant lable
B. after the break of this rectangle it will boost the market potential for break
C. also its resisting from a strong neckline the neckline also got weeker ald the price is ready to break in the outer region
all of these reason are indicating the same thing its ready for breakout BREAKOUT trading are follws good risk reward
please dont use more than one percentage of your capitalfollow risk reward and tradeing rules
that will help you to to become a bettertrader
thank you

Bitcoin (BTC/USD) Short Trade Setup: Resistance Rejection & TargThis chart is a Bitcoin (BTC/USD) 15-minute price chart from TradingView, showing a potential short trade setup based on technical analysis. Here’s a breakdown of the key elements:
1. Resistance Zone & Short Setup
The purple highlighted area represents a resistance level around $85,358.
Price is consolidating within this resistance zone, suggesting a potential reversal.
The expected scenario involves a price rejection from this resistance, leading to a downward move.
2. Moving Averages
EMA (200, blue line) at $83,433: A long-term trend indicator suggesting a strong support zone.
EMA (30, red line) at $84,657: A short-term trend indicator, currently above the price, indicating a potential bearish setup if the price moves below it.
3. Target & Stop-Loss Le

BTCUSD STRONG ABOVE 81776 TARGET 440 POINTSBTCUSD STRONG ZONE ABOVE ONLY 81776... there is no resistance upto 82215
wait for active
buy above 81776
stoploss 81530
Target1.......81950...
Target2.......82215....440 points
Disclaimer - This level only for education purpose only

BTCUSD 1000 POINTS CHANCE UP STRONG ABOVE 83640 TO 84640BTCUSD strong above only 83640
current mkt price 84110
waiting for active
Buy above 83640
Stoploss 83175...465 points
Target 84640.....1000 points
Disclaimer - This level only for education purpose and paper trade . Do ur own analysis
