DLF for 46% upsideif Weekly candle close above 826Rs level then only take entry
Target 1220
Duration 1.5 year( its maximum duration )
After entry at 759 Rs level invest same amount again.
No need any stop loss.
it will be ready to fly ..just wait for weekly closing above 826
Bulishtrend

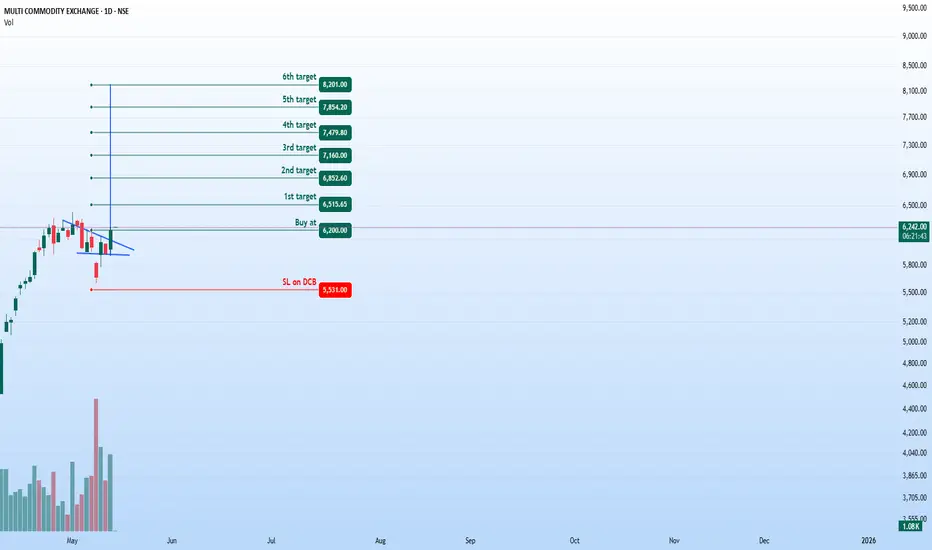
MCX - Bullish Breakout Opportunity (Daily Timeframe)Stock: MCX ( NSE:MCX )
Trend: Bullish Momentum Building 🚀
Risk-Reward Ratio: 1:3 (Favorable Setup)
Trade Parameters
🎯 Entry Zone: ₹6,200 (Breakout Confirmation)
🛑 Stop Loss: ₹5,531 (Daily Closing Basis) (~10.8% Risk)
🎯 Target Levels:
₹6,515.65
₹6,852.60
₹7,160.00
₹7,479.80
₹7,854.20
₹8,200 (Final Target)
Technical Rationale
✅ Bullish Flag Breakout - Price has broken out from consolidation pattern
✅ Strong Momentum - Daily & Weekly RSI >60 (Bullish territory)
✅ Volume Confirmation - Breakout volume 868K vs previous day's 571K (~52% increase)
✅ Technical Structure - Higher highs and higher lows formation
Key Observations
• The breakout comes with significantly higher volume
• Multiple targets allow for progressive profit booking
• Attractive 1:3 risk-reward ratio
• Strong technical structure supporting bullish case
Trade Management Strategy
• Consider partial profit booking at each target level
• Move stop loss to breakeven after Target 1 is achieved
• Trail stop loss to protect profits as price progresses
• Watch for volume confirmation on upside moves
Disclaimer ⚠️
This analysis is strictly for educational purposes and should not be construed as investment advice. Trading in financial markets involves substantial risk and is not suitable for all investors. Past performance is not indicative of future results. Always conduct your own thorough research and consult with a qualified financial advisor before making any investment decisions. The author assumes no responsibility for any trading losses that may occur from using this information.
What do you think? Are you watching this breakout on NSE:MCX ? Share your views in the comments!
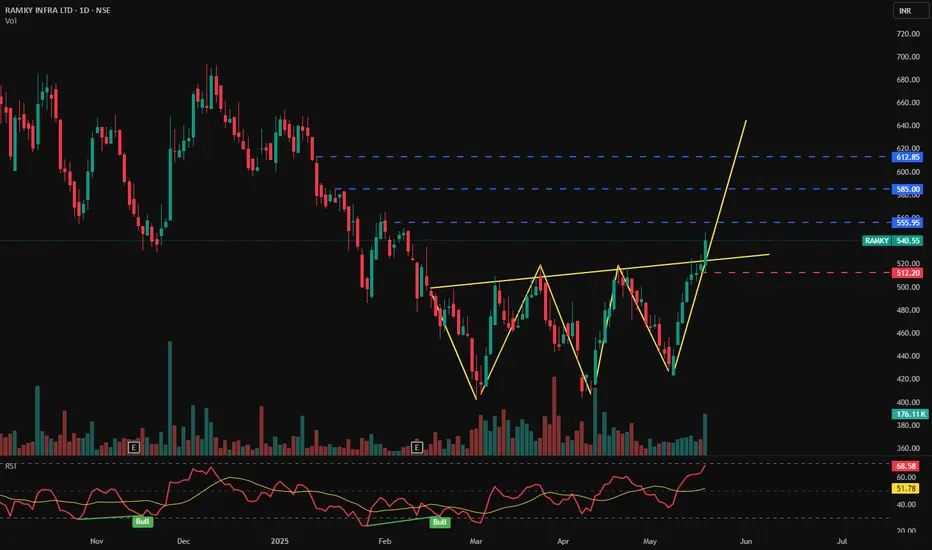
RAMKY INFRA LTD - Bullish Pattern📊 RAMKY INFRA LTD (1D) – CMP ₹540.55
📅 Date: May 21, 2025
📈 Exchange: NSE
📌 Ticker: RAMKY
🧠 Technical Analysis Overview
✅ Bullish Inverse Head & Shoulders Pattern:
Price has broken out of a clearly formed inverse head and shoulders pattern — a powerful trend reversal structure — indicating a strong bullish sentiment and possible long-term uptrend.
✅ Breakout Confirmation:
A sharp breakout above the neckline near ₹512 has occurred with strong bullish momentum and increased volume.
✅ RSI Indicator – 📈
RSI is at 68.58, approaching overbought levels but not showing divergence yet, confirming continued bullish strength. The RSI trend also shows recent bullish crossovers.
📍 Key Price Levels
📌 Support
🟥 ₹512.20 – Neckline retest level (ideal re-entry zone)
📌 Resistance (Targets)
🔵 ₹555.95 – Immediate target
🔵 ₹585.00 – Mid-term resistance
🔵 ₹612.85 – Major resistance / final target from pattern projection
💬 Potential Strategy
Breakout Entry already active above neckline
Pullback Entry possible near ₹512–₹520
SL below ₹512
Target 1: ₹555
Target 2: ₹585
Target 3: ₹612+
📌 Conclusion
RAMKY INFRA is breaking out of a strong inverse head and shoulders pattern with bullish volume and RSI confirmation. Watch for a potential retest near ₹512 for a high-probability entry. Targets lie ahead at ₹555, ₹585, and ₹612.
🛑 Disclaimer:
This analysis is for educational purposes only. Not investment advice. Always DYOR or consult your financial advisor.
Good Entry level 105-110 Focus on long term Results are good
T1- 120
T2-140
T3-190
Short term view with in 1month range
WAITING TO BREAK 190 level

Crude oil Range bond (6900-7500) ****************************************************************************************************
****************************************************************************************************
* All the information shared in this chart is provided for strictly educational purposes only.
* This chart is sharing information are based on the theory of technical analysis .
* This is not an offer to buy or sell stocks, futures , options, commodity, forex, interests or any other trading security.
* Back test yourself before jump into live market consult your financial adviser and use proper risk management.
******************************************************************************************************
******************************************************************************************************
Crude oil bullish till 7500 (rangebound 6900-7500) my buying price around 6850-7000-7100
Stop loss will be buy at hammer at support with Stop loss of same candle
I will kept my order selling order around 7500 -7550-7600 same stop loss will be inverted hammer candle or any bearish candle.
____________________________________________________________
Visit Us for more details and follow us for more Education Analysis
____________________________________________________________
Trading_Cafe24
Thank you :)

intraday, swing, short term; min 70% returnstrendline break and retracement also completed
it is good sign for further up move
keep stoploss
.
.
food sector is always good for investment, during week global markets
smallcap stocks are going to boom.
long term investment; min 70% return
huge potential is there.
investment ;
if you are intrested in investmet, go for it with small risk,
more possibility is there for breakout.
.
.
.
. more than that " megastar food "is fundamentally good
.
.
.refer our old idea attached below

Short term Bullish trend- KotakbankKotakbank is now trading inside channel, for short term there is more possibility for bulllishish.
Entry after closing above 1700: maintain stoploss at range below 1600
Aftert breaking channel bullish trend will starts. Do your analysis before taking entry.

LARSEN & TUBRO - CHANNEL BREAKOUTLARSEN & TUBRO Channel breakout happened in daily chart. If price sustain above 1663, Refer mentioned upcoming Targets.

Bullish Trend Changing TimeIts time to pull up all.
After long bearish week now it has changed Down trend to Up Trend so its time to do Long now..
its all about where we take entry make profit and just get out from it... (y)
Have a good luck to all.

NR Agarwal strong BreaoutBUY NR AGARWAL with target 360, Stop loss 270. The breakout did @289 level. Price crossed 200 WMA

LAURUS IS READY FOR UPMOVELaurus lab is trading all moving average 10,20,30,50,100,200. Rsi-62 which shows strength.
Traders and investors may buy above 599. with SL-572 & Terget -645-710.
Happy investing.

VEDL Chart Analysis | Stock breakout VEDL Chart Analysis | Stock breakout , Good Stock to buy , Breakout and retest done .
For More Update Search in Google - Manoj Shinde 27485

BOMDYEING - BOMBAY DYEING Triangle Breakout expectedDetails provided in Chart.
Consider hitting like and follow if you find it useful.

TCS ViewTCS has given a bullish candle with above average volume.
Breaking the inclined trend line will give good bullish targets

Possible Bullish stockGrasim in 1 hr TF made rounded bottom, NSE:GRASIM current level will work as support for few days. Good for swing trade if it holds 1413 level.

