Gold Rejected at Highs as Bearish Harmonic Triggers🟡 Gold OANDA:XAUUSD Rejected at Highs as Bearish Harmonic Triggers 📉
Gold (Daily) has entered a major supply zone and witnessed a sharp rejection. A bearish harmonic pattern has completed near the highs, followed by aggressive selling pressure. Momentum is turning down and volatility is expanding — classic signals of a near-term top.
👉 Risk now favours a pullback or consolidation rather than fresh long positions at current levels
🟡 Gold (XAUUSD) – Medium-Term View
Gold has completed a bearish harmonic structure and faced strong rejection near 4550–4560, a key supply area. The sharp decline from highs reflects rally exhaustion and indicates a shift toward consolidation or correction.
➡️ As long as prices remain below 4560, upside is likely to stay capped.
🔑 Key Levels to Watch
Resistance: 4420 → 4550
Support: 4250 → 4000
🔮 Medium-Term Outlook
Base Case: Range-bound to corrective move between 4250–4550
Bearish Risk: A breakdown below 4245 opens downside toward 4100–4000
Bullish Scenario: Fresh upside only on a sustained breakout above 4560
🧠 Final Takeaway
Gold requires fresh macro triggers or sustained dollar weakness to resume its uptrend. Until then, expect time correction, higher volatility, and selective trading opportunities — not a one-way rally.
Bullion

GOLDHello & welcome to this analysis
GOLD after a super duper move from AUG - OCT followed by a sharp decline now appears to be consolidating within a triangle.
Currently appears to be in leg D which should be followed by leg E to complete the contracting triangle squeeze and from thereon the resumption of uptrend.
For those new to patterns - triangles are time wise correction that see less price retracement within a longer duration of time. The current triangle appears to be a contracting one.
Leg D could end near 4175 / 125750 approx while leg E could end near 4050 / 122250 approx.
The view would be incorrect if either the current up move goes above 4245 / 127950 without a pullback or the expected retracement goes below 4000 / 121000.
The interesting part here is that GOLD prior to its rally from 3250 was also within a triangle for 4 months. What followed was a parabolic move from a squeeze. Lets see if this one will also give such a move or not.
All the best

GOLDHello & welcome to this analysis
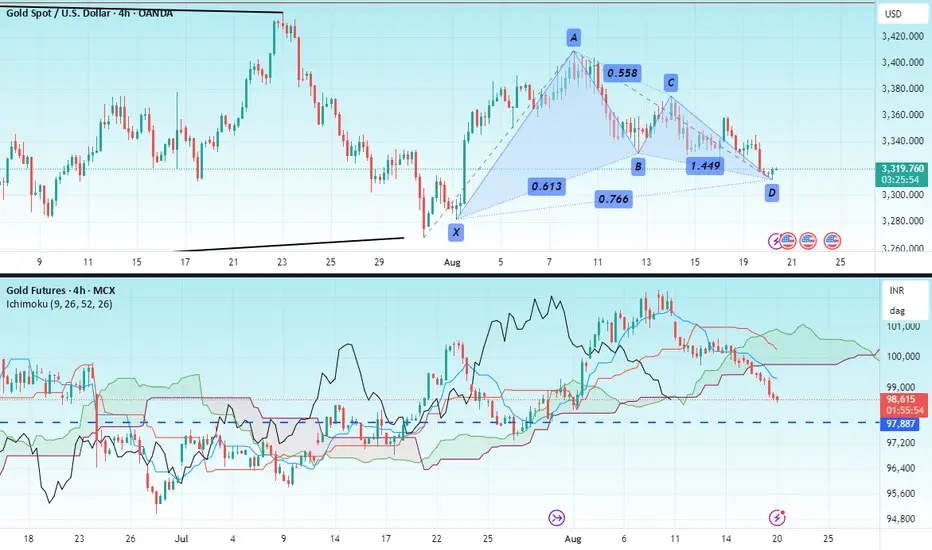
Gold at COMEX has formed a bullish Harmonic Gartley pattern in 4hr time frame suggesting a reversal in trend.
As long as it sustains above $3295 it could give a bounce/rally till $ 3345 - 3370 - 3400 - 3450.
Gold at MCX appears to be ending its pullback but due to INR $ fluctuations a bullish Harmonic pattern has not formed. One could look for bullish trades as long as its above 97900 for upside levels of 99400 - 100000 - 101000 - 102500. Keep in mind levels could alter due to forex changes
Overall GOLD is strong and has an upside triangle breakout target of $3700 open as long as it is above $3250 (refer to my earlier view published on Gold in the link)
All the best
GOLDHello & welcome to this analysis
Comex GOLD appears to have completed its triangle and is now likely to give a breakout above 3439 for an upside target of 3750.
The triangle goes invalid if we witness a sell off from current levels and it breaks 3250 on the downside.
MCX Gold appears to have a Cup & Handle formation (similar to a triangle) and is now likely to confirm a breakout above 101075 for upside targets of 103750 - 106200 (will depend a lot on $:INR).
The Cup and Handle pattern goes invalid if we witness a sell off from current levels and breaks 99250 on the downside.
Overall use dips to add/trail, shorting (intra day would be a different scenario) overnight from here looks like a very risky trade.
All the best

GOLDHello & welcome to this analysis
In 4hrs time frame GOLD (MCX) has activated a bearish Harmonic Bat pattern.
It could retrace down to 99500 - 98500, will consider 100750 as stop loss for this set up.
Do keep in mind, GOLD overall is very strong and this could likely be a shallow retracement.
Regards

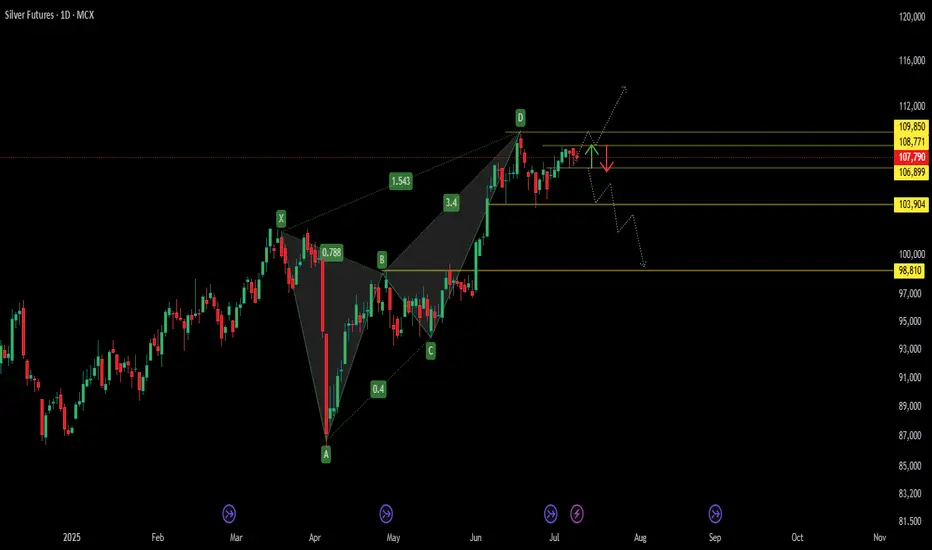
Bearish Harmonic in Play – Silver Sell Zone TriggeredBearish Harmonic in Play – MCX:SILVER1! Sell Zone Triggered 🔔
The pattern marked from X → A → B → C → D forms a Bearish Harmonic Structure , most likely a Bearish Butterfly , confirmed by key Fibonacci ratios:
* XA to AB retracement: 78.8%
* BC to CD extension: 1.543
This setup signals the formation of a Potential Reversal Zone (PRZ) near point D , where a bearish trend may initiate.
📉 Bearish Price Outlook
The dotted projection lines and red arrow illustrate the anticipated downward move:
* Price is likely to face resistance and reverse from the PRZ between ₹108,771 and ₹109,850
* A break below ₹106,899 could trigger further decline toward key support levels at ₹103,904 and ₹98,810
GOLDHello & welcome to this analysis
GOLD is giving a hourly H&S breakdown suggesting targets of $3134 (Comex) / 91000 (MCX) with a pause near $3190 / 92750

GOLDHello & welcome to this analysis
A bearish Harmonic Deep Crab formation took place in the 60m time frame, after an initial dip which formed bullish hidden RSI divergence in 60m time frame the pullback has now formed a bearish Harmonic Gartley in 15m time frame.
Sustaining below 88000 opens for 87500 and 86500.
Good risk reward set up for a bearish trade.
All the best

GOLDHello & welcome to this analysis
Will Gold continue to surge ahead or is it set for a pullback now.
In this video I have covered the levels for Gold Comex as well as Gold MCX & Gold ETF
All the best

GOLD Retracement faling can continueHello everyone,
MCX GOLD After registering lifetime high of 79775 fallen by more than 5% now trading at 75200 daily 200EMA still 5000 points away and if going to make 61% retracement then another 4000-6000 points fall can expect with supported volume for selling its overall bearish view.

Gold buyers take a breather above 100-SMA, focus on $2,450Gold's recent strong performance suggests a positive sentiment among buyers, especially with its breakout above the 100-SMA and supportive RSI and MACD indicators. This technical strength points to a potential push towards the $2,450 resistance level, with further challenges anticipated at around $2,470 from a mid-July trend line, and additional resistance at $2,495 and $2,500.
On the downside, sellers will need a break below the 100-SMA, currently around $2,411, to gain momentum. Such a move could test the $2,400 mark, with further support levels at $2,383 and $2,350.
In summary, while Gold is currently on the buyers' radar, the upcoming resistance levels may cap the upside potential.

XAUUSD - SMALL RISK FOR HUGE REWARD ?XAUUSD currently trading at 2292
Shorting XAUUSD at CMP with 2320 SL.
Target would be 2230 - 2200 - 2180
Expecting a fall soon!
Disclaimer - Do not consider this as a buy/sell recommendation. I'm sharing my analysis & my trading position. You can track it for educational purposes. Thanks!

Gold price recovery remains elusive below $1,880Gold recovers from a seven-month-old amid an oversold RSI (14) and failure to break the weekly horizontal support surrounding $1,815. However, the 21-SMA upside hurdle surrounding $1,830 and the one-week-long descending resistance line of around $1,840 restrict the short-term upside of the Gold price. It’s worth noting that the XAUUSD remains on the bear’s radar unless it breaks a downward-sloping support-turned-resistance line from late June, close to $1,880 by the press time. Following that, a quick run-up to the $1,900 round figure can’t be ruled out.
Meanwhile, a downside break of the weekly support of around $1,815 will have to confront a slew of technical supports and oversold RSI (14) before allowing the Gold bears to visit the $1,800 round figure. Should the XAUUSD remain bearish past $1,800, a one-week-old descending support line of near $1,782 and the late November 2022 low of around $1,730 will be in the spotlight.
Overall, Gold bears take a breather after the previous day’s disappointing US data, as well as consolidate the latest losses ahead of Friday’s key US jobs report. However, the XAUUSD is not out of the woods yet, at least below $1,880. Hence, the latest bounce can be considered as a selling opportunity.

Gold price consolidates within symmetrical triangle above $1,900Gold price bounces off a one-week-old rising support line, as well as the 200-SMA, within a symmetrical triangle comprising levels marked since late July. Given the near-50.0 levels of the RSI and the impending bull cross on the MACD, the XAUUSD is likely to extend the latest rebound. The same highlights the 50% Fibonacci retracement of its July-August downside, near $1,937, ahead of shifting the market’s attention to the stated triangle’s top line, close to $1,947 at the latest. In a case where the bullion price remains firmer past $1,947, the monthly high of around $1,953 will act as the final defense of the bears.
On the flip side, the 200-SMA and an ascending support line from the previous week limit the immediate downside of the Gold price near $1,918 and $1,916 respectively. Following that, the triangle’s lower line surrounding $1,906 and the $1,900 will be crucial to watch for the XAUUSD bears. In a case where the metal remains bearish past $1,900, the odds of witnessing a slump toward July’s low of $1,885 can’t be ruled out.
Overall, the Gold Price is likely to remain sidelined within the aforementioned triangle but advocates more volatility ahead.

Gold has limited downside room unless it breaks $1,900Gold price appears well set to print the first weekly loss in three as it defends the previous Friday’s U-turn from a key resistance line below the important Exponential Moving Averages (EMAs). However, the 50-EMA pierces the 200-EMA from below and prints a “Golden Cross” bullish moving average crossover suggesting a corrective bounce in prices. Additionally, the RSI (14) also rebounds from the oversold territory and hence increases the odds of witnessing a corrective bounce towards the EMA convergence surrounding $1,930. Following that, the 50% Fibonacci retracement of the July-August downturn, near $1,937, may please the XAUUSD buyers before testing them with a seven-week-old descending resistance line surrounding $1,950. Adding strength to the stated trend line resistance is the 61.8% Fibonacci retracement, also known as the “Golden Fibonacci Ratio”.
Meanwhile, the Gold buyer’s failure to defend Thursday’s corrective bounce needs to break $1,915 support to recall the sellers. Even so, a horizontal area comprising multiple levels marked since late June, close to $1,900, appears a tough nut to crack for the XAUUSD bears afterward. It should be observed, though, that a clear downside break of $1,900 won’t hesitate to challenge the previous monthly low of around $1,884 while targeting the early March swing high of around $1,858 and then to the yearly bottom of $1,804, quickly followed by the $1,800 round figure.
To sum up, the Gold price remains on the bear’s radar despite the latest recovery.

Gold buyers seek re-entry but road towards north is long and bumGold braces for the first weekly gain in five while bouncing off the multi-month low marked earlier in the week, piercing the 200-DMA of late. The upside bias gains credence from a looming bull-cross on the MACD, as well as a recovery in the RSI (14) line from the oversold territory. However, a nine-month-old previous support line, close to $1,950, precedes a downward-sloping resistance line from early May, around $1,955 at the latest, to restrict the short-term upside of the XAUUSD. Also acting as a barrier towards the north is a three-month-old horizontal resistance area surrounding the $1,985 and the $2,000 psychological magnet. In a case where the metal remains firmer past $2,000, the yearly high of around $2,067 will be in the spotlight.
On the flip side, the recent low of around $1,885 holds the key to the Gold seller’s entry. Following that, the early-March swing high of near $1,858 and the YTD bottom around $1,804, quickly followed by the $1,800 threshold, will challenge the XAUUSD bears. Should there be a sustained downtrend of the bullion past $1,800, the November 2022 peak of around $1,767 will act as the final defense of the buyers.
Overall, the Gold Price is likely to recover but the reversal of the multi-day-old bearish trend is still unclear to predict.

Gold stays bearish despite corrective bouncesGold braces for the fourth weekly losses even as a one-month-old falling support line defends intraday buyers. That said, the recovery appears elusive unless crossing the 200-SMA level of around $1,940. Even so, multiple tops marked since late May, surrounding $1,985, constitute a strong resistance for the bulls to cross before taking control. Following that, a run-up toward crossing the $2,000 round figure will be a cakewalk for the XAUUSD buyers while $2,050 and May’s peak of around $2,066 could gain the market’s attention afterward.
On the flip side, the aforementioned support line, around $1,887 by the press time, could keep poking the Gold sellers. However, a break of which could quickly drag the XAUUSD to the 61.8% Fibonacci Extension (FE) of the metal’s May-July moves, near $1,863. It’s worth noting that the bullion’s weakness past $1,863 will make it vulnerable to testing the yearly low of around $1,804, quickly followed by the $1,800 threshold.
Overall, Gold sellers keep the reins unless the prices remain below $1,985 but the downside room appears limited, which in turn suggests intermediate bounces in the price.

Gold sellers need to break $1,925 support for further downsideGold Price fades bounce off an upward-sloping support line from late February by retreating from the 50-DMA hurdle, around $1,945 by the press time. Adding strength to the downside bias are the bearish MACD signals and a downward-sloping RSI (14), not oversold. With this, the XAUUSD is likely to break the stated support line, around $1,925 by the press time. Following that, a quick fall toward the $1,900 round figure can’t be ruled out. However, a six-month-long horizontal support zone around $1,890 and the 78.6% Fibonacci retracement of February-May upside, near $1,860 may test the metal’s further downside before challenging the yearly low marked in March around $1,804.
On the contrary, a daily closing beyond the 50-DMA hurdle of around $1,945 may allow the Gold buyers to aim for the 38.2% Fibonacci retracement level of around $1,967. However, an area comprising multiple levels marked since May 19, close to $1,985, will challenge the XAUUSD bulls afterward. In a case where the bullion price rally crosses the $1,985 resistance, the $2,000 round figure may give a final fight to the optimists before giving them control.
Overall, the Gold Price remains on the back foot but a clear downside break of $1,925 becomes necessary for the bears to take control.

Gold and Silver forming bullish patterns Gold and Silver have both rallied strongly last week, they are now above the key resistance levels. Silver especially looks much better placed to rally compared to Gold. With the supports close by now there is a good chance that we see a good rally in the bullion.

Gold buyers appear well-set to visit $1,985 hurdleGold price rises to the highest level in a month after crossing a convergence of the 200-SMA and a six-week-old descending trend line, around $1,940 by the press time. The breakout joins bullish MACD signals to keep XAUUSD buyers hopeful. However, the overbought RSI (14) conditions suggest limited upside room, which in turn highlights a horizontal resistance area comprising multiple tops marked since May 18, close to $1,985. It’s worth noting that the metal’s upside past $1,985 appears difficult as the $2,000 psychological magnet and the 61.8% Fibonacci retracement of May-June downside, near $2,030, could challenge the bulls before directing them to the yearly top marked in May around $2,067.
On the contrary, Gold price pullback remains elusive unless the quote stays beyond the $1,940 resistance-turned-support comprising the 200-SMA and a 1.5-month-long falling trend line. Following that, the early-month swing high of around $1,934 and the previous resistance line stretched from May 04, close to 1,916, at the latest, will challenge the XAUUSD sellers. In a case where the bullion bears keep the reins past $1,916, the $1,900 will act as the last defense of the bulls.
Overall, Gold Price is likely to rise further towards the short-term key resistance as the US Dollar drops heavily.

SILVER- Inverted Head and Shoulders Breakout BUY!Attached: XAGUSD Daily Chart as of 17th March 2023
Price closed up 4.20% on Friday with a Bullish Marubozu Candle
At the same time also triggering a Bullish Inverted Head & Shoulder Pattern Breakout
Action Plan as follows:
Buy triggered with Friday's Closing✅
Stop Loss⚠️ below 21.25
Upside Target🎯= 25 + (which is also the measured move of the IHNS Pattern)
Silver has to catch up📈 with Gold as the Precious Metals Bull Run unfolds amidst a Banking Crisis, High Inflation and Rising Interest Rates

SILVER- Relative Strength says Buy!XAGUSD
Another Bullish Signal for Silver🥈
Attached: XAGUSD/ Nifty 50 Weekly Chart as of 31st March 2023
- This Relative Strength Chart indicates that the Outperformance of Silver over Equity (Nifty 50) has started 📈
-It is similar to the Signal on Gold🥇 that I had shared on New Year's Day and you can see how fabulously well that Gold Buy Signal played out for us ‼️
- Expect the same for Silver as I have been saying that Silver has to catch up with Gold
So if Not Already in Silver,
Get In As Soon As Possible or you will miss the Move 🚀!
Note:
In my previous post on Silver, I highlighted an Inverted Head & Shoulder Breakout BUY SIGNAL
Since that post, Silver is up 6.60% and counting....

