$PUMP MACRO SETUP | 1,000%+ UPSIDE IF HTF BASE HOLDSNYSE:PUMP MACRO SETUP | 1,000%+ UPSIDE IF HTF BASE HOLDS
#PUMP Is Trading Inside A HTF Accumulation Zone After Completing A Long-Term Descending Wedge, Signaling A Potential Macro Trend Reversal.
Technical Structure:
✅ Multi-Month Descending Wedge Breakout Confirmed
✅ Clean Breakout + Retest Of HTF Neckline
✅ Inverse H&S Pattern NeckLine Very Close to Breakout
✅ Strong Demand Holding Inside $0.0025 – $0.0022
✅ Structure Invalidate Below $0.00168 (HTF Close)
✅ Sustained Acceptance Above Accumulation Signals Continuation
CryptoPatel Expansion Targets: $0.00504 → $0.00867 → $0.01500 → $0.02297+
High R:R Setup If HTF Demand Holds And Expansion From The Base Continues.
❌ Invalidation: HTF Close Below $0.00168 Opens Downside Risk And Invalidates The Reversal Structure.
TA Only. Not Financial Advice. ALWAYS DYOR.
Bullish Patterns

$RIVER Turned $1K Into $52K In 41 Days But Here’s Why I’m Not BuCRYPTOCAP:RIVER Turned $1K Into $52K In 41 Days But Here’s Why I’m Not Buying
CRYPTOCAP:RIVER Pumped 5,221% In 41 Days. From $1.616 (Dec 17) → $86 (Yesterday)
What Caused This Pump?
🔹 Arthur Hayes + Justin Sun ($8M) Backed It
🔹 $12M Funding Round With Big Investors
🔹 Sui Network Partnership
🔹 Listed On Binance, OKX, Bybit, Coinone
🔹 Only 20% Tokens In Circulation
🔹 One Whale Bought 50% Supply At $4
⚠️ My Warning:
👉 Don’t Try To Catch This Knife Now
👉 Strong Support Is At $8–$12 - High Chance Price Revisits $10–$15
👉 Fresh Longs At ATH = Very Risky
Key Risks:
🔴 Whale Controls 50% Supply: Dump Risk Anytime
🔴 Pump Driven By Leverage, Not Organic Demand
🔴 80% Tokens Still Locked
Conclusion:
Wait For A Proper Pullback
Don’t Become Exit Liquidity
DYOR
My Take:
Good Project, Very Risky Price Right Now
Wait For Cooldown Or Proper Structure
FOMO Is Not A Strategy

UPDATE on previous EURUSD BULLISH IDEA!The price has claimed the highs which was a major level I marked and presented at :- 1.19206.
The TRADE IDEA is COMPLETE!
Congratulations to whoever took this.

NASDAQ bullish bias on HTF and ITFThe price is currently reacting to THE DAILY FAIR VALUE GAP , which is a good confluence for bullish and long clarity, as the dollar continues to freefall , we can consider the relative strength between the index and the currency to support our long idea.
The closest target would be the recents 4 hour highs.
Wait until 9:30 openin for any manipulation to frame our trade.
Invalidation :- closing below the (dfvg)

$SAND MACRO SETUP | 7,800%+ CYCLE EXPANSION IF HTF DEMAND HOLDSCSE:SAND Is Trading At A Major HTF Accumulation Zone After A ~99% Decline From ATH, Forming A Long-Term Base Inside A Multi-Year Descending Channel.
Technical Structure:
• Strong Demand Holding At $0.14 – $0.11
• Price Reacting From HTF Trendline Support
• Structure Remains Valid Above $0.10 (HTF Close)
• Break Above $0.22 – $0.26 Required For Bullish Continuation
Expansion Targets (HTF): $0.65 → $1.50 → $3.50 → $8.48+ (ATH Zone)
This Remains A High R:R Macro Setup If HTF Demand Holds And Price Breaks The Descending Channel.
Invalidation:
HTF Close Below $0.10 Opens Downside Toward $0.05 – $0.035, The Last Major Bullish Order Block.
TA Only. Not Financial Advice. DYOR.

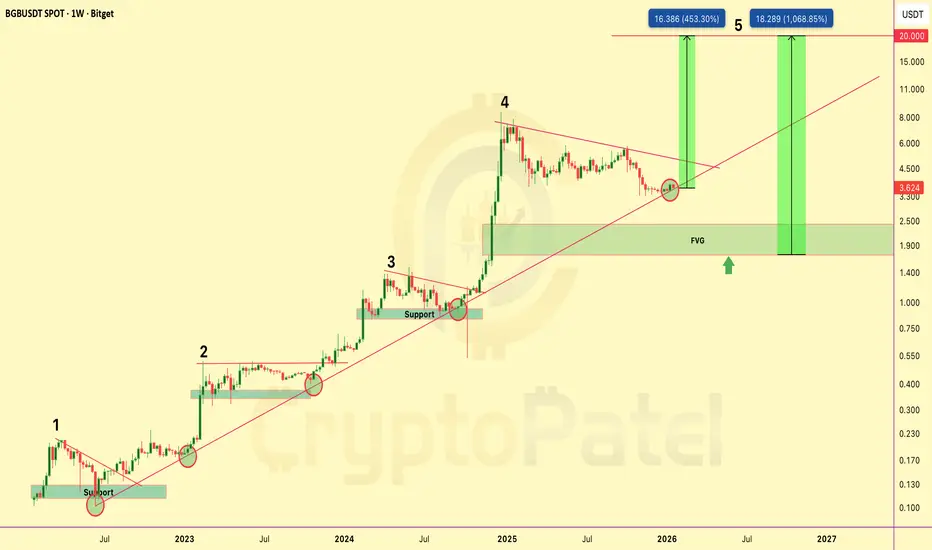
$BGB PRICE PREDICTION | 450%–1000% POTENTIALBGB is trading inside a well-defined long-term rising channel on the weekly timeframe, respecting bullish market structure since 2022.
Price has completed a full accumulation → expansion cycle and is currently undergoing a healthy corrective phase before the next impulsive move.
Technical Structure
Long-term ascending trendline remains intact
Clear 5-wave Elliott structure on HTF
Wave 4 correction following a strong impulsive expansion
Price reacting from dynamic channel support
HTF Fair Value Gap (FVG): $2.40 – $1.70
Bullish structure maintained above $3.40
Upside Targets (Wave 5 Extension)
$10
$15
$20
Alternative Scenario
If price breaks below $3.40 and an HTF candle closes below this level, there is a high probability of a move toward the $2.00 support and HTF FVG zone, which would represent a strong long-term accumulation area rather than trend invalidation.
Bias & Invalidation
As long as BGB/USDT holds above the rising channel support, the macro bullish bias remains intact.
Invalidation: Weekly close below the rising channel.
Technical analysis only. Not financial advice. DYOR.
$ASTER PRICE PREDICTION | HTF ACCUMULATION | 2400% MACRO POTENT?SEED_WANDERIN_JIMZIP900:ASTER is currently trading inside a high-timeframe accumulation base after a prolonged downtrend.
Price compression near major demand suggests trend exhaustion and a potential volatility expansion ahead.
Market Structure Overview
✅ Prolonged downtrend → exhaustion phase
✅ HTF accumulation forming
✅ Descending trendline pressure building
✅ Volatility compression → expansion setup
SEED_WANDERIN_JIMZIP900:ASTER is already ~78% down from its September 2025 ATH, significantly improving risk–reward for long-term positioning.
Key Accumulation Zones
Zone 1: $0.70 – $0.60 ✅ (Filled – bounce expected)
Zone 2 (Macro flush scenario): $0.45 – $0.35
→ Strong long-term accumulation zone if broader market weakness persists
Upside Targets (CryptoPatel View)
$1.50 → $2.00 → $5.00 → $10.00 → $20.00
Macro extension: $20 – $30 (long-term, high-risk / high-reward)
Invalidation: Loss of HTF demand structure → High-risk hold
Market Talk
As per public disclosures circulating on 2 Nov 2025, CZ was reportedly exposed to SEED_WANDERIN_JIMZIP900:ASTER below ~$0.91, holding approximately 2.09M ASTER.
While not a signal, this adds sentiment confidence to the long-term accumulation narrative.
Long-Term Thesis
This phase appears to be early accumulation, not confirmation.
If HTF demand holds and structure flips bullish, $5–$10 becomes realistic, with $20+ as a full-cycle expansion scenario.
Disclaimer:
This is technical analysis & market discussion only — not financial advice.
Always manage risk and do your own research.

$DYDX PRICE OUTLOOK | 3000%+ POTENTIAL FROM MACRO SUPPORT?DYDX/USDT PRICE OUTLOOK | Macro Support & High R:R Setup
DYDX is currently trading at a major higher-timeframe demand zone on the 2-week chart, following an extreme ~99.45% drawdown from its all-time high. Historically, such deep retracements often precede long-term re-accumulation phases, especially when aligned with structural support.
Market Structure Overview
Price remains within a multi-year descending channel active since 2022. The current price action is testing the lower boundary of this channel, which aligns with a clearly defined horizontal accumulation zone ($0.15–$0.20). This creates a strong confluence-based support region.
Technical Confluence
Descending channel support respected on HTF
Strong historical demand at $0.15–$0.20
~99% retracement from ATH completed
Compression near support suggests potential volatility expansion
Bias remains bullish as long as HTF structure holds
Upside Levels (If Breakout Confirms)
Resistance 1: $0.84
Resistance 2: $2.19
Resistance 3: $4.39
ATH Supply Zone: $27.85
A confirmed HTF close above descending trendline resistance would validate a structural trend reversal. The measured move from this base projects toward $3.85, representing a potential ~3200% upside from current levels.
Invalidation
Any 2-week candle close below $0.15 invalidates the accumulation thesis and requires reassessment.
Conclusion
This setup reflects a classic falling-wedge / descending-channel structure meeting historical demand. While risk remains elevated, the risk-to-reward profile is asymmetric at this level. Patience, confirmation, and position sizing are essential.
Analysis Type: Technical Analysis
Timeframe: Long-Term / Positional
Bias: Accumulation → Trend Reversal (Conditional)
TA only. Not financial advice. Always manage risk.

$XRP PRICE PREDICTION | MULTI-YEAR BREAKOUT TOWARD $10+?CRYPTOCAP:XRP is trading above a confirmed multi-year breakout zone on the higher timeframe after completing a long accumulation phase.
Price has already delivered a strong expansion move and is now building structure for the next leg higher.
TECHNICAL OVERVIEW (HTF):
✔ Descending Wedge Breakout (2020–2024)
✔ 600%+ Expansion From $0.60 Breakout
✔ Fair Value Gap / Accumulation Zone: $1.30 – $1.90
✔ Higher-Timeframe Bullish Structure Intact
✔ Bullish Bias While Price Holds Above $1.30
TARGETS (CryptoPatel): $3.50 / $5.00 / $8.70 / $10+
INVALIDATION:
❌ HTF Close Below $1.30
Technical analysis only. Not financial advice. DYOR.

$PUMP PRICE OUTLOOK | 500%–1000% POTENTIAL? #PUMP Is Trading In A Bullish Expansion Zone After Breaking Long-Term Descending Resistance On The Daily Chart.
Price Has Completed A Prolonged Distribution → Correction Phase And Is Now Showing Early Reversal Signals.
Current Technical Structure:
✅ Long-Term Descending Trendline Break Confirmed
✅ Descending Wedge Breakout Structure
✅ Strong HTF Demand Zone Holding (0.0023–0.0021)
✅ Multiple Support Reclaims Indicate Accumulation
✅ Strength Signal: Bullish Above $0.0021
CryptoPatel Targets: $0.00449 / $0.00644 / $0.00872 / $0.015 / $0.026
As Long As PUMP/USDT Holds Above $0.0021, The Bullish Bias Remains Intact.
This Is A High-Risk, High-Reward Accumulation Setup With Asymmetric Upside Potential.
Invalidation: Daily Close Below $0.0021
TA Only. Not Financial Advice. DYOR.

$AXS Crashed 98% From Its ATH. Now It Just Pumped 65% In One DayNYSE:AXS Crashed 98% From Its ATH. Now It Just Pumped 65% In One Day. Here’s What Changed:
After A Brutal -99.67% Drop From Its $166 ATH to $0.55, NYSE:AXS Is Finally Showing Strength.
Price Surged 65%+, Reclaiming $2 With $1.18 Billion+ Volume And Is Up Over 190% In The Past Month
Driven By A Major Tokenomics Upgrade:
🔹 Launch Of bAXS (1:1 Backed By AXS)
🔹 Rewards Stay Inside The Ecosystem
Technical View
Strong Bounce From $0.80–$1.00 Accumulation Zone
Now Holding $1.50–$2.00 As Support
New Accumulation Zone: Around $1.50-$1.20
Next Resistance Sits Around $3.80
Key Invalidation Below $0.75
Narrative: Gaming Tokens Are Catching Bids Again:
RON +20% | SAND +30% | MANA +21%
#AXS Was The King Last Cycle: Is NYSE:AXS Setting Up For A Run Back To Its $166 ATH?
NFA | DYOR

Altseason 2026 Will Be Bigger Than 2017 & 2021 Combined Altseason 2026 Will Be Bigger Than 2017 & 2021 Combined 🚀
OTHERS/BTC (Altcoins Vs Bitcoin) Is Back At The Same Support Level That Triggered Every Major Altcoin Cycle.
2017: +423% Rally
2021: +503% Rally
2026: ~702% Projected Move
Every Cycle This Ratio Bounces, Small Caps Go Parabolic And 10x–100x Opportunities Are Born.
The Only Question That Matters Now:
Are You Early Or Too Late?
NFa & Always DYOR

Bullish Engulfing Pattern🔎 Overview
Overview
The Bullish Engulfing Pattern is a strong price-action formation that appears after a decline or extended consolidation. It occurs when a large bullish candle completely engulfs the previous bearish candle, signaling a decisive shift in control from sellers to buyers. This pattern often reflects accumulation by stronger participants and can mark the early stage of a long-term market transition rather than a short-term reaction.
------------------------------------------------------------
📘 Concept – Bullish Engulfing
A Bullish Engulfing forms when:
• A small bearish candle is followed by a strong bullish candle
• The bullish candle’s body fully engulfs the previous bearish candle
This structure shows buyers stepping in decisively and overpowering sellers.
------------------------------------------------------------
🧭 How to Use
• Validation Line → If price holds and closes above the validation line, continuation strength is supported.
• Devalidation Line → If price closes below the devalidation line, the setup fails and weakness dominates.
------------------------------------------------------------
📊 Chart Explanation
1️⃣ Engulfing Formation
A strong bullish candle fully engulfs the prior bearish candle, signaling a momentum shift.
2️⃣ Protection Zone
The upper highlighted zone acts as a control area. Acceptance above this zone suggests follow-through potential.
3️⃣ Failure Zone
The lower zone defines risk. Price acceptance below this level invalidates the structure.
4️⃣ Price Reaction
Above the validation line → strength and continuation bias.
Below the devalidation line → loss of structure and failed setup.
------------------------------------------------------------
👀 Observation
• Engulfing patterns work best near support or after consolidation.
• Candle close is more important than intrabar movement.
• Structure confirmation improves reliability.
------------------------------------------------------------
📝 Summary
• Strong bullish candle absorbs prior selling
• Clear validation and failure zones define structure
• Confirmation depends on price acceptance, not prediction
------------------------------------------------------------
⚠️ Disclaime r
📘 For educational purposes only.
🙅 Not SEBI registered.
❌ Not a buy/sell recommendation.
🧠 Purely a learning resource.
📊 Not Financial Advice.

$TAO PRICE PREDICTION | IS $3,000 POSSIBLE? | CRYPTOPATELGETTEX:TAO Is Trading At A Key HTF Accumulation Zone On The Weekly Chart After A Deep Correction From The 2024 Highs.
Market Structure Continues To Suggest Smart Money Re-Accumulation At Long-Term Demand.
Weekly Technical Structure:
• Bullish Order Block Holding: $260–$285
• Strong Historical Reactions From This Demand Zone
• Range Compression After Liquidity Sweep
• Key Strength Trigger: Weekly Close Above $440 (S/R Flip)
CryptoPatel Targets:
$1,000 / $1,500 / $3,000+
As Long As TAO/USDT Holds Above $260, The Macro Bullish Bias Remains Intact.
A Clean Break Above The $700–$800 Supply Zone Opens The Door For Price Discovery.
Invalidation: Weekly Close Below $260
TA Only. Not Financial Advice. DYOR.

$XMR Hits New ATH $650: But Here’s My WarningOMXSTO:XMR Hits New ATH $650: But Here’s My Warning
Privacy Coin Just Hit An All-Time High Exactly When Dubai Banned Privacy Coins.
Classic Crypto, They Ban It, We Pump It 😂
The Returns:
2 Years → 6x
1 Year → 3.5x
2026 (Just 13 Days) → +57%
My Honest View:
🔹 Global Regulations Are Tightening Hard On Privacy Coins Like OMXSTO:XMR And $ZEC.
🔹 Remember What Happened To CRYPTOCAP:ZEC ?
🔹 Pumped To $775 → Crashed To $300
🔹 That’s A 61% Dump In Just A Few Days.
When Regulators Target Something This Aggressively, These Pumps Can Turn Into Exit Liquidity Before Major Crashes.
My Suggestion:
❌ No Fresh Entries At This Level
✅ If Holding: Consider Booking Profits
⚠️ If You Still Want In (FOMO Mode): ALWAYS Use Stop Loss
Risk Here Is HIGH. Potential Reward Is LIMITED.
This Isn’t FUD: This Is Risk Management.
Stay Smart. Book Profits. Protect Capital.
Not Financial Advice & DYOR: Just Awareness For My Community 🙏

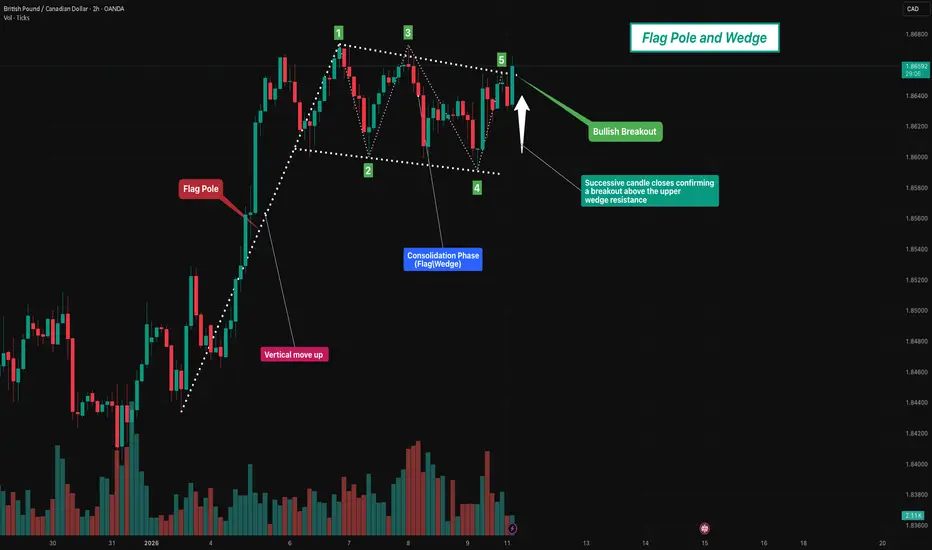
Flag pole and Wedge🧭 Overview
The chart illustrates a strong bullish impulse followed by a descending wedge formation, a well-known trend continuation structure.
After a sharp upward move (flag pole), price enters a controlled pullback where volatility contracts, forming lower highs and slightly lower or stable lows.
This setup represents a healthy pause in the trend, indicating accumulation and preparation for a potential bullish continuation.
⸻⸻⸻⸻⸻⸻⸻⸻⸻⸻⸻⸻⸻
📊 Chart Observations
1. The initial move shows strong bullish momentum, creating the flag pole with decisive candles.
2. Following the impulsive rally, price starts forming Lower Highs, indicating short-term profit booking.
3. Simultaneously, the lows remain controlled and gradual, shaping a descending wedge structure.
4. Price consolidates within the wedge, reflecting volatility contraction and market balance.
5. The prior flag pole suggests that the dominant trend remains bullish, favoring continuation rather than reversal.
6. As the wedge tightens, pressure builds for a breakout, typically in the direction of the prevailing trend.
7. Confirmation: A valid bullish continuation is confirmed when successive candles close above the upper wedge trendline.
⸻⸻⸻⸻⸻⸻⸻⸻⸻⸻⸻⸻⸻
🟢 Summary
Structure: Flag Pole + Descending Wedge
Market Context: Strong uptrend with healthy corrective consolidation
Trade Bias: Bullish — focus on breakout above the upper wedge boundary
Key Validation: Consecutive candle closes above wedge resistance
⸻⸻⸻⸻⸻⸻⸻⸻⸻⸻⸻⸻⸻
⚠️ Disclaimer
📘 For educational purposes only
🙅 Not SEBI registered
❌ Not a buy/sell recommendation
🧠 Shared purely for learning and pattern understanding
📊 Not Financial Advice
Gold Structure Update – Bulls Still in Control next 4518++Hello everyone, gold is trading inside a clear rising channel, and the structure remains bullish with higher lows intact. After the recent upside move, price has pulled back toward the lower side of the channel, which is a normal and healthy move in a strong trend.
This pullback is happening exactly where buyers are expected to step in. As long as price holds above the marked support zone, the probability still favors upside continuation, not breakdown. Strong trends usually pause, shake out weak hands, and then continue.
For now, there is no sign of trend failure. Only a clean break and acceptance below support would change the view. Until then, this remains a buy-on-pullback market, not a place to panic or chase.
Key Levels to Watch
Buy Zone: 4466–4463
Stop Loss: Below 4445
1st Target: 4480
2nd Target: 4500
3rd Target: 4518
Bias: Bullish above support
Disclaimer: This analysis is for educational purposes only and should not be taken as financial advice. Please do your own research or consult your financial advisor before investing.
Analysis By @TraderRahulPal | More analysis & educational content on my profile.
If this update helped, like and follow for regular updates.

$SUI PRICE FORECAST | IS $20 POSSIBLE? CRYPTOCAP:SUI PRICE FORECAST | IS $20 POSSIBLE? | ANALYSIS BY CRYPTOPATEL
CRYPTOCAP:SUI Is Showing A Clear High-Timeframe Smart Money Re-Accumulation Structure On The Weekly Chart After A Deep Correction From 2024 Highs.
Market Structure Overview
After A ~76% Drawdown, Price Swept Liquidity At The Lows And Printed A Strong Reversal, Signaling Demand Absorption And Institutional Interest.
Technical Confluence
Weekly Bullish Order Block: $1.50 – $1.30
OB Aligned With Fair Value Gap (Strong Demand Zone)
~45% Impulse Move Already Delivered From This Area
Price Structure Respects A Rising Channel
HTF Bias Turning Bullish
👉 Best Entry Zone ($1.50 – $1.30) Was Shared Earlier, Cleanly Filled, And Has Already Given ~45% Profit On A Short-Term Swing.
Targets (HTF Expansion)
TP1: $4.8 (Previous Weekly Resistance)
TP2: $18 – $20 (HTF Expansion + Psychological Zone)
⚠️ Invalidation
Weekly Close Below $1.20 Breaks The Bullish Structure
Final Thoughts
This Is A Patience-Based Weekly Setup, Not A Short-Term Trade. As Long As Price Holds Above The Bullish OB, Upside Expansion Remains The Higher Probability Scenario.
Disclaimer: TA Only. Not Financial Advice. Markets Are Probabilistic. Always Do Your Own Research.

$LINK Price Outlook | Is $100+ On The Table? | CryptoPatelBIST:LINK Price Outlook | Is $100+ On The Table? | CryptoPatel
BIST:LINK Is Showing Strong Signs Of A Macro Bullish Reversal After Holding A Multi-Year Support Zone On The 2W Timeframe. The Current Structure Suggests A High-Timeframe Trend Shift That’s Been Building Since The 2021 Top.
Technical Breakdown (HTF):
✅ Breakout And Retest Confirmed
✅ Strong Accumulation Zone: $9 – $12
✅ Holding Above The 0.618 Fibonacci Level ($9.88)
✅ Higher Lows Forming → Macro Trend Turning Bullish
✅ Major Resistance Zone: $25 – $31 (Expansion Trigger)
Upside Targets (CryptoPatel): $31/$52/$90 – $100 (~780% Potential Cycle Move)
Bullish Thesis:
As Long As BIST:LINK Holds Above $7, The Macro Bullish Structure Remains Valid. This Is A Patience-Based, High-Timeframe Setup With A Strong Risk-To-Reward Profile For Spot Positions.
Invalidation:
❌ Weekly Close Below $7
Disclaimer:
Technical Analysis Only. Not Financial Advice. Markets Are Probabilistic—Always Do Your Own Research.

$ONDO PRICE FORECAST | IS $7.65+ POSSIBLE? | CRYPTOPATEL TALSE:ONDO Is Trading At A High-Timeframe Fibonacci Demand Zone, Holding The 0.618 Retracement (~$0.45) After A Deep Corrective Move — A Textbook Accumulation Structure.
Technical Structure
Accumulation Zone: $0.40–$0.45
Bullish Order Block / Deeper Demand: $0.25–$0.30 (0.786 Fib)
HTF Structure Remains Valid Above $0.25
Structural Flip Can Trigger Impulsive Expansion
Price Targets: $0.82 → $1.20 → $2.15 → $7.65+
As Long As Demand Holds, ONDO Remains Positioned For A Multi-Leg Cycle Expansion With 2000%+ Upside Potential.
Accumulation Phase In Progress — Patience Is Key.
Technical Analysis Only | Not Financial Advice

$ONDO PRICE FORECAST | IS $7.65+ POSSIBLE?LSE:ONDO is currently trading inside a high-timeframe Fibonacci demand zone after a deep corrective move. Price is holding above the 0.786 retracement, suggesting a potential accumulation phase rather than continuation to the downside.
This structure is consistent with HTF accumulation behavior, where patience is required before expansion.
\
Technical Structure Overview:
HTF Accumulation Zone: $0.45 – $0.35
Bullish Order Block / Deeper Demand: $0.30 – $0.25 (0.786 Fib)
HTF Market Structure Remains Valid Above: $0.25
Breakout Potential: Once local structure flips bullish
Current Phase: Accumulation → No confirmation yet
As long as demand holds above the key HTF support, LSE:ONDO remains technically positioned for a multi-leg expansion during the next impulsive phase.
Upside Targets (HTF):$1.00/$2.00/$4.00/$7.65 – $8.00+
A sustained move from this base could support a strong cycle expansion, provided market conditions align.
TA only | Not financial advice | Always DYOR

XAUUSD Bullish Continuation | Buy the Dip @ 4400 - 4375Gold (XAUUSD) has delivered a strong bullish impulse following heightened geopolitical tensions involving the US and Venezuela. Price is holding firmly above the 4400 key support zone, signaling sustained bullish strength.
As long as gold maintains acceptance above this level, the bias remains bullish, with upside targets at 4440 and 4470.
We are patiently waiting for a healthy pullback toward support to look for high-probability buy opportunities in line with the prevailing trend.
📌 Disclaimer:
This analysis is for educational purposes only and is not financial advice. Always manage risk and follow your trading plan.
Your feedback drives our content and keeps everyone trading smarter. Let’s make those pips together! 🚀
Happy Trading,
– The InvestPro Team

$ASTER PRICE FORECAST | CAN ASTER HIT $10–$15? | ANALYSIS BY CPBINANCE:ASTERUSDT | Breakout Structure From HTF Accumulation | TA By CryptoPatel
ASTER is trading at a high-timeframe accumulation base following a prolonged corrective phase. Price compression near demand indicates trend exhaustion with increasing probability of a bullish expansion.
Technical Structure
Accumulation range holding: 0.65 – 0.75
Descending trendline pressure building
Strong demand reaction inside accumulation zone
Volatility contraction → expansion setup
Key Levels
Bullish While Above: 0.65
Invalidation: Daily close below 0.60
Upside Targets: $1.50/$2.00/$5.00/$10.00/$15.00
If price accepts above the range high, structure supports a multi-leg continuation move.
😄 Fun Note: Market whispers say even CZ might be quietly watching ASTER, accumulation phases tend to attract smart eyes.
Disclaimer: This is technical analysis, not financial advice. Markets are probabilistic. Manage risk accordingly.
