HINDALCO Price Action ## HINDALCO Price Analysis (August 2025)
### Price & Market Metrics
- **Current share price:** ₹700.50 (NSE, as of August 13, 2025).
- **Market capitalization:** Approximately ₹1,574 billion (₹1.57 lakh crore).
- **52-week price range:** ₹546.45 (low) to ₹772.65 (high).
- **Day's trading range:** ₹670.95 to ₹704.95 on the latest session.
- **Price change:** Up about 5.01% from previous close.
### Returns & Volatility
- **1-week price change:** Approximate gain of 2.29%.
- **3-month price change:** About 10.36% gain.
- **6-month price change:** Around 16.27% gain.
- The stock shows moderate volatility consistent with general metals sector trends.
### Valuation Metrics
- **Price/Earnings (P/E) ratio:** Approximately 9.2, which is relatively attractive for the sector.
- **Earnings Per Share (EPS):** ₹76.11.
- **Price/Book (P/B) ratio:** Around 1.2.
- **Dividend yield:** Low, close to 0.7%.
### Financial & Business Highlights
- Hindalco has exhibited a strong revenue growth, with a recent annual revenue growth rate beating its past three-year CAGR.
- The company maintains control over its interest and employee expenses relative to operating revenues, with interest cost at about 1.43% of revenue.
- It operates in the metals and non-ferrous sector with a broadly positive market sentiment.
- The company recently held a board meeting focused on quarterly results, indicating active management and transparency.
### Technical & Sentiment Overview
- The recent price momentum is upward, with the stock closing near its higher range for the year.
- Volume traded is robust, reflecting active interest among investors.
- Technical charts indicate some bullish candle formations recently.
***
### Summary
Hindalco Industries is trading near ₹700, well within its 52-week range and showing resilient upward momentum backed by solid earnings and reasonable valuation multiples. The P/E ratio near 9.2 suggests the stock is relatively undervalued compared to many peers in the sector, supported by stable profitability and manageable expenses. Dividend yield is modest, reflecting a growth-oriented capital allocation approach.
The company’s strong operational performance, with revenue outpacing historical averages, combines with positive technical signals to offer confidence for investors. Moderate volatility and sector conditions should be considered, but overall the valuation appears attractive given Hindalco's bulk steel and aluminum markets exposure and growth trajectory.
Investors should watch for quarterly financial updates and sector dynamics for ongoing assessment.
Bullishbreakout

RACL Geartech cmp 1169.20 by Daily Chart view since listedRACL Geartech cmp 1169.20 by Daily Chart view since listed
- Support Zone 1050 to 1125 Price Band
- Resistance Zone 1195 to 1245 >>> ATH 1347.80
- Volumes have spiked very heavily over past 2 days
- Strong Bullish Bottom formed around the Support Zone
- Resistance Zone Breakout attempts in the making process
- Falling and Rising Price Channels repeated since day of listing
- Majority of the Technical Indicators showing positive momentum

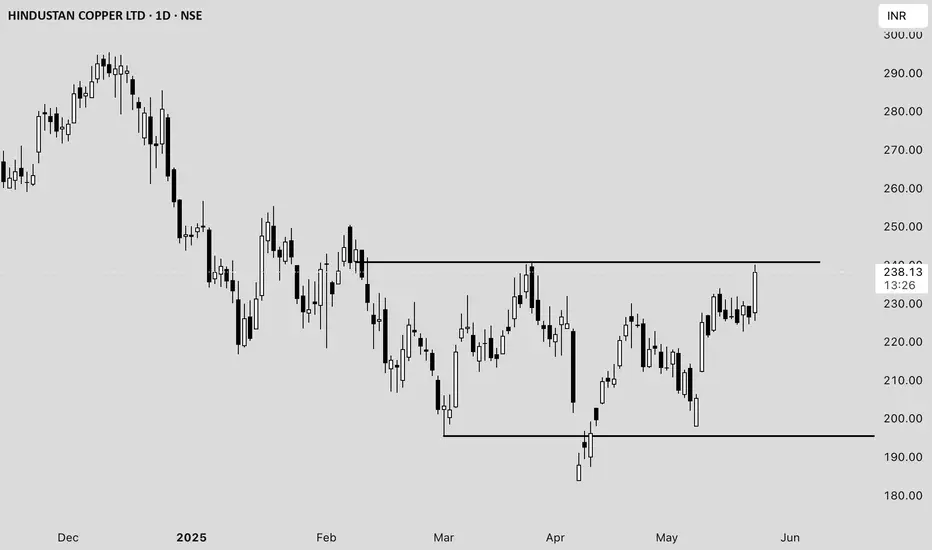
Hindustan Copper Ltd. (HINDCOPPER) Price Analysis **Date:*#### **Current Price and Intraday Movement**
- **Latest Price:** ₹237.98 (+5.09% / +₹11.52)
- **Day’s Range:** ₹225.50 – ₹240.10
- **Open:** ₹227.60
- **Previous Close:** ₹226.46
- **Volume:** 1.63 crore shares (well above average daily volume of 55.89 lakh)
#### **Technical Overview**
- **52-Week Range:** ₹183.82 – ₹381.90
- **50-Day Average:** ₹216.99
- **200-Day Average:** ₹260.58
- **Market Cap:** ₹23,013 crore
- **P/E Ratio:** 57.48
- **EPS:** ₹4.14
#### **Recent Performance and Trends**
- **Short-Term Trend:** The stock surged over 5% today, outperforming its sector and showing strong buying interest .
- **Volume Spike:** Today’s volume is nearly triple the average, indicating heightened trader participation .
- **Technical Position:** The stock is trading above its 50-day moving average but remains below the 200-day average, suggesting a recovery from recent lows but still under medium-term resistance .
- **Support/Resistance:** Immediate resistance is near ₹240–₹249 (upper circuit), with support at ₹225 and ₹216 (50-DMA) .
#### **Fundamental Snapshot**
- **Valuation:** High P/E ratio (57.48) signals expensive valuation relative to earnings .
- **Profitability:** EPS at ₹4.14; profit margins have been under pressure.
- **Industry Position:** Hindustan Copper is India’s primary copper producer, with exposure to global copper price trends and domestic infrastructure demand.
#### **Outlook**
- **Short-Term:** Strong momentum and volume could drive further upside if it breaks above ₹240, but overbought conditions may trigger profit booking near resistance.
- **Medium-Term:** Needs to sustain above the 200-DMA (~₹260) for a confirmed trend reversal.
- **Risks:** High valuation and recent volatility; global commodity price swings can impact earnings.
---
**Summary:**
Hindustan Copper is showing robust short-term momentum with strong volume and price gains, but faces resistance near ₹240–₹249. The stock remains fundamentally expensive, and investors should watch for sustained moves above the 200-DMA for a longer-term bullish signal .
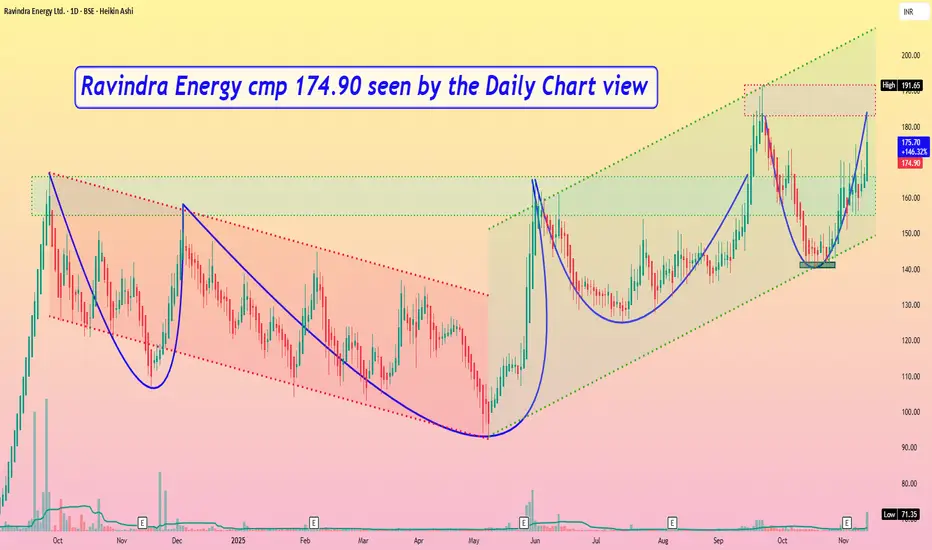
Ravindra Energy cmp 174.90 by Daily Chart viewRavindra Energy cmp 174.90 by Daily Chart view
- Support Zone 155 to 166 Price Band
- Resistance Zone 183 to ATH 191.60 Price Band
- Bullish Triple Bottom formed at 140 to 142 price band
- Repeated Bullish Rounding Bottoms with considerate VCP too
- Volumes spiking in good numbers intermittently over past few weeks
GRMOVER Price ActionGRM Overseas Ltd is trading around ₹366 as of September 9, 2025, following a mild intraday uptrend after opening at ₹362 and reaching a high of ₹366.95. The market capitalization is close to ₹2,200 crore, with the share price well supported in the upper range of its yearly performance, having moved from a 52-week low of ₹175.90 to a high of ₹397.65.
The company’s core business in branded and non-branded basmati rice exports and domestic sales has delivered robust annual revenues of over ₹1,300 crore. Profitability metrics remain stable, with a price-to-earnings ratio of 35.5, slightly higher than the sector average, reflecting market optimism for growth. Operational leverage is evident from the healthy asset turnover ratio above 2, while debt levels remain negligible, supporting a strong balance sheet.
Shareholding patterns show promoter ownership at 70.8%, foreign institution participation rising over recent quarters, and retail holding close to 27%. Trading volumes and delivery percentages indicate active investor interest. Despite somewhat muted profit growth, GRM Overseas continues to invest in capacity and product expansion, positioning itself for steady sectoral growth. Technical indicators suggest support near current levels; however, volatility remains possible in the event of broader market swings.

TFCILTD Price Action## TFCILTD – Price Analysis (August 2025)
### Price & Market Metrics
- **Current share price:** ₹297.75 (as of August 13, 2025; latest close).
- **Market capitalization:** Approx. ₹2,757crore.
- **52-week range:** ₹122.32 (low) – ₹303.50 (high); new high reached in early August.
- **All-time low:** ₹4.45 (Sep 2001).
- **All-time high:** ₹303.50 (July–August 2025).
- **Day’s range (Aug 13):** ₹282.60–₹303.50.
- **Volume:** 3,955,421 shares traded on Aug 13.
- **Beta:** 1.24, showing moderate volatility.
### Returns & Volatility
- 1-week gain: Around 8.25%.
- 1-month gain: Approximately 4%.
- 1-year return: Roughly 67%.
- Daily moves of 5-6%; volatility is moderate to high recently.
### Valuation
- **Price/Earnings (P/E) ratio:** 31.10–31.47 (much higher than sector average of ~11.4).
- **Price/Book (P/B) ratio:** 2.69–3.14.
- **Book Value Per Share:** ₹94.80–₹110.54.
- **Dividend yield:** About 1.01%; ex-dividend date August 14, 2025.
- **EPS (TTM):** ₹9.46–11.77.
- **Intrinsic value estimate (GF Value):** ₹152.95—current price trades at a 95% premium over this fair value estimate.
### Financial & Business Highlights
- Revenue (TTM): ₹1.58billion.
- Net profit (TTM): ₹1.09billion.
- Net profit margin: Approximately 69%.
- Debt/Equity Ratio: ~70.9% (moderate leverage).
- Gross margin: 99% (financial lending business).
### Technical & Sentiment Overview
- Stock made a new all-time high in early August.
- Trend is bullish, supported by heavy volumes.
- Dividend payout scheduled for September 20, 2025.
- Overall business cited as "average growth, high valuation" in recent analysis.
***
## Summary
TFCILTD is trading near record highs at ₹297.75, well above its estimated fair value and sector norms. The stock’s valuation metrics—particularly its P/E and P/B ratios—are elevated, reflecting strong price momentum and investor enthusiasm. Financial performance shows very high profit margins and reasonable growth, but the premium to intrinsic value signals potential overvaluation risks. Volatility and recent price swings are moderately high. Investors should weigh current optimism and momentum against valuation concerns and sector returns.

Fortis Healthcare’s share price analysisFortis Healthcare’s share price is currently around ₹667, reflecting strong momentum and significant outperformance over the past year, with a return of about 49%. The stock recently touched a 52-week high of ₹744.5 and a low of ₹406, indicating a broad trading range and robust investor interest
Analyst sentiment remains bullish, with most forecasts targeting a price range of ₹736 to ₹850 over the next 12 months, suggesting a potential upside of around 10–20% from current levels . Some projections are even more optimistic, with year-end 2025 targets as high as ₹933 if market conditions remain favorable . Technical indicators currently point to a bullish trend, supporting the positive outlook .
Fundamentally, Fortis Healthcare has reported strong financial results, including an 84% year-on-year jump in net profit for Q3 FY2024-25 and a 40% quarterly profit increase, underscoring operational momentum . The company trades at a price-to-earnings (PE) ratio of about 65, which is above the sector average, indicating that the stock is priced at a premium due to its growth prospects . The price-to-book (PB) ratio is 3.49, and the dividend yield is modest at 0.24% .
In summary, Fortis Healthcare is in a bullish phase, supported by strong earnings growth and positive analyst outlooks. While the stock is trading at a premium valuation, its growth trajectory and sector leadership continue to attract investor interest, with further upside likely if current trends persist

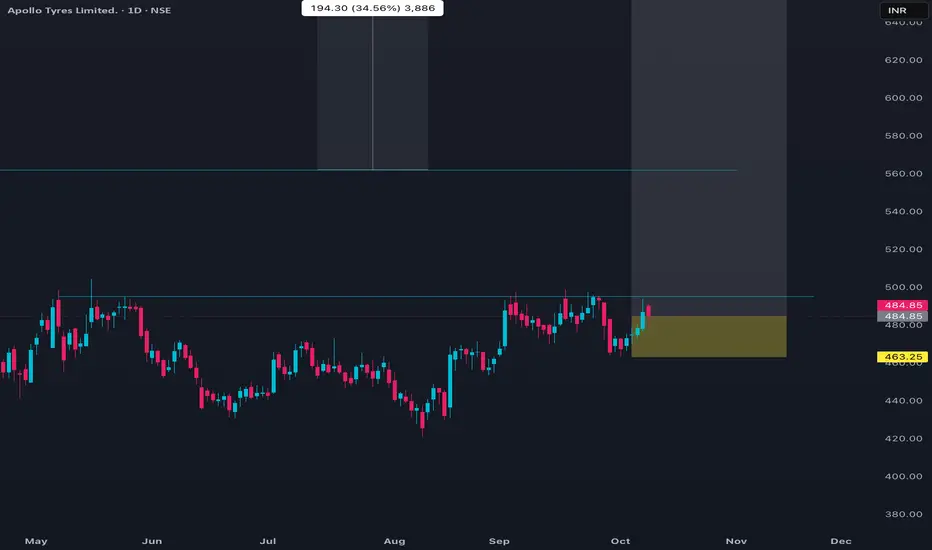
APOLLOTYRE Price ActionApollo Tyres is currently trading in the range of 479 to 492. The last recorded price was about 487, following a recent day’s high of 491.5 and a low of 479.65. The volume on the last trading day exceeded 5.8 lakh shares, with an average delivery percentage around 50%. The stock is experiencing mild upward price momentum on short-term technicals, with several recent bullish EMA crossovers on daily charts.
Financially, the market capitalisation is about ₹30,800 crore. The trailing P/E ratio stands high over 36, while the P/B is just above 2. The EPS has seen a notable YoY decline. Over the last month, price movement has been flat to slightly positive, while medium-term (six months) shows a rise of more than 20%. Returns over the past year remain negative. The 52-week high is 557, and the low is 371.
Analyst consensus is positive with several recent buy ratings and a target clustered around the ₹590 level. The overall trend is positive in the short term, supported by technical indicators, while valuation remains elevated.
Cupid Price ActionCupid Limited’s stock is trading around ₹158 as of early August 2025, having recently hit new record highs above ₹162. The share price surged over 45% in the past month and is up more than 100% year-to-date, significantly outperforming both its FMCG peers and the broader market. Volatility is high: daily moves of 5–6% are common, and intraday swings have reached as much as 8%. The stock is trading well above all major moving averages, reflecting strong buying momentum.
Long-term performance is outstanding: over 1,300% returns in three years and more than 2,100% across ten years. That said, short-term technical signals show that Cupid is “overbought” (very high RSI) and potentially due for a corrective pullback, though robust momentum could drive further gains. The high PE ratio near 104 and price/book around 21 indicate a rich valuation versus historic averages and sector norms.
Market capitalization is about ₹4,240 crore. Despite being expensive on most valuation models, the company is seen as fundamentally strong: steady operational performance, minimal debt, and no significant pledged shares. The company’s next earnings announcement is due August 8, and recent market behavior suggests results can drive significant further volatility.
Compared to other FMCG names, Cupid’s returns are exceptionally strong while most large and mid-cap sector players (like HUL, Dabur, and Colgate) have posted declines over the past year. Liquidity has increased with heavy volume spikes during rallies, supporting the uptrend.
In summary, Cupid is a high-momentum, high-volatility small-cap outperformer exhibiting extraordinary multi-year returns. The stock trades at elevated valuations and, while short-term corrections may occur, its leadership in the sector and technical strength continue to attract aggressive buyers.

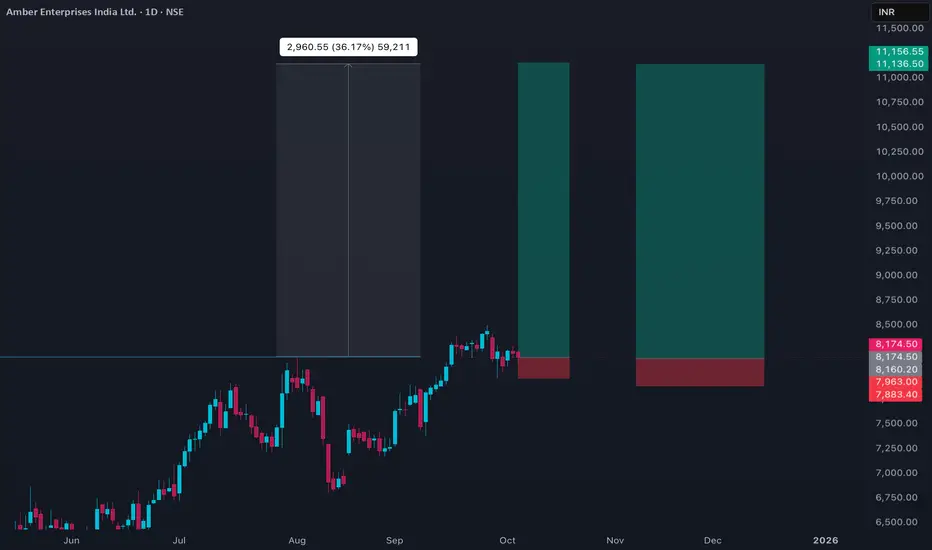
AMBER Price ActionAmber Enterprises India (AMBER) detailed price analysis as on October 7, 2025:
- The stock is trading near ₹8,172 to ₹8,175 levels on BSE and NSE with a slight decline of about 0.49% compared to the previous close.
- The day’s trading range was between ₹8,054.6 (day low) and ₹8,240.5 (day high) on BSE, and ₹8,081 to ₹8,243.5 on NSE.
- The stock opened around ₹8,214 and showed mild intraday volatility within this range.
- The 50-day moving average is near ₹7,720 and the 200-day moving average near ₹6,930, indicating a strong uptrend in the medium to long term.
- The Price-to-Earnings (P/E) ratio remains high at about 101, reflecting rich valuation.
- The stock showed moderate volume compared to average, signaling steady participation but no strong directional bias today.
- Long-term fundamentals remain solid with consistent revenue and earnings growth.
- Resistance is near the recent highs around ₹8,490, with support levels near ₹7,700 to ₹7,900.
- The overall price behavior suggests consolidation with a slight bearish tilt on the day, but medium-term bullish momentum stays intact.
This analysis captures the current sideways-to-slightly-negative price action within a broader uptrend context for AMBER on this date.
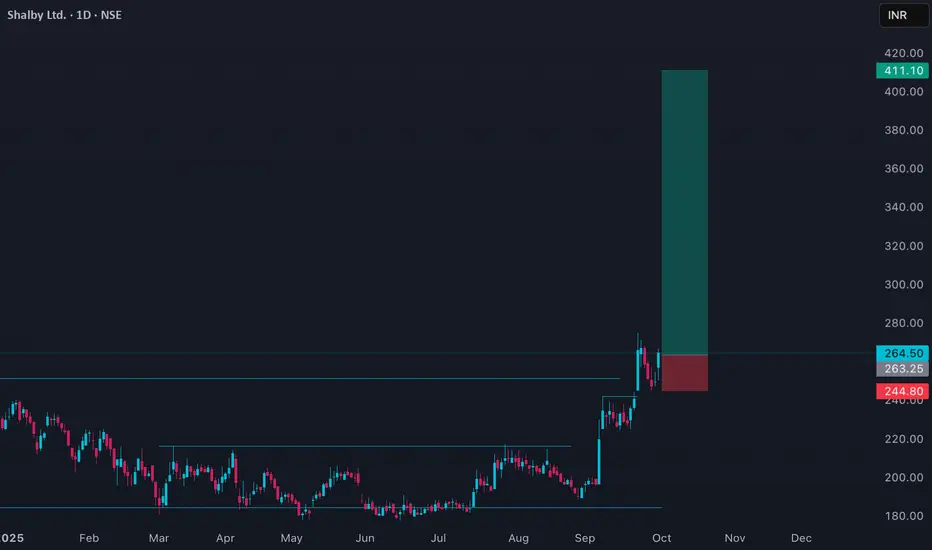
SHALBY Price ActionShalby Limited (SHALBY) is currently in a strong uptrend, closing today at ₹264.85 with a gain of about 6.64%. The stock has traded between ₹250.05 and ₹266.60, showing high momentum and robust volume, indicating strong buying interest.
Price action reveals that SHALBY is trading well above both its 50-day average (~₹214.55) and 200-day average (~₹205.60), confirming the bullish trend. The stock is nearing its 52-week high of ₹282.30, which represents a critical resistance level to watch. Immediate support levels are around ₹250, providing a cushion against potential short-term corrections.
Technical indicators suggest the stock is in an overbought zone, so while the momentum is positive, some consolidation or profit-taking may occur near resistance. Overall, the price action signals continued strength and bullish sentiment, with potential for further upside if the stock breaks above the 52-week high on strong volume.
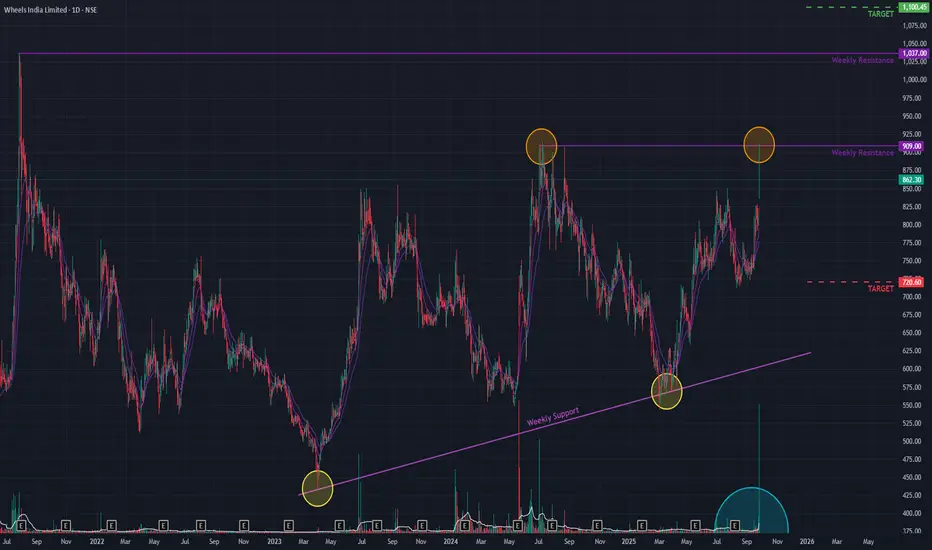
Wheels India (D) - Challenges Key Resistance with Massive VolumeWheels India is making another powerful attempt to break through a key horizontal resistance level that has been in place since July 2024. The stock, which has been in a long-term uptrend since March 2020, has been rejected at this level multiple times.
Today's session was marked by a gap-up opening and an exceptionally high trading volume , significantly larger than in previous attempts, signaling strong bullish intent. However, despite this strength, the stock closed at ₹862.30 , just below the critical resistance, indicating that the battle is not yet won.
Broad-Based Bullish Confirmation 👍
The underlying technical picture remains strong, with multiple indicators suggesting building positive pressure:
- Multi-Timeframe Strength: Both the short-term Exponential Moving Averages (EMAs) and the Relative Strength Index (RSI) are showing bullish crossovers on higher timeframes, confirming broad-based positive momentum.
- Volume Thrust: Today's massive volume spike indicates a significant increase in buyer participation at this crucial juncture.
Outlook: Awaiting a Decisive Close
The stock is at a critical inflection point. While the underlying indicators are bullish, a decisive close above the resistance is needed for confirmation.
- Bullish Case 📈: If the stock successfully breaks and holds above the current resistance, it could clear the path for a move towards the next major hurdle near the ₹1,100 level.
- Bearish Case 📉: If it is rejected once again and the momentum fades, the stock could pull back to find support near the ₹720 level. The price action in the coming days will be crucial.
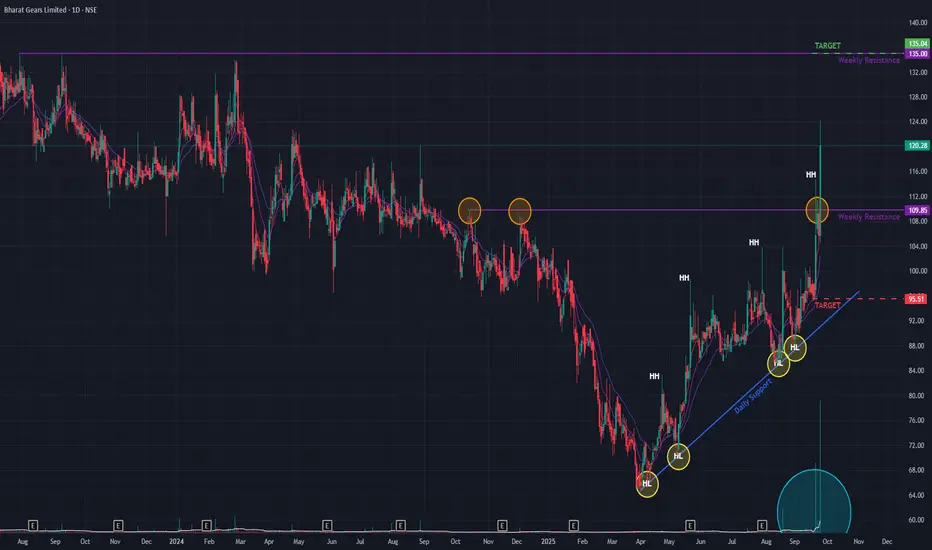
Bharat Gears (D) - Executes a Decisive BreakoutBharat Gears has confirmed a significant bullish development, decisively breaking out of a key resistance trendline. Today's powerful move saw the stock surge +13.74% to close at ₹120.28 , on the back of massive trading volume that was multiple times the recent average. This action reinforces the uptrend that began in April 2025, which has been characterized by a consistent pattern of higher highs and higher lows.
Notably, after several attempts over the past four days, today’s breakout was significant as the stock closed firmly above the resistance level, a strong technical confirmation.
Comprehensive Bullish Confirmation 👍
The breakout is validated by an overwhelmingly strong alignment of bullish signals across all major timeframes:
- Multi-Timeframe Momentum: The short-term Exponential Moving Averages (EMAs) are in a bullish crossover on the monthly, weekly, and daily charts .
- Dual Confirmation: This positive momentum is corroborated by the Relative Strength Index (RSI) , which also indicates a bullish crossover across all three timeframes.
- Volume Thrust: The breakout was accompanied by an exceptionally high volume spike , signaling strong conviction and participation from buyers.
Outlook and Key Levels
Following such a powerful breakout, the stock may potentially retest the breached resistance level as new support . This is a common technical pattern and would serve as further confirmation of the uptrend's strength.
- Bullish Case 📈: If the upward momentum is sustained, particularly on good volume, the next potential price target is the resistance zone around ₹135 .
- Bearish Case 📉: Conversely, if the breakout fails to hold and momentum is lost, the stock could pull back to find support near the ₹95 level.
SYRMA Price ActionSyrma SGS Technology Ltd closed at ₹816.25 today, down 1.39% with a loss of ₹11.5 from the previous session. The stock opened at ₹834.80 and traded within a range of ₹811.95 to ₹836.95, reflecting a mildly bearish session after demand failed to sustain above recent highs. Despite the pullback, Syrma SGS remains in a firm uptrend on longer time frames, still trading well above its 50-day and 200-day averages.
The price action signals some profit booking near resistance zones close to ₹837, while immediate support now lies at ₹812 and secondary support at ₹800. With the recent rally, momentum indicators are cooling but not oversold, suggesting a potential for pause or minor consolidation before the next directional move. With a price-to-earnings ratio near 72.5, Syrma trades at a premium on growth expectations, and market cap continues to expand, standing around ₹14,544 crore.
Overall, the technical posture remains bullish in the medium term, though short-term traders should watch for stabilization near support zones and a decisive close above ₹837 for renewed upside momentum.

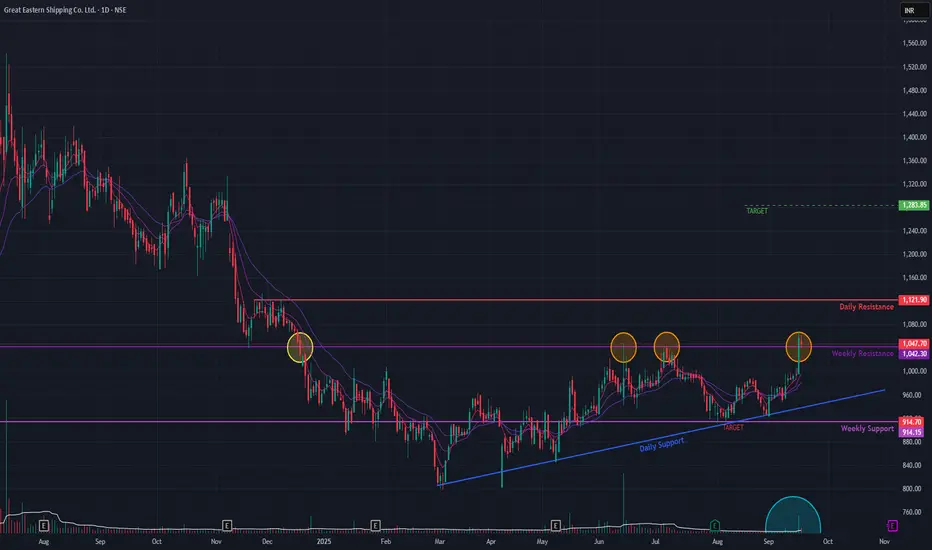
GE Shipping (Daily Timeframe) - Potential Breakout ??GE Shipping has broken out from a critical, long-term resistance level originating from December 2023. The stock is showing strong bullish momentum, confirmed by multiple technical signals.
Key Observations:
Pattern: A double-bottom in April 2025 ended the prior downtrend, leading to a period of consolidation.
Breakout: On Sep 16, 2025, the stock decisively broke above the resistance on high volume.
Confirmation: The breakout was confirmed on Sep 17, as the old resistance successfully held as new support.
Indicators: Bullish EMA crossovers and sustained above-average volume support the move.
Price Outlook :
Upside Target: ₹1283 if the price remains above the breakout level.
Downside Risk: A failure to hold this new support could lead to a decline towards the ₹914 level.
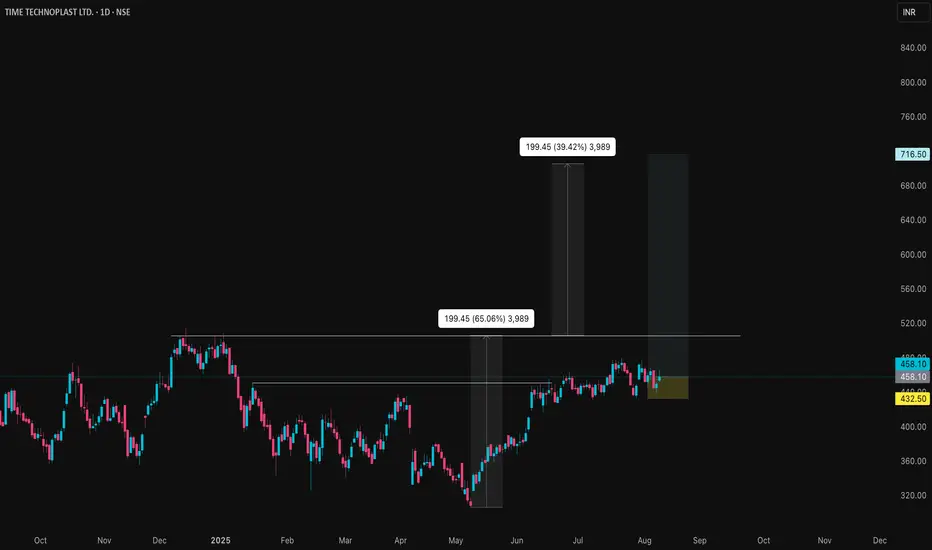
TIMETECHNO Price ction
### Market Metrics
- **Current share price:** ₹458.10.
- **Market capitalization:** ₹10,396crore.
- **52-week price range:** ₹306.60 (low) to ₹513.55 (high).
- **All-time low:** ₹17.55 (Feb 19, 2009).
- **All-time high:** ₹513.55 (Dec 13, 2024).
### Returns & Volatility
- **1-week change:** Down 1.98%.
- **1-month change:** Up 4.83%.
- **1-year return:** Up 43.18%.
- **Recent volatility:** Daily moves between ₹451.70 and ₹466.10 common.
- **Beta:** Not specified, but price swings indicate moderate volatility for sector.
### Valuation
- **Price/Earnings Ratio:** 26.79, above sector average.
- **Price/Book Ratio:** 3.88, also higher than sector average.
- **Dividend yield:** 0.55%.
### Company Fundamentals
- **Revenue (Trailing 12 months):** Approximately ₹54,570million.
- **Net profit margin:** 7.1%, improved over last year.
- **EPS (Trailing 12 months):** ₹17.10 (16.29% YoY growth).
- **Book value per share:** ₹118.21.
- **Return on Equity:** 13.3%.
### Growth & Profitability
- **Annual earnings growth:** 25% (past year), average 25.4% over 5 years.
- **Net profit for Q1 2025:** ₹10,952lakhs, up 18.6% YoY.
- **Free cash flow remains positive; margin improvement noted over 5 years.**
- **Return on assets:** 9.04%.
### Valuation Analysis
- **High PE and PB ratios indicate the stock is priced above sector averages.**
- **Recent buy recommendations from analysts; fair value status varies by source.**
### Qualitative Notes
- **Strong earnings and steady sales growth, but trading above intrinsic metrics.**
- **Growth momentum has slowed versus earlier years, though above industry norm.**
- **Stable dividend payout policy, but yield remains modest.**
- **Technical signals ranged from neutral to bullish in July and August 2025.**
**Summary:** The stock is trading at a high valuation given its growth history and sector performance. Investors should consider recent price corrections, volatility, and elevated PE/PB ratios before entering at current levels. The company maintains strong growth and profitability but is subject to valuation risk if sector trends reverse.
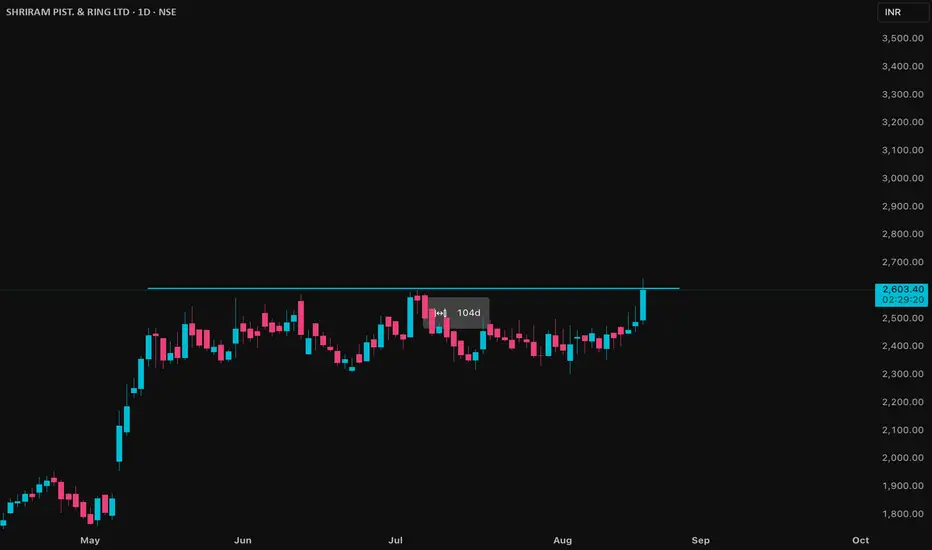
SHRIPISTON Price ActionHere are more detailed insights on Shriram Pistons & Rings Ltd (SHRIPISTON):
**Financial Performance:**
- For FY2025, revenue stood at ₹35.5 billion, up 15% year-on-year.
- Net income reached ₹5.07 billion, a growth of 14%, with a stable profit margin of 14%.
- Latest quarterly (Q1 FY26) income was ₹991.7 crore, up 12.8% sequentially and 14.9% year-over-year; profit after tax was ₹134.9 crore, up 15.8% QoQ and 15.1% YoY.
- EPS for Q1 FY26 was ₹30.40, up from ₹27.10 in the previous quarter.
**Growth & Forecasts:**
- The company’s earnings and revenue are expected to grow at roughly 13-14% per annum in the next few years.
- Return on equity is forecast to be about 21% in three years, signalling strong capital efficiency.
- Price target estimates from analysts suggest a potential move toward ₹3,050 in the medium term.
**Business Fundamentals:**
- Shriram Pistons is a leading manufacturer of pistons, piston rings, and engine components for the automotive industry, serving both domestic and export markets.
- Its customer base covers passenger, commercial, and industrial vehicle sectors.
- The company is consistently improving technology and manufacturing processes, supporting quality and competitive positioning.
**Recent Operational Trends:**
- The company reported 21.45% profit growth for the June 2025 quarter, though its debtors turnover ratio has declined, indicating comparatively slower collection of receivables.
- Operational efficiency is strong, but management is actively working on improving the receivables cycle.
- Dividend payout is regular, with a recent interim dividend of ₹5 per share declared.
**Sentiment & Outlook:**
- Investor and analyst sentiment remains positive, with strong fundamental and earnings performance backing the share price.
- Shares are currently trading near all-time highs following quarterly results and forward guidance; some volatility can be expected as profit booking takes place and the company works through receivables issues.
- The company is viewed favorably for its ability to outperform sector average growth rates and maintain robust profit margins.
**Technical Overview:**
- The stock is in a strong uptrend and trading above its major moving averages.
- Key support can be found around ₹2,000; a break above ₹2,600 could target the analyst consensus price of ₹3,050.
Shriram Pistons continues to show solid performance, sector leadership, and growth, though investors may watch for further improvements in cash flow and receivables management for sustained momentum.
JMFINANCIL Price Action ## JM Financial Limited – Price Analysis (August 2025)
### Price & Market Metrics
- Current share price: ₹186.95.
- Market capitalization: Approximately ₹17,875 crore.
- 52-week price range: ₹78.00 (low) to ₹189.90 (high).
- Day's trading range recently: ₹163.60 to ₹189.90.
- Significant price increase noted recently, with a 14.87% rise on the day observed.
### Returns & Volatility
- The stock has gained about 69% over the last 3 months.
- 12-month return is roughly 97%, showing strong growth.
- 3-year return stands near 182%.
- Recent intraday volatility with daily price swings within a wide range.
### Valuation Metrics
- Price/Earnings (P/E) ratio: Around 16.23.
- Earnings per share (EPS): ₹11.52.
- Price/Book (P/B) ratio: Approximately 1.52.
- Dividend yield: Around 1.46%.
### Financial & Business Notes
- The company has posted moderate sales growth (around 5% year-over-year as per last known data).
- Profitability remains solid with steady net income growth.
- Market sentiment has been strongly positive, driving recent price appreciation.
- Technical indicators show the stock trading well above its 50-day and 200-day moving averages, signaling bullish momentum.
### Summary
JM Financial is currently trading near its 52-week high with strong recent price performance and solid returns over multiple timeframes. The valuation metrics like P/E around 16 and P/B near 1.5 suggest relatively reasonable valuation for a financial services firm with stable profitability. The significant price gains recently reflect positive market sentiment and business fundamentals, though some volatility is present. Investors should consider the solid growth and moderate valuation in the context of overall sector and market conditions when evaluating the stock.

ITDCEM Price Action## ITD Cementation India Limited (ITDCEM) Price Analysis (August 2025)
### Price & Market Metrics
- **Current share price:** Around ₹793 (NSE, August 13, 2025).
- **Market capitalization:** Approximately ₹13,622 crore.
- **52-week range:** ₹467 (low) to ₹944 (high).
- **Day's trading range:** ₹762–₹804.
- **Recent price change:** Up about 4.5% on the day.
- **Average volumes:** About 762,000 shares traded daily in recent periods.
### Returns & Volatility
- The stock has seen a strong rebound from lows around ₹467 in the past year to near ₹793 currently.
- Price movements recently show moderate volatility within a range of about 5% intraday.
- The 52-week high near ₹944 was achieved recently in July 2025.
### Valuation Metrics
- Price/Earnings (P/E) ratio: Approximately 33.3, which is moderately high.
- Earnings per share (EPS): ₹23.83.
- Dividend yield is low at around 0.25%.
- The stock currently trades above its 50-day average price (~₹812) and significantly above its 200-day average (~₹612), indicating recent bullish momentum.
### Financial & Business Highlights
- ITD Cementation is in the infrastructure sector, focusing on construction and civil engineering.
- The company is supported by a solid order book and infrastructure demand growth.
- Market sentiment has been positive with institutional investor meetings scheduled mid-August 2025.
### Technical Sentiment
- The stock price has recently pulled back slightly from highs but remains strong overall.
- Moving averages suggest upward momentum.
- Volume patterns indicate active trading and buyer interest.
***
### Summary
ITDCEM is trading near its upper range for the year, with a current price around ₹793 and a strong market capitalization above ₹13,000 crore. The valuation is moderately high with a P/E above 30 and EPS near ₹24. Recent price momentum is positive supported by infrastructure sector tailwinds and investor interest. While the stock has experienced some volatility, the technical indicators point to sustained buying at current levels. Dividend yield remains low, consistent with growth-oriented infrastructure companies. Investors should consider valuation moderately stretched but justified by growth prospects and market position. Caution is advised for short-term price swings given past volatility.

SKIPPER Price Action## SKIPPER Price Analysis (August 2025)
### Price & Market Metrics
- Latest share price is approximately ₹538.75.
- Market capitalization stands around ₹6,074–6,085crore.
- The 52-week low is ₹341.55 (April 2025) and the high is ₹665.00 (December 2024).
- Recent price trend: Strong rebound from April lows, with current price near the top of the recent trading range.
- Day range on August 13: ₹505.10 – ₹538.20.
### Returns & Volatility
- 1-month gain: About 12%.
- 1-year return: Roughly 33–35%, outperforming broader indices and sector averages.
- 3-year return: Over 880%.
- Skipper often sees daily volatility in the 2–6% range, especially during August. Historically, Augusts show flat average returns but are characterized by abrupt price changes both upward and downward.
### Financial Performance
- Trailing 12-month EPS: ₹14.37.
- TTM net profit: About ₹158.9crore.
- Net sales for the last reported quarter (June 2025): ₹1,253.86crore, up 14.85% YoY.
- Consolidated net sales (March 2025): ₹1,287.75crore, up 11.64% YoY.
- Profit margin is moderate—company has low interest coverage and return on equity relative to valuation.
### Valuation
- P/E ratio: 35–37, well above sector average.
- P/B ratio: About 5.1.
- Dividend yield is very low, with most earnings retained.
- Book value per share: ₹105.69.
### Qualitative & Technical Notes
- The company’s growth is supported by solid export and infrastructure orders, but margins and returns remain modest compared to peers.
- Promoter holding is robust (around two-thirds of shares).
- Technical trend is positive, with outperformance versus sector and key moving averages, but sharp swings are common and corrections have occurred previously after strong rallies.
- Stock currently trades above estimated fair value and sector multiples.
***
### Summary
SKIPPER has rebounded powerfully from earlier lows and is now trading near multi-month highs, supported by strong sales growth and consistent profitability. However, the valuation has become elevated with respect to sector and intrinsic value metrics, while dividend yield remains nominal. Daily volatility and historical instability in August should be considered alongside strong long-term returns and positive business momentum—investors should be alert to potential price corrections or swings at these levels.

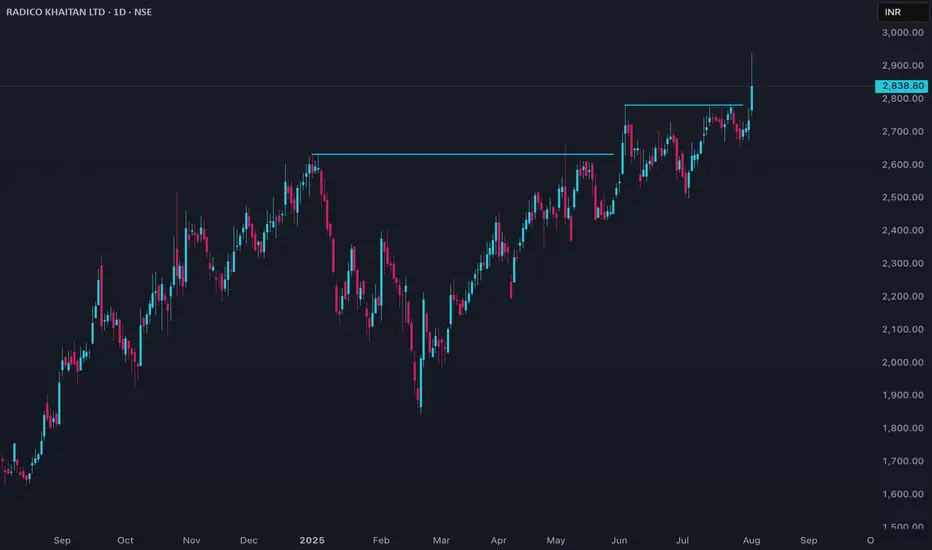
Radico Price ActionRadico Khaitan’s stock is trading around ₹2,840 as of early August 2025, having climbed sharply from about ₹2,700 in July and near ₹2,050 back in February. The share price hit an all-time high at the start of August and has more than doubled over the past 12 months, outperforming its peers in the spirit and beverages sector.
Recent price momentum has been driven by strong financial results: for the quarter ending June 2025, Radico reported net sales of over ₹1,500 crore, a year-on-year increase of more than 32%. Market capitalization is robust and the stock is actively traded, with volumes surging during rally periods. However, valuation is elevated: the price-to-book ratio is around 14 and price-to-earnings is at the high end for its segment, reflecting rich investor expectations.
Operationally, Radico maintains steady margins and has shown above-average revenue growth, consistently launching new premium products and expanding distribution. The company’s return on equity averages about 11–12% over three years, slightly below top FMCG performers but stable.
Technically, the stock is in a strong uptrend, trading well above major moving averages, but may be considered overbought in the very short term after recent rapid gains. Liquidity remains healthy, supporting continued volatility and trading opportunities.
In summary, Radico Khaitan is a high-growth, well-established spirits company with strong recent sales and a share price at historic highs. While fundamentals support continued strength, caution is warranted given expensive valuations and the potential for short-term corrections following such a swift rally.
Gopal Snacks Ltd Price ActionGopal Snacks Ltd’s share price is around ₹359.5 as of August 3, 2025. Over the past year, the stock has shown only a modest increase (up about 1%), with greater strength seen in the last six months (up 7%). The 52-week range is broad, with a high near ₹520 and a low around ₹253, indicating significant volatility. Average daily trade volumes have also risen, supporting liquidity.
The company’s financial performance for FY25 shows total revenue at approximately ₹1,474 crore, a slight rise over FY24. However, net profit slumped sharply to ₹19 crore in FY25 from ₹100 crore a year earlier, with the operating profit margin declining to about 5.3% (from nearly 10%). EPS stands at ₹1.52 for the most recent year. Key ratios—P/E around 82.7 and P/B near 11—point to a premium valuation, especially considering the weak recent profit growth.
Operationally, Gopal Snacks has faced challenges, including a significant quarterly loss attributed to rising costs and a one-off fire incident, which hurt margins and caused a 12% revenue drop that quarter. As a result, compounded profit growth is negative for the trailing twelve months, and return on equity dropped to 14% (from nearly 27% over the previous three years).
Promoter holding remains high (over 81%), but the stock is classified as high-risk, with volatility more than three times that of the broader Nifty index. Despite a positive dividend payout ratio (now around 66%), overall yield remains modest at less than 0.3%.
In summary, Gopal Snacks Ltd is a small-cap FMCG stock trading markedly below its 52-week highs, reflecting weak earnings momentum after a challenging year. Stronger long-term fundamentals and established market presence support the stock, but recent headwinds—including falling margins, higher volatility, and rich valuations—call for investor caution if seeking near-term upside.

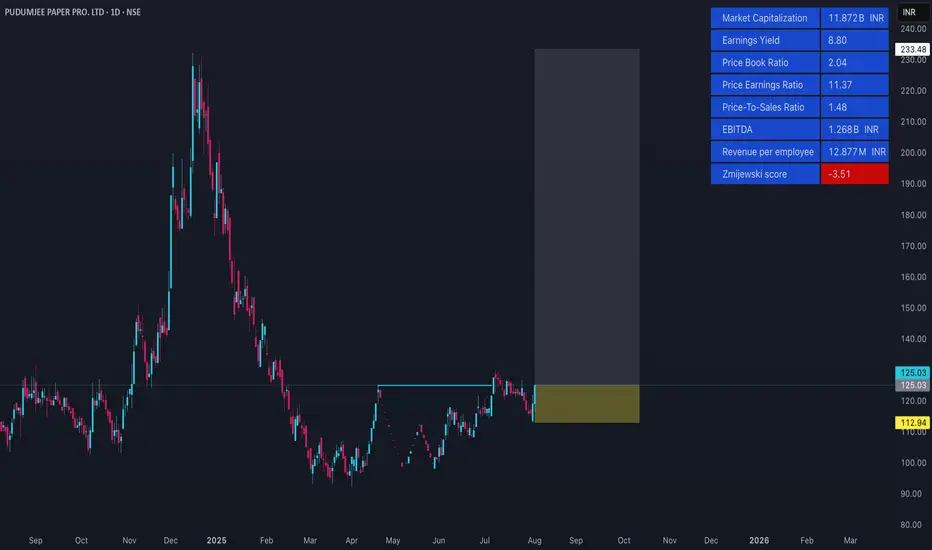
PDMJEPAPER Price ActionPudumjee Paper Products (PDMJEPAPER) trades near ₹125 as of early August 2025, with 52-week highs around ₹232 and lows near ₹90. The stock has demonstrated moderate to high volatility in recent months, with sharp daily moves both upward and downward. Over the last three months, the share price has risen roughly 4–5%, though its one-year return is negative, down about 5%. In contrast, the stock remains an exceptional long-term outperformer: up over 200% in 3 years and roughly 720% over 5 years.
Short-term price trends show a recovery from late June and July lows near ₹110–116, gaining back strength towards ₹125 by August. The market capitalization stands at approximately ₹1,100 crore, and analyst platforms suggest the current valuation is around 11–12 times earnings, with a price-to-book below 2, implying moderate valuation relative to recent growth.
Turnover and liquidity are healthy, with notable volume spikes during price rallies. The company has also outperformed its sector over multi-year periods. Historically, returns in August are mixed, but positive August rallies have been observed in recent years.
Operationally, Pudumjee Paper remains a mid-cap paper manufacturer with a focus on volume growth and steady, positive operating margins. While dividend yields are modest, financial stability is reflected in recent results. Investors should remain cautious due to past volatility and the cyclical nature of the paper sector, but the stock’s long-term performance signals strong sector positioning and improving fundamentals.
This summary is based on current market prices and trends as of August 2025, with emphasis on key performance and valuation metrics, and does not include references to specific data sources.