BDL - “Bullish Kicker Candlestick – Educational Analysis” ________________________________________
📊BDL – Technical & Fundamental Educational Snapshot
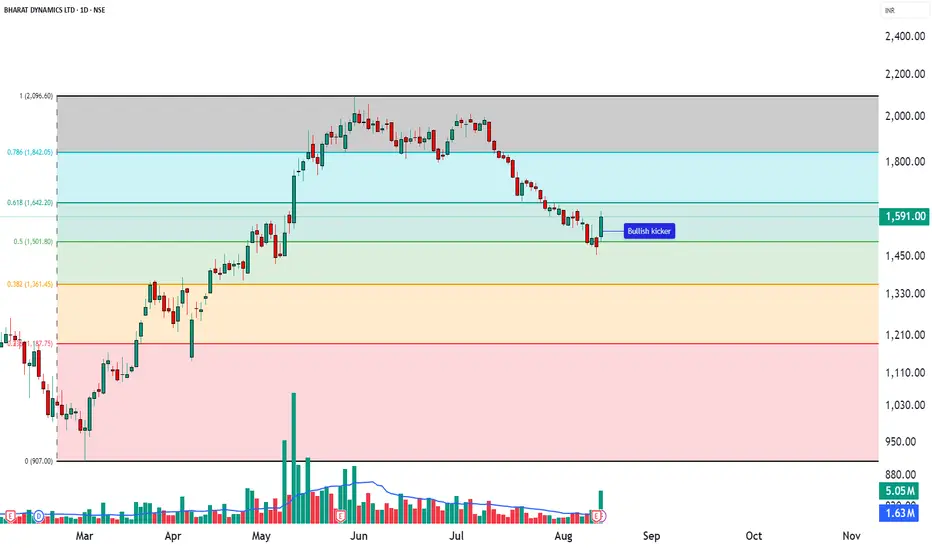
Ticker: NSE: BDL | Sector: 🏭 Defence & Aerospace
CMP: ₹1,591 ▲ (as of 13 Aug 2025)
Rating: ⭐⭐⭐⭐ (Moderately Bullish Setup – Educational Purposes Only)
Pattern Observed: 📈 Bullish Kicker Candlestick Pattern
________________________________________
Bullish Kicker Candlestick – Educational Analysis (BDL, NSE)
The Bullish Kicker is a strong reversal candlestick pattern, signaling a sudden shift from bearish to bullish sentiment. Studying this pattern helps traders understand price action and momentum dynamics.
________________________________________
Key Features:
Gap up from previous candle → sudden change in market sentiment.
No overlap between candle bodies → shows aggressive bullish control.
Bears initially in control, but strong buying pushed the price higher.
________________________________________
💡 Volume Confirmation
Kicker candle volume: 5.05M, compared to 20-day average of 1.63M.
Higher-than-average volume indicates strong participation and validates momentum from an educational perspective.
________________________________________
Support & Resistance Zones
📈Support Zones: 1525, 1460, 1417
📉 Resistance Zones: 1633, 1676, 1741
Patterns near strong support or after a downtrend are typically more reliable for educational analysis.
________________________________________
🔍 Indicator Insights
RSI: 42 – recovering from oversold levels.
VWAP: Bullish – indicates intraday support and momentum.
These indicators provide additional context for studying the pattern, not for direct trading decisions.
________________________________________
⚖️ Trade Planning Concepts (Educational Only)
Entry Concept: Observe the close of the kicker candle, or wait for the next candle to break above its high.
Stop Loss Concept: Slightly below the low of the kicker candle (~1502).
Reference Levels: Nearby resistance zones (1633, 1676, 1741) or risk-reward frameworks.
________________________________________
💡 Risk Management Concepts
Limit risk per study trade (e.g., 1–2% of capital).
Patterns may fail if subsequent price action invalidates the momentum.
________________________________________
Note: Bullish Kickers often follow impactful news or earnings. Observing volume and confirmation indicators is essential to understand price action dynamics.
________________________________________
⚠️ Disclaimer – Please Read Carefully
The information shared here is meant purely for learning and awareness. It is not a buy or sell recommendation and should not be taken as investment advice. I am not a SEBI-registered investment advisor, and all views expressed are based on personal study, chart patterns, and publicly available market data.
Trading — whether in stocks or options — carries risk. Markets can move unexpectedly, and losses can sometimes be larger than the money you have invested. Past performance or past setups do not guarantee future results.
If you are a beginner, treat this as a guide to understand how the market works — practice on paper trades before risking real money. If you are an experienced trader, remember to assess your own risk, position sizing, and strategy suitability before entering any trade.
Data, prices, and analysis are based on information available as of 12 August 2025, and market conditions can change at any time. Always verify with reliable sources and consult a SEBI-registered financial advisor before making any real trading decision.
By reading, watching, or engaging with this content, you acknowledge that you take full responsibility for your own trades and investments.
________________________________________
💬 Found this useful?
Drop your thoughts, questions, or setups in the comments — let’s grow together!
🔁 Share this post with fellow traders and beginners to spread clean, structure-based learning.
✅ Follow simpletradewithpatience for beginner-friendly setups, price action insights, and disciplined trading content.
🚀 Stay Calm. Stay Clean. Trade With Patience.
Trade Smart | Learn Zones | Be Self-Reliant 📊
________________________________________
Bullishkicker
Bullish Kicker - Regression Channel BODaily time frame;
Regression Channel breakout Indicates Change in trend
Weekly time farmes;
Bullish Kicker candlestick signals reversal from the yellow support line, which was drawn from two prior tops (Oct'21 & Nov'22), which provided support as projected
Way forward,
1. Resistance, 19600
2. Support, 19200-19250

#TATACHEMICALS bullish kicker pro gap
#TATACHEMICALS bullish kicker pro gap with good volumes on daily hit the previous resistance zone.Earlier weekly momentum bullish divergence met target levels and a bearish momentum divergence could be potential concern for being cautiously bullish if it breaks out further .

Techmahindra : bullish kicker pro gap breakoutTechmahindra : bullish kicker pro gap breakout along with a W patter breakout seen on charts
