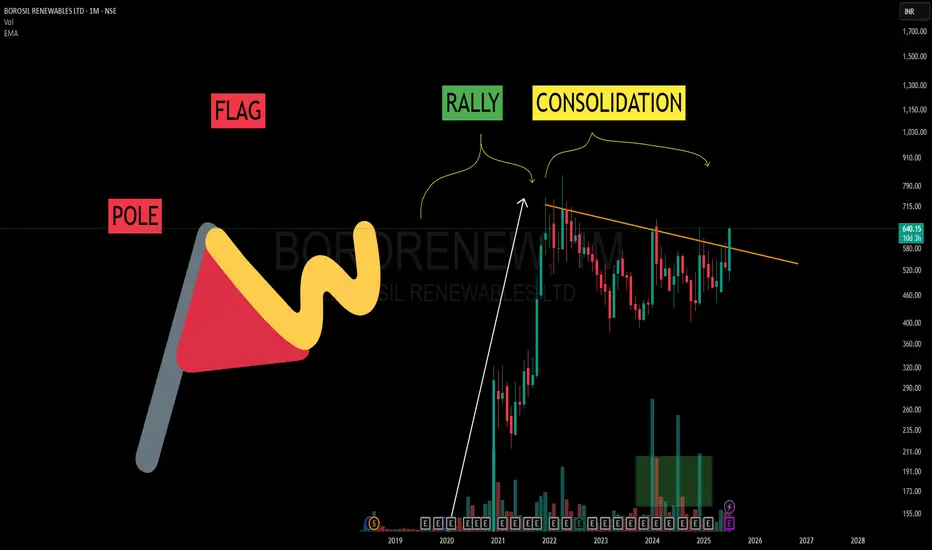
Flag, Pole and Patience– Learning from the Bigger TimeframeIn trading, patterns on higher timeframes often carry deeper meaning.
What you’re seeing in this chart isn’t a forecast — it’s a learning opportunity.
Let’s break this down:
🔺 POLE:
This sharp rally from 2020–2022 represents a strong burst of momentum. That’s your Pole — it shows clean directional intent from market participants.
🏁 FLAG:
After the rally, price didn’t crash — it started consolidating. This sideways or slightly downward structure is known as the Flag.
It often appears as a phase of “cooling off” — traders taking profits, new buyers waiting.
📈 RALLY + CONSOLIDATION = Classic Flag & Pole
A rally followed by consolidation = textbook flag structure.
⏳ And here’s the takeaway:
When viewed on a Monthly (WTF - Way Too Far 😅) timeframe, these patterns take years to form. But that also means they carry weight.
No predictions here. Just learning.
Understanding market rhythm through structure > outcome can be your edge.
Bullishpattern
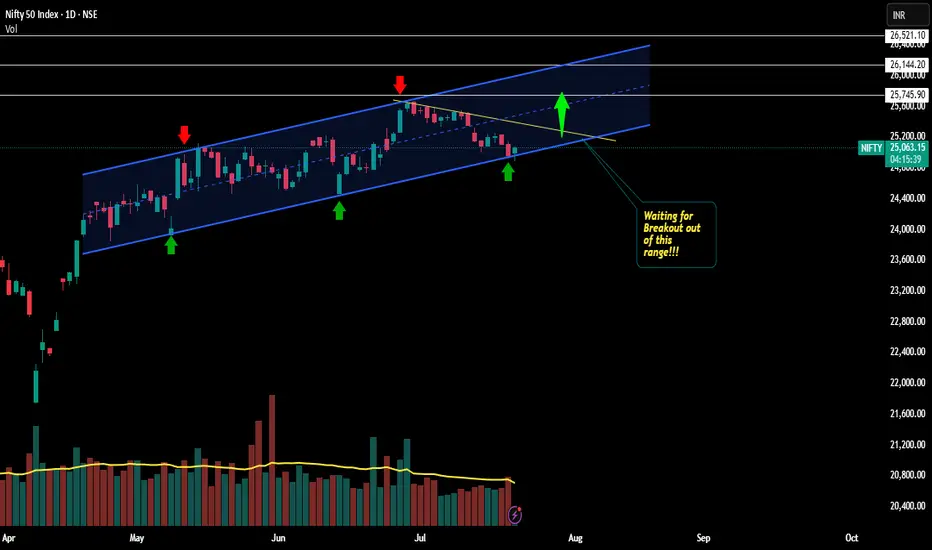
Nifty inside a Parallel channel !!!Yesssss!!!
Chart patterns depict me to go with the above titled view
Nothing much to explain here... .Nifty has been travelling in a parallel channel making higher highs and higher lows
Right now, its is at the bottom support of the parallel channel getting ready for the next leg of upmove...
If this holds good, it may break ATH!!!
Let's wait and watch!!!!
Target levels mentioned as white lines ,Day candle closing out of the channel welcomes bears into play.
We can wait for the 2 HR/DAILY breakout out of the yellow trendline and make our entry and setting SL at the low of the Breakout candle....
will update once it breaks out!!!
This is just my view...not a tip nor advice!!!
Thank you!!!
Dixon Price ActionDixon Technologies' latest share price is ₹15,960 as of July 18, 2025. The stock recently declined about 0.92% from its previous close of ₹16,107, though it has gained over 11% in the past month. It remains range-bound between strong support near ₹15,300 and resistance around ₹16,000 to ₹16,100. The stock holds a bullish weekly MACD crossover signal that historically has led to an average 11.62% price gain within seven weeks.
Technically, the price is above key short- and medium-term moving averages, indicating an overall positive trend, but it faces immediate resistance near ₹16,100–₹16,200 which must be cleared for further upside. On the downside, the critical support level lies near ₹15,300. With a PE ratio near 88 and a robust return on equity of over 36%, the company shows strong fundamentals. The upcoming quarterly results meeting on July 22, 2025, will be closely watched by investors for confirmation of growth momentum.
In summary, Dixon Technologies is consolidating near current levels after recent gains, supported by strong fundamentals and sector tailwinds. A decisive breakout above resistance could lead to new highs, while failure to hold support may invite short-term weakness.

Syngene International Price Action## Current Price and Trend Overview
- The stock is currently trading near ₹657, having pulled back considerably from its 52-week high close to ₹961, but still above the 52-week low around ₹600.
- Price movement has been mixed, with recent gains of about 2% over the last week but a decline of nearly 10% in the past three months. Over six months, the stock is down close to 20%. The longer-term gain (three-year basis) is about 5%.
- The stock remains within a broad horizontal range, with prices fluctuating between about ₹600 and ₹735 in recent months. Price volatility is moderate.
## Technical and Market Structure
- A short-term bounce occurred from a May low, but overall momentum remains sideways. Both short- and long-term moving averages are generally positive, offering some technical support.
- Key support levels are seen at ₹645–₹650, with stronger support near ₹600. Immediate resistance is around ₹670–₹680; a break above could indicate further upward momentum.
## Valuation and Financial Perspective
- The price-to-earnings (P/E) ratio is in the mid-50s, relatively high for the sector, signaling a premium valuation.
- Price-to-book (P/B) value is above 5, suggesting the company trades at more than five times its book value.
- Market capitalization is about ₹26,500 crore, making Syngene a significant but not leading player in its industry.
- Return on equity is modest at around 12%, and dividend payout remains low relative to profits.
## Recent Performance Factors
- Promoter holding is stable, which is generally regarded as a sign of confidence.
- The latest quarterly earnings showed a minor upside surprise, with earnings per share coming slightly above market expectations.
- Revenue is expected to show a steady uptrend in the coming quarters, but overall growth rates have moderated compared to earlier years.
## Outlook and Sentiment
- The prevailing sentiment is cautious, with the stock recently upgraded by some analysts from “Hold” to “Buy Candidate,” based largely on improved moving average signals and a rare technical “Golden Star” event that often precedes positive moves.
- Option chain analysis indicates a wide range, reflecting indecision among market participants.
- Analysts’ 12-month price targets generally center around ₹712, with a bullish scenario up to ₹825 and a downside floor near ₹570.
## Summary
- Syngene International’s share price is consolidating with no clear breakout, but several technical and fundamental factors are turning slightly positive.
- Upside potential exists if key resistance levels are crossed, while failure to hold current support could lead to further downside.
- The stock remains in focus for longer-term investors looking for stable growth in the contract research and biopharma segment, though near-term trading is likely to remain range-bound unless a new catalyst emerges.

Dhani Price Action## Current Price & Trend
- The latest trading price is approximately ₹65, significantly below its 52-week high near ₹110 and well above its 52-week low of about ₹47.
- The stock has seen a meaningful recovery off its lows, gaining over 40% from the bottom, but remains down nearly 40% from its recent peak.
- In the last month, momentum has turned negative with a price decline of more than 7%, and the past week also shows a small drop.
- Over a three-month window, there was a modest gain, but performance over the past six months remains negative with a double-digit decline.
## Financial Performance & Valuation
- The company recently returned to modest profitability after a streak of quarters with losses, posting small but consecutive net profits in recent reports.
- Revenue rebounded in the latest quarter after earlier declines, showing signs of business recovery.
- Key valuation indicators remain weak: the price-to-earnings ratio is currently negative, reflecting cumulative prior losses, and price-to-book is around 1.4, a typical range for this peer group.
- Market capitalization is about ₹4,000 crore, which gives the stock a mid-tier standing within the financial sector.
- Return on equity remains negative, highlighting continued pressure on core profitability.
## Ownership & Sentiment
- Promoter shareholding has been steady, and there was a recent increase in foreign institutional investor interest, while retail participation declined slightly.
- Market sentiment appears tentative, with recent trading volume and price moves reflecting cautious investor attitudes.
## Strengths & Risks
- The return to profitability in recent quarters is a promising sign, especially as revenues are stabilizing.
- However, the company’s long-term performance record has been mixed, with prior years marked by substantial losses and depressed cash flows.
- The current valuation in relation to earnings and book value suggests the market is waiting for clearer signs of sustainable growth.
- The share price remains highly sensitive to quarterly results and shifts in sector confidence.
## Outlook
- The medium-term trend is neutral to mildly negative, with no immediate catalysts for a breakout.
- Upside potential exists if the company can deliver consistent profits and further revenue growth.
- Investors should monitor for continued turnaround in earnings, while being alert to the possibility of renewed volatility given the stock’s historical swings.
DLong

Buy Mankind Pharma for 15% short term Mankind Pharma
Take entry Near 2600Rs
Target will be 3055( almost 16% upside)
Invest more at 2477
Mankind look likes very bullish
Double bottom pattern perform on up trendline.

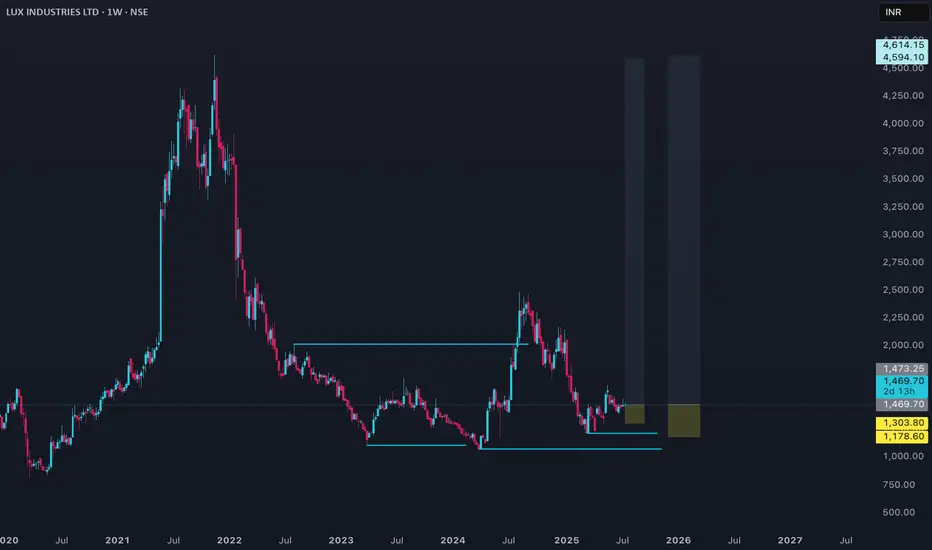
LUXIND Price Analysis## Current Price & Recent Performance
- The latest share price is around ₹1,468.
- Over the past year, the stock is down nearly 25%, showing underperformance.
- In the last five years, returns are positive but modest, with periods of pronounced volatility.
- The 52-week range spans from a low near ₹1,211 to a high close to ₹2,493, highlighting large swings in price.
- Short-term momentum remains soft, with one-month and three-month returns relatively flat.
## Valuation & Financial Metrics
- LUXIND is currently valued at a price-to-earnings ratio close to 27, which is above broader market averages but not extreme for its sector.
- The price-to-book ratio sits at about 2.5, marking a premium to historical levels for textile manufacturers.
- Debt is low, and the latest dividend yield is minimal, suggesting the company retains most profits for growth.
- Price-to-sales and enterprise value-to-EBITDA ratios point to average to modestly expensive relative valuation.
- Discounted cash flow analysis and fair value models indicate the stock is somewhat overvalued at current prices.
## Growth, Profitability & Fundamentals
- Revenue growth has averaged approximately 10% annually in recent years with some acceleration recently observed.
- Earnings trends have been inconsistent, with a decline over the past five years but a robust rebound in the latest reporting periods.
- Net profit margins remain steady, roughly 6%, and operating expense control is demonstrated by low interest and employee cost ratios.
- Return on equity is below 10%, which is modest and signals room for efficiency improvement.
## Market Sentiment & Analyst View
- Most short- and medium-term forecasts suggest neutral to mildly positive technical momentum, with occasional buy signals from technical models.
- Longer-term analyst price targets vary, but consensus expects limited upside in the near future given current valuation levels.
- Projected earnings per share and revenue growth remain solid, with the company expected to improve performance metrics over the next few years.
- Intrinsic value estimates based on fundamental analysis suggest the stock trades above its calculated fair value, raising some caution for new investors.
## Key Takeaways
- LUXIND stands out for disciplined cost management and stable margins, but faces pressure from subdued industry growth and relatively high valuation metrics.
- While the business remains fundamentally sound and growth is projected to continue, the stock may be fully priced at current levels.
- Short-term price action could stay range-bound unless there is a significant change in sector sentiment or a positive surprise in earnings.
- Investors may consider waiting for a more attractive entry point if focusing on value, while growth-oriented investors might monitor for signals of a sustained earnings recovery.
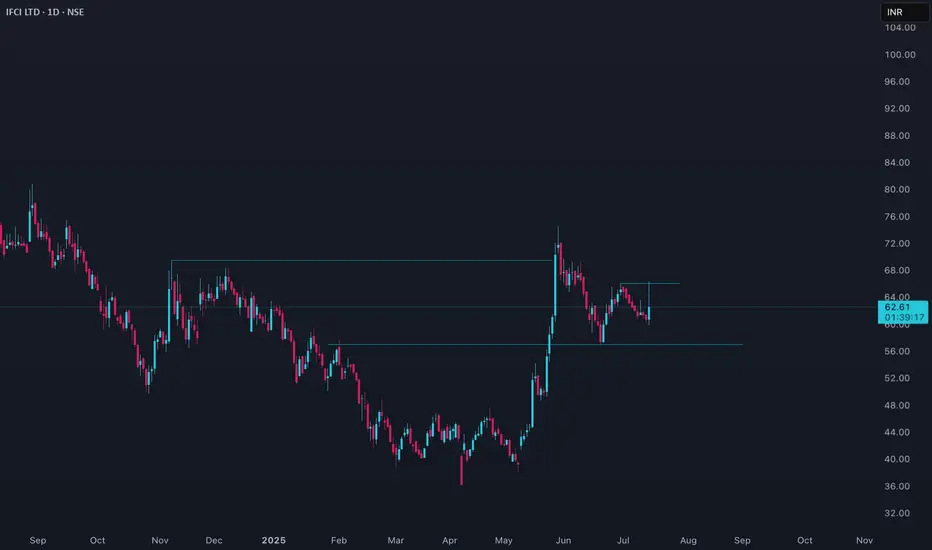
IFCI Price Action## Trend Overview
IFCI has shown significant volatility in recent months. After a strong rally earlier in the year, the stock has entered a corrective phase, with the price currently hovering around ₹60.58–₹64.50 as of July 14, 2025. The broader trend over the past year has been negative, but the last quarter displayed a sharp upward move, followed by some consolidation and profit booking.
## Price Action & Momentum
- **Short-Term:** The stock is consolidating after a steep rise in the last three months, where it gained nearly 49%. The recent pullback reflects profit-taking and market caution.
- **Medium-Term:** Despite the recent correction, the price remains above major moving averages, indicating that the medium-term uptrend is still intact.
- **Long-Term:** IFCI is down about 12% over the past year, but up over 534% in three years, highlighting its high volatility and cyclical nature.
## Technical Indicators
- **Moving Averages:** The daily price is above its 50-day and 200-day moving averages, supporting a positive medium-term outlook. Shorter-term averages are converging, suggesting a pause or consolidation.
- **Relative Strength Index (RSI):** The RSI is in the overbought zone, indicating potential for further cooling or sideways movement before the next trend emerges.
- **MACD:** The MACD indicator is positive, but momentum has slowed, suggesting the rally may be losing steam.
- **Volatility:** The stock displays high volatility, with a beta above 2, indicating larger swings compared to the broader market.
## Support and Resistance
- **Immediate Support:** Around ₹60, where recent buying interest has emerged.
- **Major Support:** Near ₹55, which aligns with the 50-day moving average and a previous breakout zone.
- **Immediate Resistance:** Near ₹65, which coincides with recent swing highs.
- **Major Resistance:** The 52-week high at ₹91.40.
## Volume and Sentiment
- Recent sessions have seen increased volume on down days, reflecting profit booking and cautious sentiment.
- Long-term sentiment remains speculative, with traders reacting quickly to momentum shifts and news.
## Summary
IFCI remains a high-beta, volatile stock with a history of sharp rallies and deep corrections. The current daily chart shows consolidation after a strong uptrend, with the price holding above key supports. As long as the stock remains above its 50-day moving average, the medium-term bullish structure is intact. However, the overbought technical indicators and recent profit-taking suggest that short-term movements may remain range-bound or slightly negative until a clear breakout or breakdown occurs. Risk management is crucial given the elevated volatility.
Bank Nifty Price Action# BANKNIFTY Hourly Chart Price Analysis
## Overview
On the hourly chart, BANKNIFTY is exhibiting a cautious and volatile structure, with technical indicators suggesting a mix of short-term weakness and potential for intraday momentum. The index is trading near key support and resistance levels, and traders are closely watching for breakouts or breakdowns to determine the next directional move.
- **Above 57,070:** Intraday bullish momentum is likely.
- **Below 56,900:** Weakness and potential downside may emerge.
- **Holding above 55,750:** Maintains a positive undertone for the broader trend.
## Technical Indicators
- **Moving Averages:** Most short-term and medium-term moving averages are signaling a bearish bias, with prices trading below the 5, 10, 20, and 50-period averages.
- **RSI (Relative Strength Index):** Hovering in the neutral to slightly bearish zone, indicating lack of strong momentum but not yet oversold.
- **MACD:** Shows bearish crossover, supporting the short-term negative bias.
- **Stochastic Oscillator:** Indicates overbought conditions on some timeframes, cautioning against aggressive long positions.
- **ATR (Average True Range):** High, reflecting elevated volatility and potential for sharp intraday swings.
## Price Action Insights
- The index recently broke below a short-term ascending pattern, increasing the risk of further declines if support levels are breached.
- Intraday trading is expected to remain volatile, with sharp moves likely around key pivot levels.
- Sentiment is cautious due to global factors and domestic flows, but the downside is cushioned by institutional buying on dips.
## Trading Outlook
- **Bullish Scenario:** Sustained move above 57,070 with strong volume could open up targets towards 57,300 and 57,500.
- **Bearish Scenario:** Failure to hold above 56,900 may see the index test 56,500 and lower supports.
- **Neutral/Bounce Play:** Sideways consolidation is possible if the index holds between 56,900 and 57,070, with traders advised to wait for a clear breakout.
**Note:** High volatility and mixed signals call for disciplined risk management and quick decision-making on intraday trades.

NDRAUTO Price Action#### Current Price and Performance
- **NDR Auto Components** is trading near ₹1,050–₹1,100 as of July 9, 2025, after a recent pullback from its all-time high of ₹1,191 set earlier in the month.
- The stock has delivered an exceptional one-year return of over 135%, with a three-month gain of more than 70%.
- Recent price action shows high volatility, with swings of 7–11% on certain days and a short-term correction of about 8% in the past week.
- Over the past month, the stock is down about 2–3%, reflecting some profit booking after a rapid rally.
#### Trend and Technical Overview
- The medium-term trend remains positive, supported by robust earnings growth and strong momentum.
- Technical indicators suggest the stock is consolidating after reaching overbought levels, with support seen near ₹1,000 and resistance around ₹1,150.
- The stock’s volatility is elevated, and its beta is above 2, indicating higher sensitivity to market movements.
#### Valuation and Financial Metrics
- NDRAUTO trades at a premium, with a price-to-book ratio above 8 and a price-to-earnings multiple reflecting high growth expectations.
- The company’s market capitalization is approximately ₹2,500 crore.
- Return on equity (ROE) is strong, around 19–23%, and return on capital employed (ROCE) is above 20%.
- Net profit for FY25 rose nearly 38% year-on-year to over ₹53 crore, with revenue up 18% to about ₹713 crore.
- Operating margins have improved to nearly 11%, and earnings per share (EPS) for the year is above ₹22.
- The dividend yield is modest at 0.26%, with a payout ratio around 12%.
#### Market Sentiment and Outlook
- Market sentiment remains positive, with the company consistently reporting record profits and sales.
- Analysts highlight the company’s efficient operations, strong order book, and improving profitability.
- The recent correction is seen as a healthy consolidation after a sharp rally, though further volatility is likely in the short term.
- The long-term outlook is favorable, supported by ongoing growth in the auto components sector and the company’s expanding market share.
#### Summary
NDRAUTO has delivered outstanding returns over the past year, driven by robust financial performance and strong sector momentum. The stock is currently consolidating after hitting record highs and remains highly volatile. While valuations are elevated, the company’s growth trajectory and operational efficiency support a positive outlook for medium- to long-term investors. Short-term caution is warranted due to recent volatility and profit booking.

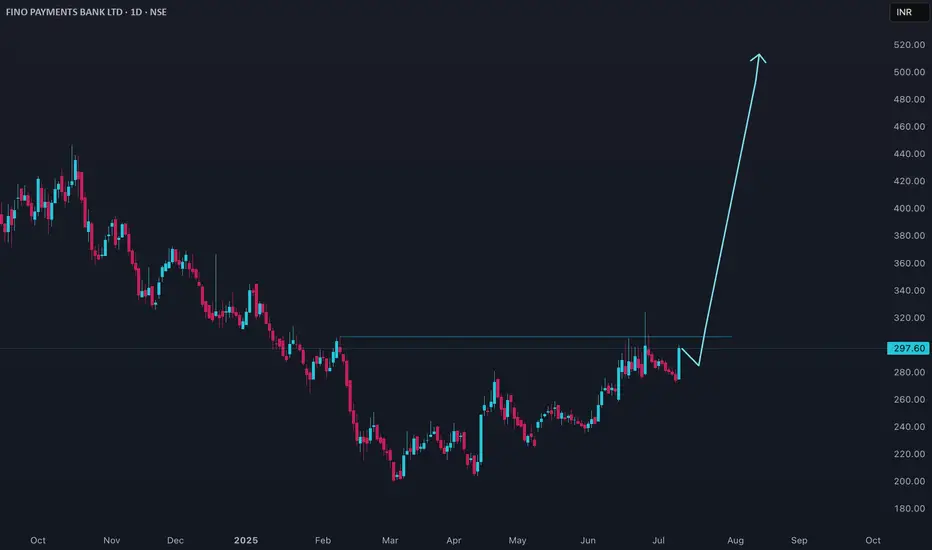
FINOPB Price Action#### Current Price and Performance
- **Fino Payments Bank (FINOPB)** is trading around ₹274–₹278 as of July 8–9, 2025.
- The stock has seen a recent high of ₹300 and a low of ₹274.95 in the latest trading sessions.
- Over the past month, the price has declined from the ₹286–₹290 range, with a notable drop from its 52-week high of ₹467.
- The 52-week low stands at ₹200, highlighting significant volatility in the past year.
#### Trend and Technical Overview
- The short-term trend is **negative**, with the stock slipping about 4% over the past week and nearly 7% in the last month.
- Volumes are robust, with daily trading often exceeding 1.5 million shares, indicating high market participation and speculative interest.
- The stock is currently trading closer to its lower circuit limit than its upper circuit, reflecting bearish sentiment.
#### Valuation and Financial Metrics
- FINOPB is priced at a **low price-to-earnings (P/E) and price-to-book (P/B) ratio**, though exact values are not meaningful due to inconsistent profitability.
- The trailing twelve-month (TTM) earnings per share (EPS) is positive and has grown 7.3% year-on-year.
- The market capitalization is around ₹2,477 crore.
- Dividend yield is 0%, and the company has not announced any dividends recently.
#### Market Sentiment and Outlook
- Sentiment is cautious, with the stock underperforming the sector and broader indices in 2025.
- The price action reflects ongoing concerns about growth visibility and profitability, despite some improvement in recent quarters.
- The stock is viewed as a high-risk, high-volatility play, with traders dominating activity rather than long-term investors.
#### Summary
FINOPB is in a corrective phase, trading near the lower end of its yearly range after a sharp decline from its highs. While trading volumes are high and EPS has shown some growth, the lack of dividends and inconsistent profitability weigh on sentiment. Investors should remain cautious, as the stock’s volatility and weak trend suggest further downside risk unless there is a clear improvement in fundamentals.
### JYOTISTRUC Price Analysis#### Current Price and Performance
- Jyoti Structures Ltd is trading at approximately **₹17.59** as of July 8, 2025.
- The stock has experienced high volatility in recent weeks, with daily swings of 2–5% being common.
- Over the past month, the price has generally trended downward from the ₹19–₹20 range, with multiple sessions closing in the red.
- The 52-week high is near ₹22, and the low is just above ₹15, indicating a wide trading range and active speculative interest.
#### Trend and Technical Overview
- The short-term trend is **negative**, with the stock declining about 10% over the last two weeks.
- Daily volumes remain elevated, suggesting ongoing trader participation but also reflecting uncertainty and rapid profit booking.
- The stock has failed to sustain above key resistance levels near ₹18.50–₹19.00, and support is now seen around ₹17.00.
#### Valuation and Financial Metrics
- Jyoti Structures is a small-cap company in the capital goods sector, and its financials remain under pressure, with limited earnings visibility.
- The company has a history of restructuring and remains sensitive to sector news, which adds to price volatility.
- Valuation multiples are not meaningful at this stage due to inconsistent profitability.
#### Market Sentiment and Outlook
- Sentiment is cautious, with traders focusing on short-term momentum rather than long-term fundamentals.
- The stock’s recent decline and inability to hold higher levels suggest that risk remains elevated.
- Any sustained recovery will likely depend on improvement in financial results or sector-specific positive developments.
#### Summary
JYOTISTRUC is currently in a corrective phase, marked by high volatility and weak short-term momentum. While trading interest is strong, the lack of earnings clarity and recent price declines point to ongoing risk. Investors should approach with caution, focusing on technical support levels and monitoring for signs of fundamental improvement.

GRSE Price Action
#### Current Price and Performance
- **GRSE** is trading near ₹2,965–₹2,974 as of July 9, 2025, after a recent dip from its 52-week high of ₹3,538.
- Over the past year, the stock has delivered a return of approximately 9%, with a sharp rally in the past three to six months (up about 81–84% during that period).
- The stock has shown high volatility, with a notable correction of nearly 13% in the last month and a 4.5% decline in the last week.
#### Trend and Technical Overview
- **Medium-term trend** remains positive, supported by strong order inflows and robust financials, but the recent correction suggests some profit booking and consolidation after a rapid upmove.
- Technical indicators reflect heightened volatility, with the stock pulling back from overbought levels.
- The stock is trading at a high price-to-earnings (P/E) ratio of about 64 and at 16 times its book value, indicating premium valuation.
#### Valuation and Financial Metrics
- **Market capitalization** is around ₹34,000 crore.
- **Return on equity (ROE)** stands at 28%, and **return on capital employed (ROCE)** is 37%, both indicating efficient use of capital.
- **Dividend yield** is modest, around 0.3–0.5%.
- The company is nearly debt-free and has delivered strong profit growth (CAGR of 26% over five years).
- Revenue and profit have grown significantly, with FY25 revenue at ₹5,076 crore and net profit at ₹527 crore.
- Operating margins have improved to 8%, and the company maintains a healthy dividend payout ratio of about 30%.
#### Market Sentiment and Outlook
- Sentiment remains positive, given GRSE’s strategic role in defense shipbuilding and a strong order book.
- Analysts highlight the company’s consistent financial performance and leadership in its sector, though caution is advised due to high valuation multiples.
- The recent correction may offer a better entry point, but further consolidation or volatility is possible in the short term.
#### Summary
GRSE has delivered strong medium-term returns, underpinned by robust financials, sector leadership, and efficient capital management. The stock is currently consolidating after a sharp rally and is trading at premium valuations. While the long-term outlook remains positive, investors should be mindful of recent volatility and elevated price multiples when considering new positions.

FLOKI UPSIDE MOVE COMINGBINANCE:FLOKIUSDT
It's making a cup & Handle pattern and a breakout from that pattern, too
Now, once it comes inside the range, the upside move is unbeatable
Keep this in you watchlist

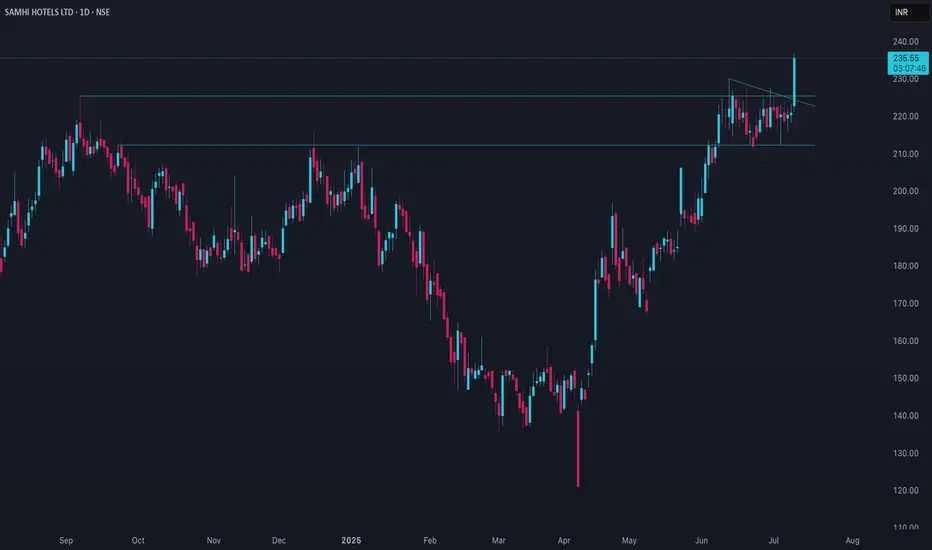
SAMHI Price action#### Current Price and Performance
- SAMHI Hotels is trading around ₹220–₹221 as of early July 2025.
- The stock has moved between a 52-week high of approximately ₹238 and a low near ₹121.
- Over the past year, the stock has delivered a return of about 15–16%, with a moderate uptrend since its listing.
- Short-term price action has been stable, with minor fluctuations and a slight upward bias in recent weeks.
#### Trend and Technical Overview
- The medium-term trend is positive, supported by strong operational results and improving financials.
- Technical indicators show a bullish outlook, with moving averages and MACD supporting upward momentum, though some caution is advised due to a slightly overbought RSI.
- The stock has shown resilience even during broader market volatility, outperforming major indices over the past year.
#### Valuation and Financial Metrics
- SAMHI has reported a significant turnaround, moving from losses to profitability in FY25.
- Revenue for FY25 rose to over ₹1,130 crore, with operating profit margins improving to nearly 36%.
- Net profit margin has increased sharply, and earnings per share turned positive after several years of losses.
- The company’s debt profile has improved, with a lower net debt-to-EBITDA ratio, and strong institutional holdings support the valuation.
- The stock is considered expensive on some valuation metrics, reflecting high growth expectations.
#### Market Sentiment and Outlook
- Analyst sentiment is generally positive, with target prices suggesting potential upside of 25–30% from current levels.
- The company’s robust order book, successful strategic partnerships, and expansion into high-demand markets are seen as key growth drivers.
- Risks include high valuation multiples and execution challenges in a competitive hospitality sector.
- The long-term outlook remains favorable, with expectations of continued revenue and profit growth as the company leverages its portfolio and operational strengths.
#### Summary
SAMHI Hotels has demonstrated a strong recovery, transitioning to profitability and delivering robust revenue growth. The stock has outperformed the broader market and is supported by positive analyst sentiment and institutional interest. While valuations are high, the company’s improving fundamentals and growth prospects make it attractive for investors with a medium- to long-term horizon. Caution is warranted in the short term due to potential volatility, but the overall trajectory remains positive.
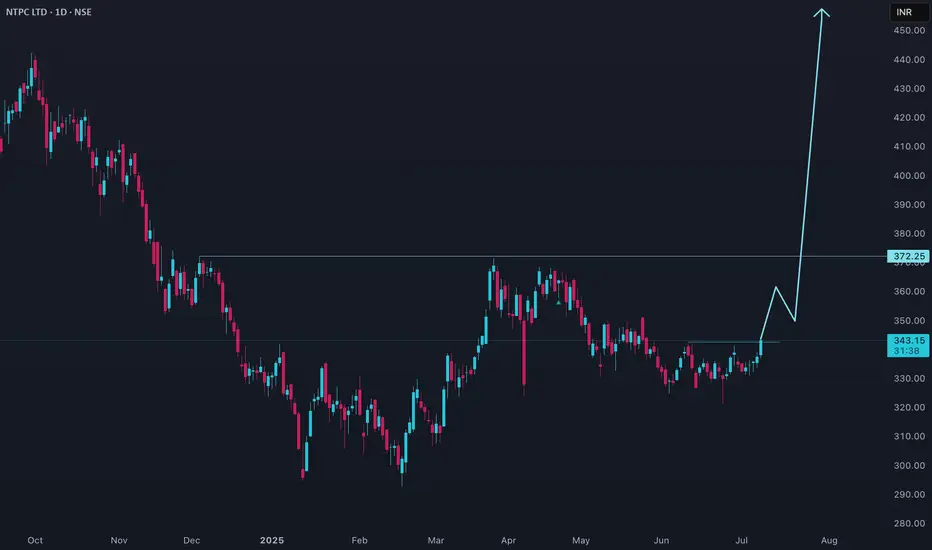
NTPC price action### NTPC Price Analysis
#### Current Price and Performance
- NTPC is trading in the ₹370–₹380 range as of early July 2025.
- The stock has achieved a 52-week high near ₹390 and a low around ₹200, reflecting a strong upward trend over the past year.
- Year-to-date, NTPC has delivered a return of over 60%, with particularly strong momentum in the last six months.
- Short-term price action shows some consolidation after a sharp rally, with minor fluctuations in the past few weeks.
#### Trend and Technical Overview
- The medium-term trend remains bullish, supported by robust earnings, capacity expansion, and favorable sector dynamics.
- Technical indicators suggest the stock is in overbought territory, with some analysts expecting a pause or correction before the next leg up.
- NTPC’s beta is below 1, indicating lower volatility compared to the broader market.
#### Valuation and Financial Metrics
- NTPC trades at a moderate price-to-earnings (P/E) ratio, below many private sector peers, making it relatively attractive from a valuation perspective.
- The price-to-book (P/B) ratio is reasonable, reflecting the company’s stable asset base.
- Dividend yield is above 3%, appealing to income-focused investors.
- The company maintains a strong balance sheet, steady cash flows, and a history of consistent dividend payouts.
#### Market Sentiment and Outlook
- Market sentiment is positive, with analysts maintaining a buy or accumulate stance for long-term investors.
- The company’s focus on renewable energy and capacity addition is seen as a key growth driver.
- While the stock may experience short-term consolidation, the long-term outlook remains favorable due to NTPC’s dominant position in the power sector and ongoing expansion plans.
#### Summary
NTPC has delivered impressive returns over the past year, driven by strong fundamentals and sector tailwinds. The stock is currently consolidating after a significant rally, but its valuation, dividend profile, and growth prospects make it attractive for investors with a medium- to long-term horizon. Caution is warranted in the short term due to potential profit booking, but the overall outlook remains positive.
Looks bullish on coming daysRedington , broken its tight consolidation with good volume and 8.4% move. It looks positive for coming days. Stock could give 10-20% in very short duration.
200% + RVOL shows buyers interest.
Weekly if we see, this stock came out of channel structure and giving good upmove with volume push.
Stay connected for commentary for coming days
Disclaimer:
The information provided herein is for educational and informational purposes only and should not be construed as investment advice. The stock analysis and recommendations are based on publicly available information, data sources believed to be reliable, and our interpretation at the time of writing.
Investing in equities involves risks, including the risk of loss of capital. Past performance is not indicative of future results. Readers and investors are advised to conduct their own research or consult a qualified financial advisor before making any investment decisions.
The author(s), affiliates, or associated entities may hold positions in the stocks mentioned, and such positions are subject to change without notice.
We do not guarantee the accuracy, completeness, or timeliness of any information presented, and we disclaim any liability for financial losses or damages resulting from the use of this content.

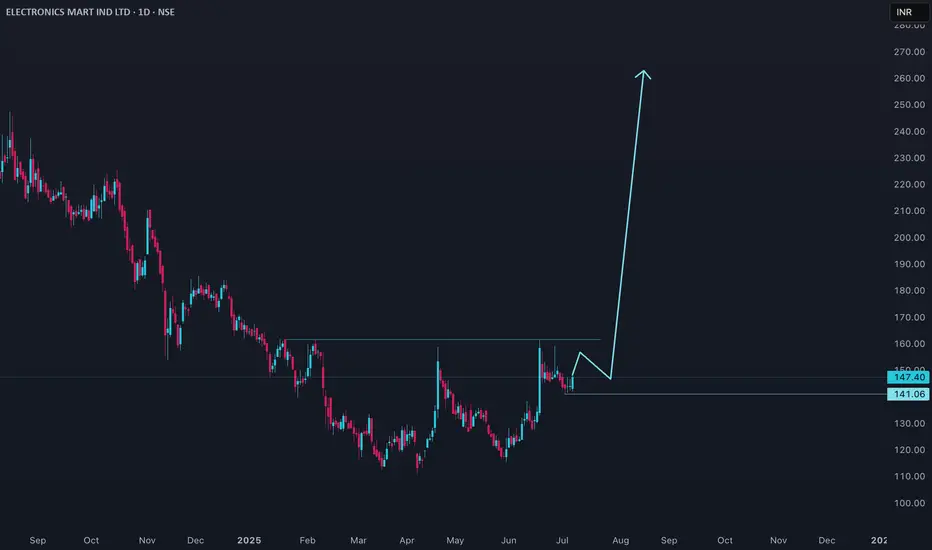
### EMIL Price AnalysisElectronics Mart India Ltd (EMIL) recently closed at around ₹144, showing a modest uptick after a period of volatility. The stock has rebounded sharply over the past month, gaining over 16%, yet it remains well below its 52-week high of ₹262. The past year has been challenging, with the share price down more than 35%, underperforming both its sector and the broader market.
Technically, EMIL is trading above key short-term moving averages, suggesting a short-term uptrend. The price is above the 20-day and 50-day averages, but still below the long-term 200-day average, indicating that while momentum has improved, the broader trend remains cautious. The stock’s volatility is notably high, with weekly price swings above the market average.
Momentum indicators like MACD and RSI are showing positive signals, but there are early signs of momentum loss, and volume-based indicators suggest some recent selling pressure. The stock is currently near a resistance zone, and a sustained move above ₹150 could trigger further upside, while support is seen around ₹138.
Fundamentally, EMIL has demonstrated steady revenue and profit growth over the last few years, but recent quarters have shown a decline in profitability. The company’s price-to-earnings ratio is on the higher side, suggesting it is not undervalued relative to its earnings. Analyst forecasts indicate moderate growth potential, with a one-year price target in the ₹160–₹190 range.
In summary, EMIL is showing signs of a short-term recovery with improving technicals, but long-term investors should remain cautious given its recent underperformance and valuation concerns. A clear breakout above resistance levels would strengthen the bullish case, while failure to hold above support could lead to renewed weakness.
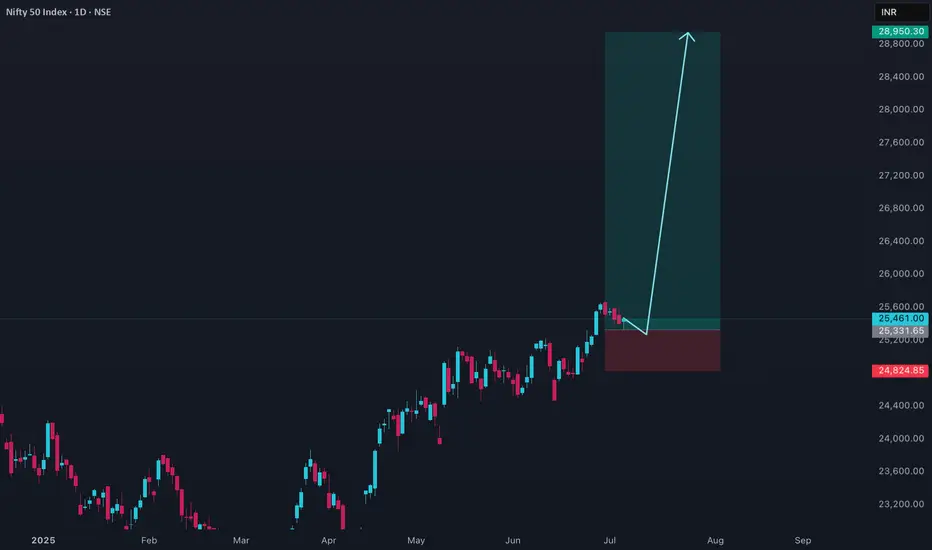
Nifty price actionNifty 50 closed at 25,461 with a modest gain, reflecting cautious optimism after recent profit booking and volatility. The index formed a bullish hammer candlestick, which is often interpreted as a sign of potential short-term reversal or support. Buying interest in heavyweight stocks like Bajaj Finance, Infosys, Dr. Reddy’s, ICICI Bank, and Wipro helped offset declines in sectors such as metals and auto.
Technically, Nifty found support near its near-term EMA trendline, and the RSI remains healthy in the low 60s, suggesting the trend is still neutral to positive. Immediate support levels are at 25,240 and 25,103, while resistance is seen at 25,682 and 25,819. Sustained trading above 25,682 could trigger further upside, possibly toward 26,000, but a break below 25,240 would increase the risk of a deeper correction, with 25,000 and 24,500 as the next key supports.
Market sentiment remains cautiously optimistic, with advances outnumbering declines. However, overbought oscillators and low ADX readings indicate limited momentum, so the index may remain rangebound unless a clear breakout or breakdown occurs. Traders are advised to watch for a decisive move above 25,600 for bullish confirmation, or below 25,240 for signs of renewed weakness.
Banknifty price actionBank Nifty closed at 57,031.9 on July 4, 2025, up 0.42%, showing resilience after a brief dip earlier in the week. The index has been consolidating near all-time highs, maintaining a bullish structure with higher highs and higher lows on the daily chart. Despite some profit booking, Bank Nifty remains above its key moving averages, and technical indicators like RSI and MACD continue to support the broader uptrend.
Short-term support is seen around 56,500–56,600, which aligns with the 20-day EMA. As long as Bank Nifty holds above this zone, the bias remains positive and the index could attempt to move towards resistance levels at 57,540 and 57,854. A decisive close above 57,800 would likely open the path to 58,500. However, overbought oscillators and a weak ADX suggest the trend strength is moderate and the market could remain rangebound unless a breakout occurs.
Constituent performance has been mixed, with ICICI Bank, AU Bank, HDFC Bank, and Axis Bank contributing to gains, while Bank of Baroda, IndusInd Bank, and Federal Bank saw mild declines. Overall, the structure favors a buy-on-dips approach as long as the index stays above its immediate support. A close below 56,500 would be the first sign of a deeper correction.

JK Paper LTD (Long View)Breakout Pick
>Supporting Trendline Coming
>Downward Trendline Breakout
> Price Above EMA 200
> Retest Level -380-388
Upside Level (POSSIBLITIES)
-427
-490
-523
Till Then, Keep Following Markets

INDIA GLYCOLS LTD (SHORT TERM LONG )Price has given a con consolidated breakout
invalid level - 1850 DCB
UPSIDE FIB 1.2 - 2100
TLL THEN STAY FOCUSED

TRANSRAIL LIGHTING (BREAKOUT)ATH Breakout
Point To Note
- Price Breakout Above Key ATH Resistance
- Supporting Upward Trendline
Wait For Retest
Next Possible Resistance
-759
-802
-854
Till Then Stay Focused, Keep Following Markets
