Bulish Breakout in HUBTOWNIn upcomming Few Days we ll see a bulish breakout in HUBTOWN
as price is going to retrace the level then it will break the level 136.6 and there is a possible upcomming move in HUBTOWN
Bullishpattern

FORCEMOT Price action **Force Motors (FORCEMOT) Price Analysis – April 21, 2025**
**Current Price:** ₹9,229
**Trend:** Strong uptrend, up 40% in the past three months.
**Support:** ₹8,700–₹8,900
**Resistance:** ₹9,270 (previously ₹10,272, the 52-week high).
**Outlook:** Bullish above ₹9,000. A breakout above ₹9,270 could potentially retest the 52-week high.
**Summary:** The momentum is strong, and the trend remains positive unless the price falls below ₹8,700.

Samvardhana Motherson BreakoutMOTHERSON Stock Analysis
MOTHERSON stock is breaking out again on the monthly chart after previously reaching a new all-time high and then declining. It recently broke the trend-line with good buying pressure. The target could be the all-time high or lower, but it may take a few months to reach if things go well. Stop-loss should be set based on individual risk appetite.
Index Inclusion : Part of NIFTY NEXT 50 and NIFTY 100 indices, indicating significant market presence.
Financial Highlights:
- Revenue Growth : Consistent increase over recent quarters, reaching Rs 113,662 crore in Mar 2025.
- Net Profit : Also rising, with Rs 3,618 crore in Mar 2025.
- EPS : Improved to Rs 5.50 in Mar 2025.
- Annual Revenue & Profit : Steady growth over the past five years, with revenue surpassing Rs 113,662 crore and net profit over Rs 3,618 crore in 2025.
Financial Performance:
- Profit Margins : Net profit margin around 3.18% in Mar 2025.
- Valuations : P/E ratio at approximately 23.81, indicating moderate valuation.
- Debt Levels : Debt-to-equity ratio at 0.42, reflecting manageable debt.
- Cash Flow & Balance Sheet : Operating cash flow remains strong; assets and liabilities Show growth aligned with revenue expansion.
These financial insights are sourced from Moneycontrol.
Conclusion :
Motherson International shows a consistent growth in revenue and profits, with stable financial ratios and manageable debt levels. Its inclusion in major indices and recent financial performance suggest it remains a significant player in its sector. However, the recent stock decline indicates market caution, so investors should monitor market sentiment closely.
This is for educational purposes only and not a buy or sell recommendation.

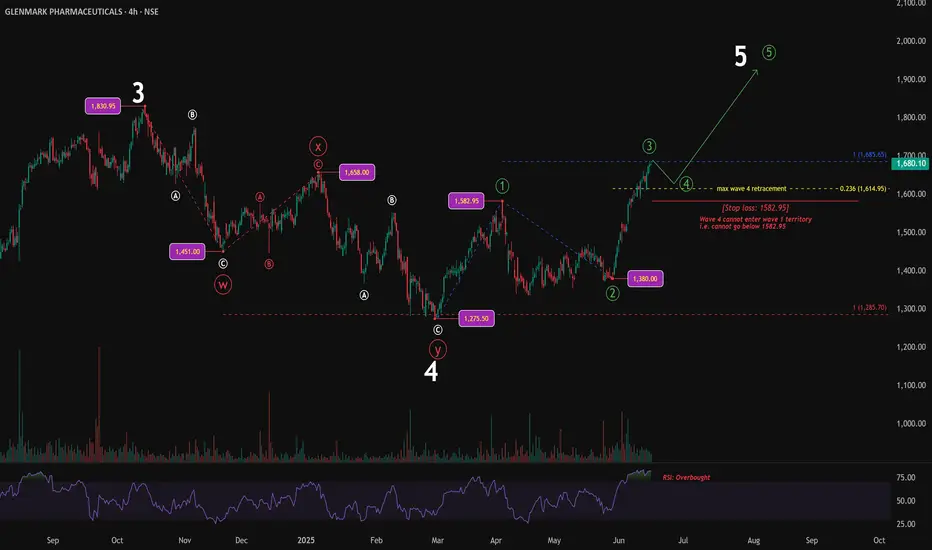
Wave 3 Completes, All Eyes on 1582.95After completing a W-X-Y corrective structure, price has started moving higher in what appears to be a new impulse wave. Within this sequence, Wave 3 seems to have topped at 1685.65, which is 100% of Wave 1 measured from the Wave 2 low — a common relationship in impulse extensions.
Wave 1 had ended at 1582.95, and Wave 2 retraced deeply to 1380, falling beyond the 0.618 Fibonacci level. As per the rule of alternation, since Wave 2 was deep, Wave 4 is expected to be shallow. A possible support zone lies near the 0.236 retracement level at 1614.95.
For the structure to remain valid, Wave 4 must stay above the Wave 1 high. If price breaks below 1582.95, it would invalidate the current impulse count and suggest that this may not be Wave 5.
RSI reached the overbought zone during the final part of Wave 3, which supports the idea of a pullback unfolding. As long as price respects the invalidation level, the setup remains intact and points toward a potential Wave 5 advance.
The chart will be updated as price action evolves.
Disclaimer: This analysis is for educational purposes only and does not constitute investment advice. Please do your own research (DYOR) before making any trading decisions.
NEWGEN Price Action**NEWGEN (Newgen Software Technologies) Price Analysis – June 2025**
**Current Price & Trend**
- Latest price: Around ₹1,148 as of June 16, 2025.
- The stock has recently shown a mildly bearish technical trend, with daily moving averages and the monthly MACD indicating caution.
- Short-term signals (as of early June) are bearish, with a 5-day EMA crossover and stochastic crossover suggesting further downside. Historically, such signals have led to average declines of 3–11% over the following days and weeks.
**Technical Indicators**
- Most short-term moving averages are giving sell signals, and several oscillators (Stochastic, CCI, Williams %R) are in oversold territory.
- RSI is neutral, and the MACD is mixed (bullish weekly, bearish monthly).
- Pivot points suggest support near ₹922–₹928 and resistance around ₹931–₹936.
**Fundamentals**
- FY25 net profit: ₹315 crore (+20.5% YoY); revenue: ₹1,487 crore (+19.5% YoY), driven by strong growth in APAC and US markets.
- The company is almost debt-free and has delivered 34% CAGR profit growth over five years.
- Return on equity (ROE) is strong at 23%, and ROCE is 28.6%.
- Dividend yield is 0.44%.
- The stock is considered overvalued, trading at a P/E of 51.6 and nearly 11 times book value.
**Other Points**
- Promoter holding has slightly decreased in the last quarter.
- Working capital days have increased, which could affect cash flows.
**Summary**
NEWGEN is fundamentally strong, with robust profit and revenue growth, high ROE, and almost no debt. However, the stock is currently overvalued and showing mildly bearish technical signals in the short term. Investors should be cautious at current levels and watch for a technical reversal or improved valuations before considering fresh entries.

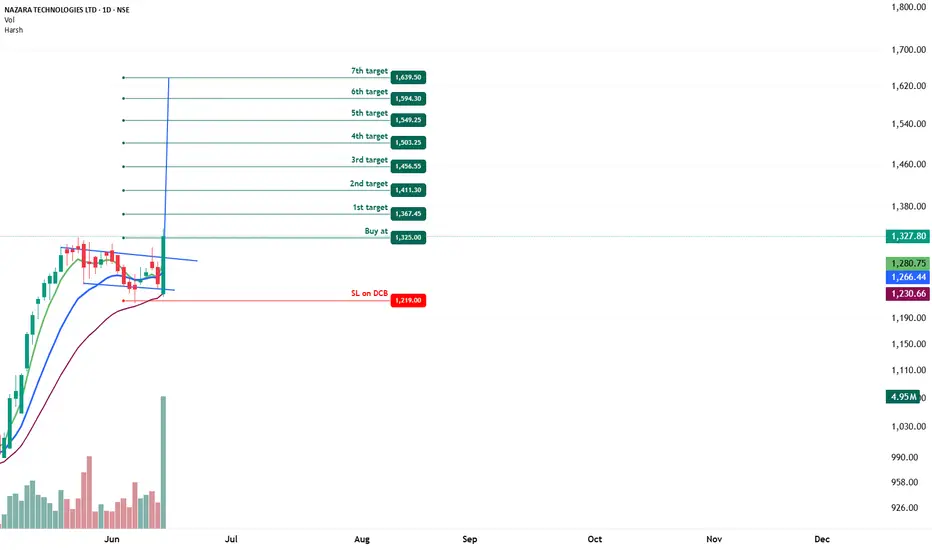
NAZARA TECHNOLOGIES - Bullish Flag & Pole Breakout (Daily T/F)Trade Setup
📌 Stock: ( NSE:NAZARA )
📌 Trend: Strong Bullish Momentum
📌 Risk-Reward Ratio: 1:3 (Favorable)
🎯 Entry Zone: ₹1325.00 (Breakout Confirmation)
🛑 Stop Loss: ₹1219.00 (Daily Closing Basis) (-12 % Risk)
🎯 Target Levels:
₹1367.45
₹1411.30
₹1456.55
₹1503.25
₹1549.25
₹1594.30
₹1639.50 (Final Target)
Technical Rationale
✅ Bullish Flag & Pole Breakout - Classic bullish pattern confirming uptrend continuation
✅ Strong Momentum - Daily RSI > 60, Weekly RSI >60 mONTHLY rsi ABOVE 60
✅ Volume Confirmation - Breakout volume 4.95M vs previous day's 946.53K (Nearly 4.5x surge)
✅ Multi-Timeframe Alignment - Daily and weekly charts showing strength
Key Observations
• The breakout comes with significantly higher volume, validating strength
• Well-defined pattern with clear price & volume breakout
• Conservative stop loss at recent swing low
Trade Management Strategy
• Consider partial profit booking at each target level
• Move stop loss to breakeven after Target 1 is achieved
• Trail stop loss to protect profits as price progresses
Disclaimer ⚠️
This analysis is strictly for educational purposes and should not be construed as financial advice. Trading in equities involves substantial risk of capital loss. Past performance is not indicative of future results. Always conduct your own research, consider your risk appetite, and consult a financial advisor before making any investment decisions. The author assumes no responsibility for any trading outcomes based on this information.
What do you think? Are you watching NSE:NAZARA for this breakout opportunity? Share your views in the comments!
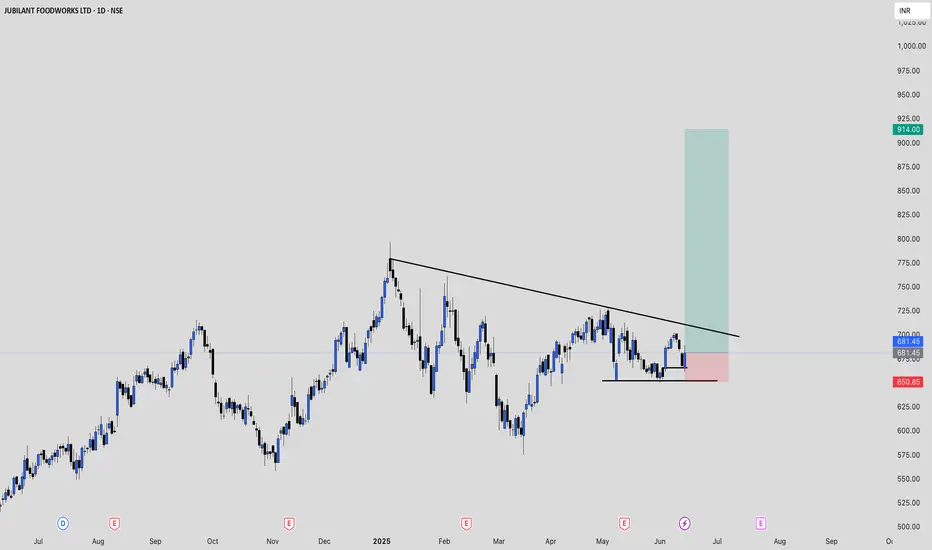
JUBLFOOD price actionJUBLFOOD (Jubilant Foodworks) is currently trading at ₹681.45 as of June 13, 2025, up 2% for the day. Over the past year, the stock has gained about 26.5%, though it remains roughly 14% below its 52-week high of ₹796.75 and about 30% above its 52-week low of ₹522.25.
Technically, the stock is showing mixed signals. The RSI is neutral around 49.5, while MACD and ADX are giving sell signals. However, most short-term moving averages (except the 5 and 50-day) are showing buy signals, and the price is currently above the VWAP, indicating some short-term strength. The Stochastic RSI is in the overbought zone, suggesting caution.
Fundamentally, JUBLFOOD is trading at a high P/E of 197, which points to an expensive valuation. Its book value is ₹31.9, with the stock trading at over 21 times book value. The dividend yield is low at 0.18%, and the average ROE over three years is moderate at 13.8%. The company remains a leader in the quick-service restaurant sector in India, holding franchise rights for Domino’s, Dunkin’ Donuts, and Popeyes.
Analysts have a wide range of price targets, from as low as ₹516 to as high as ₹1,000. While the company’s fundamentals are strong, the high valuation and mixed technicals suggest investors should be cautious. The short-term trend is up, but further upside will depend on sustained buying and a breakout above resistance levels.
JUBILANT INGREVIA (LONG)Price has given a long tern consolidated range breakout with multiple cofluences
Point to look at -
- All Ema Lined Up (Bullish)
- High Volume Spurt
-14-15 % Move Possiblity
- Big Bar Candle Breakout
Retest Level - 756-760 Area
Upside Level - 870
Invalid Below -690 CB
Till Then, Stay Focused, Keep Following Markets

Glenmark Pharma for Big profitTake entry at 1468Rs
Strong SL of 1426 Rs
Target will be 1774
We will have almost 3% SL and 20% of terget so it will be best deal acc to risk rewards ratio.
Counter is ready to give its downtrendline breakout and we will make entry at 1426 because it will be its retest level.....

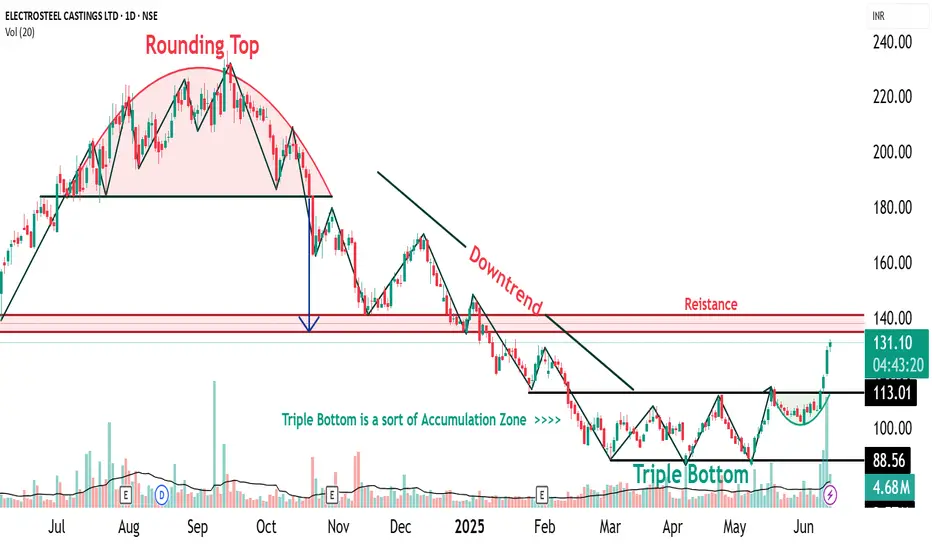
ELECTCAST Triple Bottom Pattern🔍 1. Understanding the Triple Bottom
The Triple Bottom is a classic bullish reversal pattern that typically forms after a prolonged downtrend or consolidation phase. It signifies strong buying interest at a consistent support level, leading to three distinct price lows (or “bottoms”) occurring near the same price zone.
📌 Key Characteristics:
Formation Time: Typically spans 2–6 months
Touchpoints: Three distinct lows formed at or near the same support level
Pattern Zone (for ELECTCAST): ₹87 – ₹88
Trade Entry: Entry is typically considered on a breakout above the neckline, which is the horizontal resistance connecting the interim highs between the bottoms. In this case, a breakout confirmation would be around ₹96.
Stop Loss (SL): Just below the third bottom, e.g., ₹85
Target: Based on pattern depth projection, conservative ₹104, aggressive potential up to ₹120–₹140, once momentum sustains
📉 2. Triple Bottom Formed at ₹87–₹88 Zone
Electrosteel Castings has tested the ₹87–₹88 level three times, showing that this price zone has acted as a strong accumulation support. The repeated defense of this level suggests significant buying interest by institutional players or informed investors.
1st Bottom: Initial rejection near ₹88
2nd Bottom: Retest with similar rejection zone
3rd Bottom: Confluence with bullish reversal candlestick (Morning Star)
The pattern is visually symmetric and clean, enhancing its reliability.
At the third bottom near ₹87, a Morning Star was observed, marking the first visual confirmation of bullish reversal. This adds significant strength to the pattern because the third bottom often acts as a psychological pivot point, triggering buying from traders watching for a reversal.
📈 3. Higher Top – Higher Bottom Structure Emerging
Following the Morning Star, the stock has started forming a higher bottom and higher top structure—a fundamental trait of an uptrend. However:
🟡 Caution: One more higher bottom formation is required to confirm the start of a sustainable uptrend.
Once the uptrend is firmly established, a close above ₹140 will act as a major breakout signal, potentially propelling the price toward new 52-week highs or an all-time peak.
🧠 4. Accumulation Zone and Triple Bottom – The Relationship
An Accumulation Zone is a price range where informed investors quietly accumulate shares over a period, usually when a stock is undervalued or consolidating.
🔗 Connection to Triple Bottom:
The Triple Bottom pattern often forms within the Accumulation Zone
Each dip to the support level attracts buyers, revealing hidden demand
The formation acts as a transition from accumulation to markup phase
The breakout from the Triple Bottom signals the end of accumulation and the start of an uptrend
Hence, the Triple Bottom is not just a technical pattern, but a visual representation of accumulation dynamics playing out.
📝 Disclaimer
This report is intended purely for educational and training purposes. It is not a recommendation to buy or sell securities. Always conduct your own research or consult a certified financial advisor before making trading decisions.
SWIGGY LTD – Breakout & Retest Confirmation on Daily Chart Note : This is only a chart analysis and for study purposes. Not a recommendation to buy or sell.
Chart Analysis Summary:
Breakout Zone:
The stock has clearly broken above a descending trendline that acted as resistance for several months. The breakout was supported by a strong bullish candle with notable volume, indicating genuine buying interest.
Volume:
The breakout candle shows a volume spike, validating the move. Volume continues to remain stable post-breakout, supporting the sustainability of the trend.
Retest Confirmation:
After the breakout, SWIGGY came back to retest the breakout zone (~345-350) and formed a bullish reversal, confirming the support zone.
Current Price Action:
Price is now moving higher again, suggesting the end of the retest phase and a potential beginning of a fresh uptrend.
EMA Analysis:
Price is trading above the 20/50/100/200 EMA cluster (currently near 339.25), which was earlier acting as a dynamic resistance and now may serve as support.
MACD:
MACD crossover above the signal line is visible and trending upward – a bullish momentum signal.
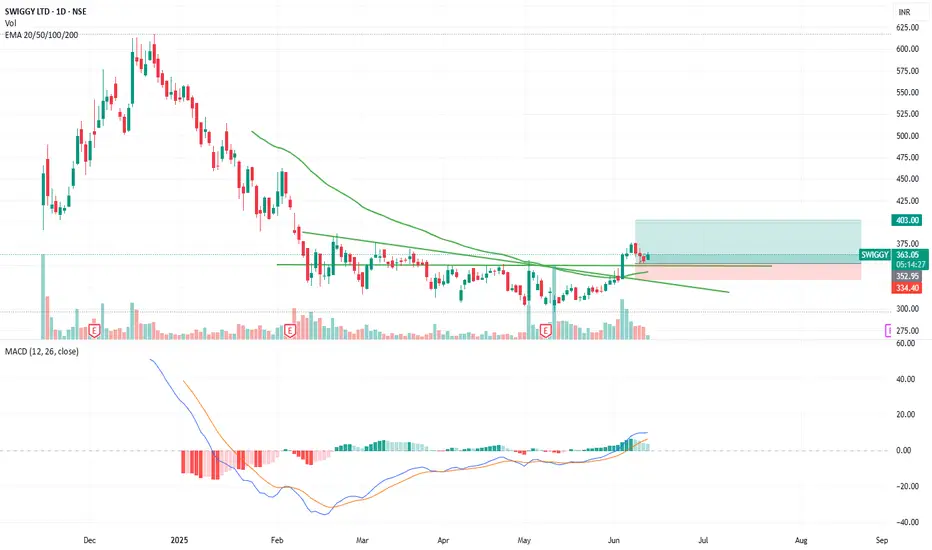
Chart Study for CoalIndiaChart Pattern
Ascending Triangle Formation:
The price is forming higher lows, indicating buyer strength.
Resistance is near the ₹412–₹414 zone, with multiple rejections in this region.
A breakout above this level could lead to a strong upward move.
Indicators
RSI (Relative Strength Index):
Value: ~57.18 → Neutral to slightly bullish.
No overbought condition yet (over 70 is overbought), so upside room remains.
MACD (Moving Average Convergence Divergence):
Blue MACD line is slightly above the signal line → Bullish crossover.
Histogram is flat to slightly positive.
Wait for confirmed breakout (candle close above resistance with good volume).
Avoid early entries unless using tight risk management.
For Study Only
No positions implied or advised.
Good example of a textbook triangle, RSI-MACD convergence, and pre-breakout structure.
Can be used to learn:
How to draw support/resistance
Use of volume + indicators
Pattern breakout anticipation and validation

SIEMENS LTD - Bullish Flag & Pole Breakout (Daily T/F)Trade Setup
📌 Stock: SIEMENS LTD ( NSE:SIEMENS )
📌 Trend: Strong Bullish Momentum
📌 Risk-Reward Ratio: 1:3 (Favorable)
🎯 Entry Zone: ₹3383.00 (Breakout Confirmation)
🛑 Stop Loss: ₹3208.00 (Daily Closing Basis) (-5 % Risk)
🎯 Target Levels:
₹3484.50
₹3589.10
₹3696.80
₹3807.70
₹3922.00 (Final Target)
Technical Rationale
✅ Bullish Flag & Pole Breakout - Classic bullish pattern confirming uptrend continuation
✅ Strong Momentum - Daily RSI >69 , Weekly RSI >59 & Monthly RSI >59 (Bullish zone)
✅ Volume Confirmation - Breakout volume 15.52M vs previous day's 4.27M (Nearly 4x surge)
✅ Multi-Timeframe Alignment - Daily and weekly charts showing strength
Key Observations
• The breakout comes with significantly higher volume, validating strength
• Well-defined pattern with clear price & volume breakout
• Conservative stop loss at recent swing low
Trade Management Strategy
• Consider partial profit booking at each target level
• Move stop loss to breakeven after Target 1 is achieved
• Trail stop loss to protect profits as price progresses
Disclaimer ⚠️
This analysis is strictly for educational purposes and should not be construed as financial advice. Trading in equities involves substantial risk of capital loss. Past performance is not indicative of future results. Always conduct your own research, consider your risk appetite, and consult a financial advisor before making any investment decisions. The author assumes no responsibility for any trading outcomes based on this information.
What do you think? Are you watching NSE:SIEMENS for this breakout opportunity? Share your views in the comments!

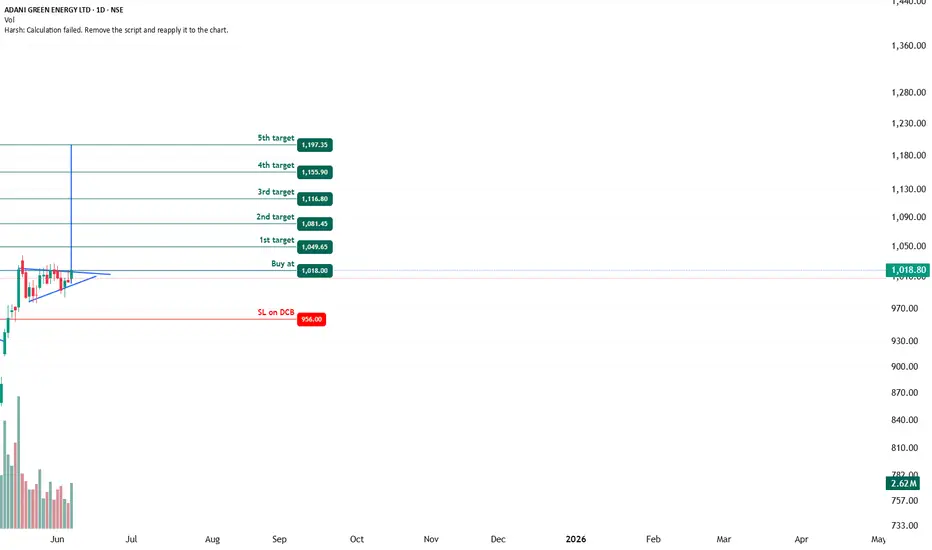
ADANI GREEN ENERGY - Bullish Flag & Pole Breakout (Daily T/F)Trade Setup
📌 Stock: ADANI GREEN ENERGY ( NSE:ADANIGREEN )
📌 Trend: Strong Bullish Momentum
📌 Risk-Reward Ratio: 1:3 (Favorable)
🎯 Entry Zone: ₹1018.00 (Breakout Confirmation)
🛑 Stop Loss: ₹956.00 (Daily Closing Basis) (-6 % Risk)
🎯 Target Levels:
₹1049.65
₹1081.45
₹1116.80
₹1155.90
₹1197.35 (Final Target)
Technical Rationale
✅ Bullish Flag & Pole Breakout - Classic bullish pattern confirming uptrend continuation
✅ Strong Momentum - Daily & Weekly RSI >60 (Bullish zone)
✅ Volume Confirmation - Breakout volume 2.62M vs previous day's 1.4M (Nearly 2x surge)
✅ Multi-Timeframe Alignment - Daily and weekly charts showing strength
Key Observations
• The breakout comes with significantly higher volume, validating strength
• Well-defined pattern with clear price & volume breakout
• Conservative stop loss at recent swing low
Trade Management Strategy
• Consider partial profit booking at each target level
• Move stop loss to breakeven after Target 1 is achieved
• Trail stop loss to protect profits as price progresses
Disclaimer ⚠️
This analysis is strictly for educational purposes and should not be construed as financial advice. Trading in equities involves substantial risk of capital loss. Past performance is not indicative of future results. Always conduct your own research, consider your risk appetite, and consult a financial advisor before making any investment decisions. The author assumes no responsibility for any trading outcomes based on this information.
What do you think? Are you watching NSE:ADANIGREEN for this breakout opportunity? Share your views in the comments!
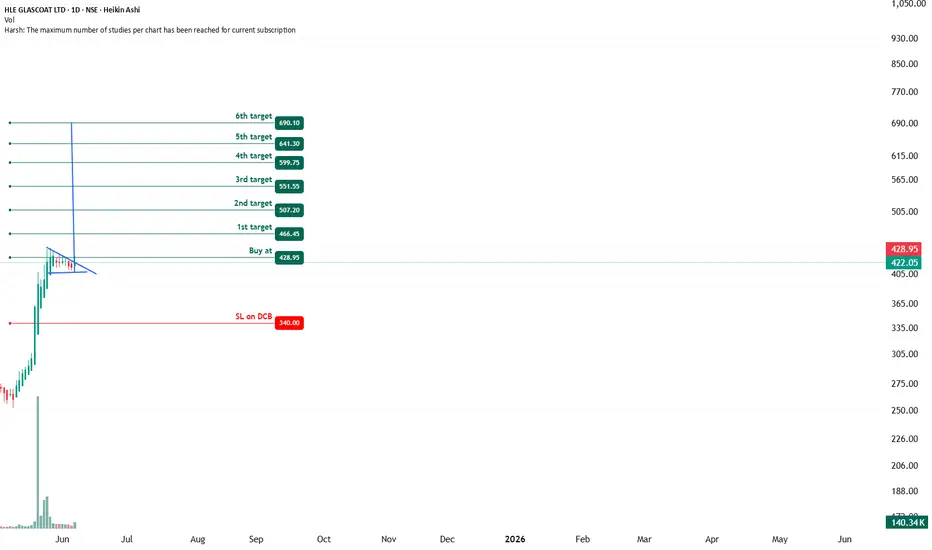
HLW GLASSCOAT - Bullish Flag & Pole Breakout (Daily T/F)Trade Setup
📌 Stock: HLE GLASSCOAT ( NSE:HLEGLAS )
📌 Trend: Strong Bullish Momentum
📌 Risk-Reward Ratio: 1:3 (Favorable)
🎯 Entry Zone: ₹428.95 (Breakout Confirmation)
🛑 Stop Loss: ₹340.00 (Daily Closing Basis) (-20 % Risk)
🎯 Target Levels:
₹466.45
₹507.20
₹551.55
₹599.75
₹641.30
₹690.10 (Final Target)
Technical Rationale
✅ Bullish Flag & Pole Breakout - Classic bullish pattern confirming uptrend continuation
✅ Strong Momentum - Daily & Weekly RSI >60 (Bullish zone)
✅ Volume Confirmation - Breakout volume 140.38K vs previous day's 55.08K (Nearly 3x surge)
✅ Multi-Timeframe Alignment - Daily and weekly charts showing strength
Key Observations
• The breakout comes with significantly higher volume, validating strength
• Well-defined pattern with clear price & volume breakout
• Conservative stop loss at recent swing low
Trade Management Strategy
• Consider partial profit booking at each target level
• Move stop loss to breakeven after Target 1 is achieved
• Trail stop loss to protect profits as price progresses
Disclaimer ⚠️
This analysis is strictly for educational purposes and should not be construed as financial advice. Trading in equities involves substantial risk of capital loss. Past performance is not indicative of future results. Always conduct your own research, consider your risk appetite, and consult a financial advisor before making any investment decisions. The author assumes no responsibility for any trading outcomes based on this information.
What do you think? Are you watching NSE:HLEGLAS for this breakout opportunity? Share your views in the comments!
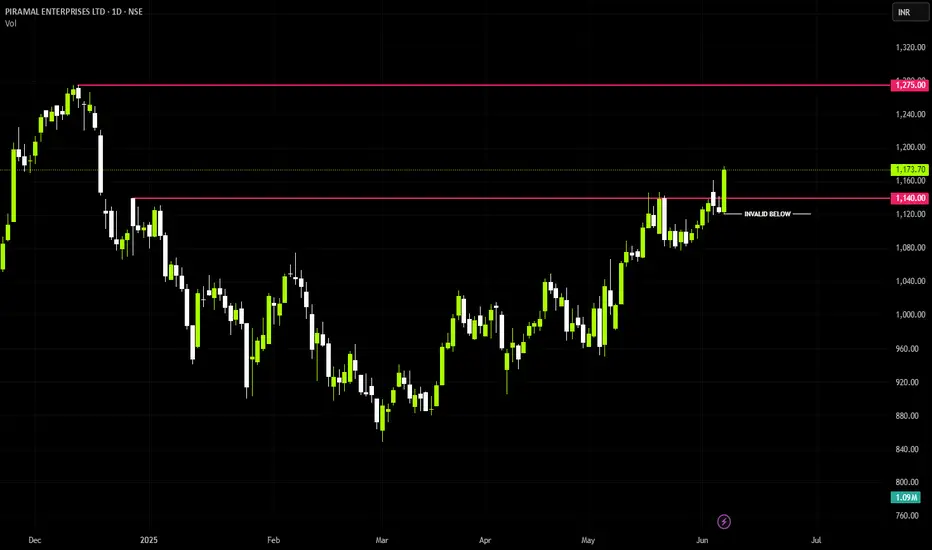
PEL (LONG)Price broke out above key resistance level of 1140 rs
Points Co-Relating
- Break Of Resistance
- Ema-21,50,200 Lined Up Bullish
- Big Bar Breakout
Next Level = 1275
Till Then, Stay Focused
PLong
UTI ASSET MNGMT - Bullish Flag & Pole Breakout (Daily T/F)Trade Setup
📌 Stock: UTI ASSET MNGMT ( NSE:UTIAMC )
📌 Trend: Strong Bullish Momentum
📌 Risk-Reward Ratio: 1:3 (Favorable)
🎯 Entry Zone: ₹1220.45(Breakout Confirmation)
🛑 Stop Loss: ₹1141.00(Daily Closing Basis) (-6.6% Risk)
🎯 Target Levels:
₹1253.75
₹1287.95
₹1323.05
₹1355.50
₹1390.60
₹1424.70
₹1461.60 (Final Target)
Technical Rationale
✅ Bullish Flag & Pole Breakout - Classic bullish pattern confirming uptrend continuation
✅ Strong Momentum - Daily, Weekly & Monthly RSI >60 (Bullish zone)
✅ Volume Confirmation - Breakout volume 754.88K vs previous day's 178.21K (Nearly 4.5x surge)
✅ Multi-Timeframe Alignment - Daily and weekly charts showing strength
Key Observations
• The breakout comes with significantly higher volume, validating strength
• Well-defined pattern with clear price & volume breakout
• Conservative stop loss at recent swing low
Trade Management Strategy
• Consider partial profit booking at each target level
• Move stop loss to breakeven after Target 1 is achieved
• Trail stop loss to protect profits as price progresses
Disclaimer ⚠️
This analysis is strictly for educational purposes and should not be construed as financial advice. Trading in equities involves substantial risk of capital loss. Past performance is not indicative of future results. Always conduct your own research, consider your risk appetite, and consult a financial advisor before making any investment decisions. The author assumes no responsibility for any trading outcomes based on this information.
What do you think? Are you watching NSE:UTIAMC for this breakout opportunity? Share your views in the comments!

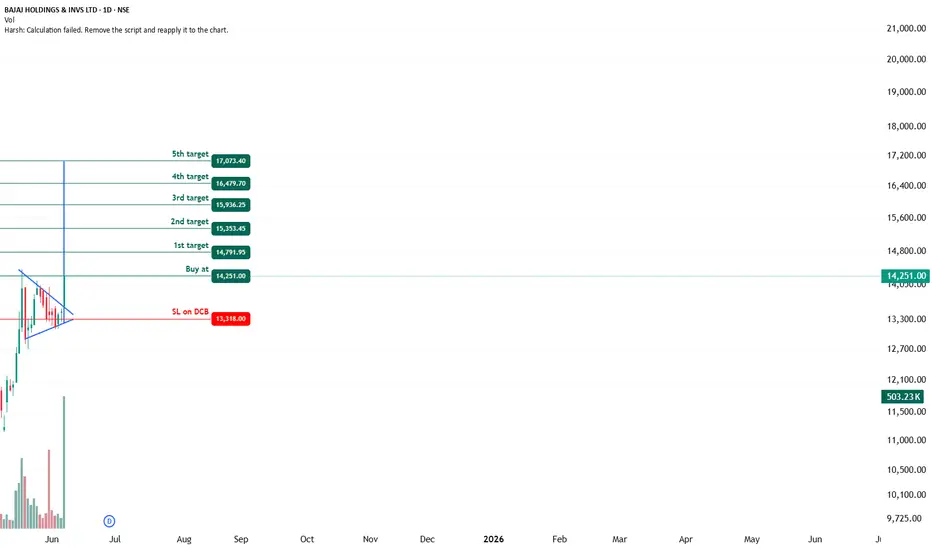
BAJAJ HOLDINGS - Bullish Flag & Pole Breakout (Daily T/F)Trade Setup
📌 Stock: BAJAJ HOLDINGS ( NSE:BAJAJHLDNG )
📌 Trend: Strong Bullish Momentum
📌 Risk-Reward Ratio: 1:3 (Favorable)
🎯 Entry Zone: ₹14251.00 (Breakout Confirmation)
🛑 Stop Loss: ₹13318.00(Daily Closing Basis) (-6.3% Risk)
🎯 Target Levels:
₹14791.95
₹15355.45
₹15936.25
₹16479.70
₹17073.40 (Final Target)
Technical Rationale
✅ Bullish Flag & Pole Breakout - Classic bullish pattern confirming uptrend continuation
✅ Strong Momentum - Daily, Weekly & Monthly RSI >60 (Bullish zone)
✅ Volume Confirmation - Breakout volume 503.23K vs previous day's 39.22K (Nearly 13x surge)
✅ Multi-Timeframe Alignment - Daily and weekly charts showing strength
Key Observations
• The breakout comes with significantly higher volume, validating strength
• Well-defined pattern with clear price & volume breakout
• Conservative stop loss at recent swing low
Trade Management Strategy
• Consider partial profit booking at each target level
• Move stop loss to breakeven after Target 1 is achieved
• Trail stop loss to protect profits as price progresses
Disclaimer ⚠️
This analysis is strictly for educational purposes and should not be construed as financial advice. Trading in equities involves substantial risk of capital loss. Past performance is not indicative of future results. Always conduct your own research, consider your risk appetite, and consult a financial advisor before making any investment decisions. The author assumes no responsibility for any trading outcomes based on this information.
What do you think? Are you watching NSE:BAJAJHLDNG for this breakout opportunity? Share your views in the comments!
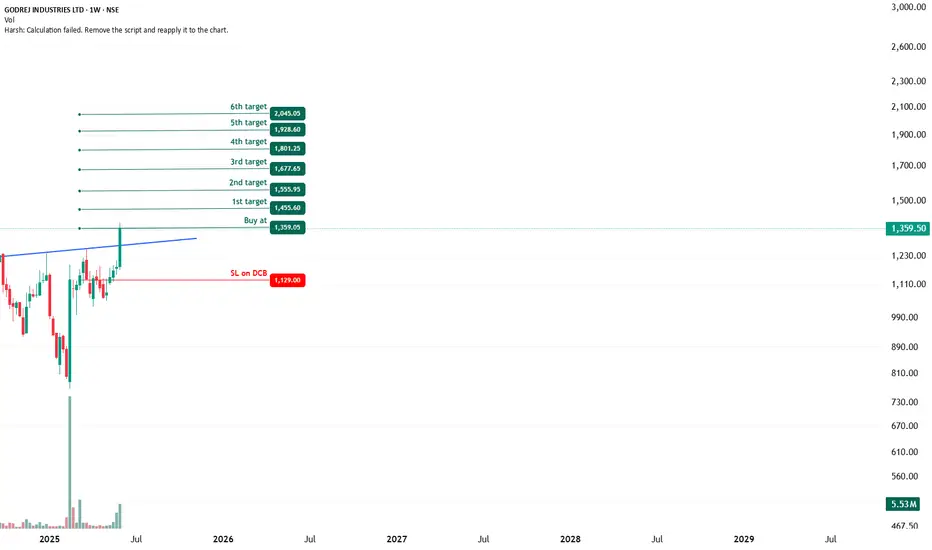
GODREJ INDUSTRIES - Bullish Inverted H&S Breakout (Daily T/F)Trade Setup
📌 Stock: GODREJ INDUSTRIES ( NSE:GODREJIND )
📌 Trend: Strong Bullish Momentum
📌 Risk-Reward Ratio: 1:3 (Favorable)
🎯 Entry Zone: ₹1359.05(Breakout Confirmation)
🛑 Stop Loss: ₹1129.00(Daily Closing Basis) (~5.6% Risk)
🎯 Target Levels:
₹1455.60
₹1555.95
₹1677.65
₹1801.25
₹1928.60
₹2045.05 (Final Target)
Technical Rationale
✅ Bullish Inverted Head & Shoulder Breakout - Classic bullish pattern confirming uptrend continuation
✅ Strong Momentum - Daily, Weekly & Monthly RSI >60 (Bullish Zone)
✅ Volume Confirmation - Breakout volume 5.53M(while posting) vs previous day's 3.46M (Nearly 1.8x surge )
✅ Multi-Timeframe Alignment - Daily, Weekly and €Monthly charts showing strength
Key Observations
• The breakout comes with significantly higher volume, validating strength
• Well-defined pattern with clear price & volume breakout
• Conservative stop loss at recent swing low
Trade Management Strategy
• Consider partial profit booking at each target level
• Move stop loss to breakeven after Target 1 is achieved
• Trail stop loss to protect profits as price progresses
Disclaimer ⚠️
This analysis is strictly for educational purposes and should not be construed as financial advice. Trading in equities involves substantial risk of capital loss. Past performance is not indicative of future results. Always conduct your own research, consider your risk appetite, and consult a financial advisor before making any investment decisions. The author assumes no responsibility for any trading outcomes based on this information.
What do you think? Are you watching NSE:GODREJIND for this breakout opportunity? Share your views in the comments!
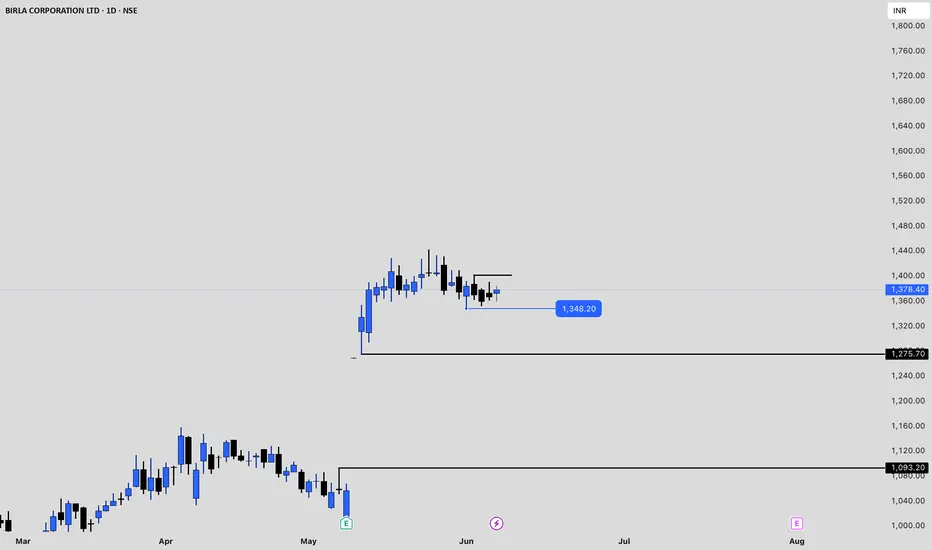
BIRLACORPN Price actionBirla Corporation Ltd (BIRLACORPN) closed at approximately ₹1,385.20 on June 6, 2025, reflecting a 1.65% gain over the previous session . The stock has shown strong recent momentum, rising 31.34% over the past month . However, over the past year, the company’s market capitalization has slightly declined, currently standing at around ₹10,642 crore .
The stock’s 52-week high is ₹1,656.10 (reached on June 27, 2024), and its 52-week low is ₹901.85 (on March 4, 2025), indicating significant volatility within the past year . Birla Corporation’s all-time high is ₹1,801.25, set in February 2024 .
On the financial front, for the quarter ended in 2025, Birla Corporation reported a consolidated profit of ₹256.60 crore on total income of ₹2,863.14 crore. For the year ended 2024, profit stood at ₹420.56 crore on revenue of ₹9,662.72 crore . Despite this, the company’s sales growth has been modest, with a 5.91% increase reported recently .
Analyst sentiment has turned positive following recent quarterly results, with ICICI Securities issuing a ‘Buy’ rating and a target of ₹1,540, citing the stock’s upward momentum after strong Q4 performance .
In summary, Birla Corporation is experiencing a strong short-term rally and has rebounded sharply from its 52-week low. While profitability and revenue remain solid, overall sales growth has been modest. The stock is currently trading closer to the upper end of its yearly range, and analyst outlook is optimistic following its latest results .
ADANIGREEN Price actionAdani Green Energy Ltd (ADANIGREEN) closed at ₹1,009.50 on June 6, 2025. The stock has shown notable volatility in recent months. Over the past month, it gained nearly 10%, and over the last three months, it’s up 18.25%. However, longer-term performance is weaker, with a 6-month decline of 18.38% and a significant 45% drop over the past year .
The stock’s 52-week high is ₹2,091, while the 52-week low is ₹758, indicating substantial price swings. ADANIGREEN trades at a high valuation, with a P/E ratio of 112.77 and a P/B ratio of 7.21, both well above sector averages (sector P/E: 20.60; sector P/B: 3.07), suggesting the stock is priced at a premium .
Operationally, Adani Green has reported robust growth, with revenue expanding at an average annual rate of 38.37% over the last five years, significantly outpacing the industry average. The company continues to expand its renewable energy capacity, targeting 5 gigawatts of new installations this year and aiming for 50 gigawatts by 2030. Despite project delays and regulatory challenges, Adani Green has improved its financial position through cost reductions and refinancing, and it remains well-funded for future growth .
Analyst sentiment is generally positive, with most recommending a ‘buy’ at current levels, citing strong operational performance and growth prospects. However, the high volatility (nearly four times that of the Nifty index) and premium valuation mean the stock carries elevated risk .
In summary, Adani Green Energy is a leader in renewable energy with strong growth and expansion plans, but its stock is highly volatile and currently trades at a substantial premium. Investors should weigh the company’s aggressive growth trajectory and industry leadership against its recent price declines and high valuation multiples.

KEC Price ActionKEC International’s share price as of June 6, 2025, is around ₹889.25, reflecting a 2.16% increase from the previous close. Over the past month, the stock has surged by 28.8%, and it is up 6.83% in the last week, showing strong short-term momentum. However, over the last six months, the stock is down by 26.85%, indicating significant volatility in the medium term .
The company is currently trading at a price-to-earnings (P/E) ratio of 40.6 and a price-to-book (P/B) ratio of 4.33, both of which are considered high compared to the sector average P/E of 28.9. This suggests that the stock is priced at a premium relative to its peers . The dividend yield stands at 0.63% .
KEC International recently secured new orders worth ₹2,211 crore across various segments, including Transmission & Distribution, Oil & Gas Pipelines, and Cables. This has contributed to a 40% year-to-date growth in orders and strengthened its international order book. As a result, analysts maintain a ‘Buy’ rating, with target prices ranging from ₹911 to ₹998, and some suggesting a potential 10% upside from current levels .
Financially, the company’s trailing twelve-month earnings per share (EPS) has grown by 58.95% year-on-year, and the company has a market capitalization of about ₹23,295 crore . The stock hit its 52-week high at ₹1,313.25 and its 52-week low at ₹627.45, highlighting its volatility over the past year .
In summary, KEC International is showing positive short-term momentum, backed by strong order inflows and optimistic analyst ratings. However, its high valuation multiples and recent volatility suggest that investors should approach with some caution, balancing growth prospects against the premium pricing and market fluctuations .

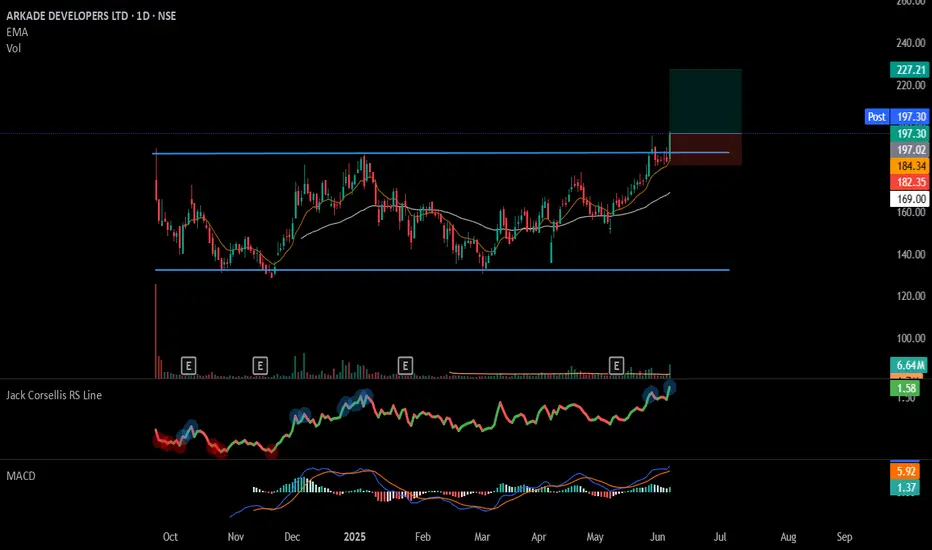
#ARKADE - IPO Base Breakout📊 Script: ARKADE
Key highlights: 💡⚡
📈 IPO Base Breakout in Daily Time Frame.
📈 Price consolidating near Resistance, then Breakout.
📈 Volume spike seen during Breakout.
📈 MACD Cross
📈 Can go for a swing trade
BUY ONLY ABOVE 197 DCB
⏱️ C.M.P 📑💰- 197.34
🟢 Target 🎯🏆 – 14%
⚠️ Stoploss ☠️🚫 – 7%
⚠️ Important: Market conditions are Okish, Position size 50% per Trade. Protect Capital Always
⚠️ Important: Always Exit the trade before any Event.
⚠️ Important: Always maintain your Risk:Reward Ratio as 1:2, with this RR, you only need a 33% win rate to Breakeven.
✅Like and follow to never miss a new idea!✅
Disclaimer: I am not SEBI Registered Advisor. My posts are purely for training and educational purposes.
Eat🍜 Sleep😴 TradingView📈 Repeat 🔁
Happy learning with MMT. Cheers!🥂