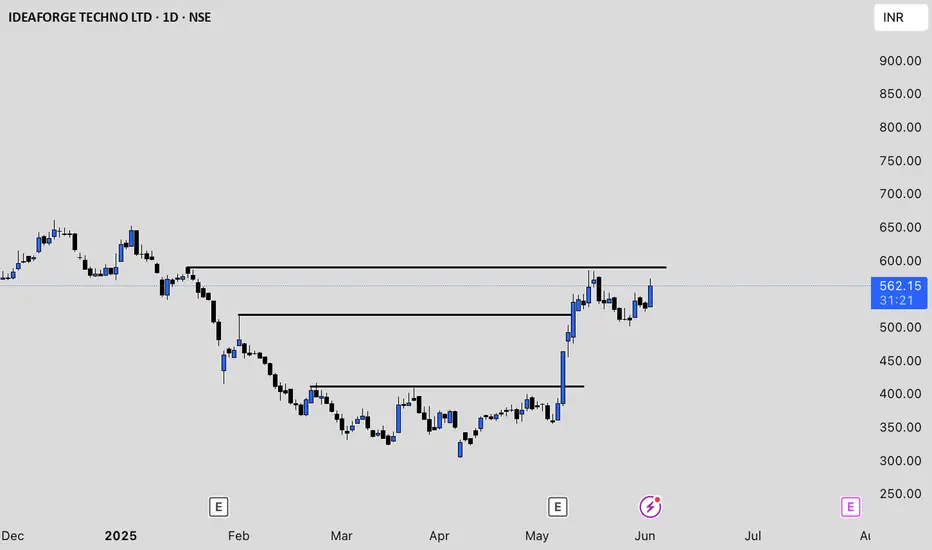
IDEAFORGE Price action## ideaForge Technology Ltd (IDEAFORGE) Price Analysis
**Current Price and Recent Performance**
As of June 3, 2025, ideaForge Technology Ltd (IDEAFORGE) is trading at approximately ₹529 on the NSE . The stock has experienced significant volatility in recent months, with a 52-week high of ₹864 and a low of ₹301 . Over the past few weeks, the price has rebounded sharply from the ₹360–₹400 range in early May to above ₹520 by the end of May, indicating strong recent momentum .
**Valuation and Financials**
- Market capitalization stands at about ₹2,413 crore .
- The stock is trading at roughly 3.9 times its book value, which is considered high for its sector .
- Return on capital employed (ROCE) is negative at -9.36%, and return on equity (ROE) is also negative at -9.81% for the latest period, reflecting operational challenges or recent losses .
- The company is almost debt-free, which is a positive factor for financial stability .
- No dividends have been declared, and the company’s interest coverage ratio is low, suggesting limited ability to cover interest expenses from profits .
**Operational Highlights and Risks**
- ideaForge operates in the unmanned aircraft systems (UAS) segment, a high-growth and innovative sector .
- Promoter holding is relatively low at 29.2%, which may affect investor confidence .
- The company’s debtor days and working capital days have increased significantly, indicating potential challenges in cash flow management .
- Over the last three years, ROE has averaged just 0.86%, highlighting weak profitability .
**Recent Price Action**
- After a sharp rally from ₹360 in early May to over ₹530 by the end of the month, the stock has stabilized in the ₹528–₹559 range in early June .
- Trading volumes have been high during this period, suggesting increased investor interest and possible speculative activity .
**Summary**
ideaForge Technology Ltd has shown strong recent price momentum but faces fundamental challenges, including negative returns, high valuation relative to book value, and growing working capital requirements. The company’s debt-free status and position in a high-potential industry are positives, but weak profitability and low promoter holding are key risks. Investors should monitor operational improvements and cash flow management before considering long-term positions .
Bullishpattern
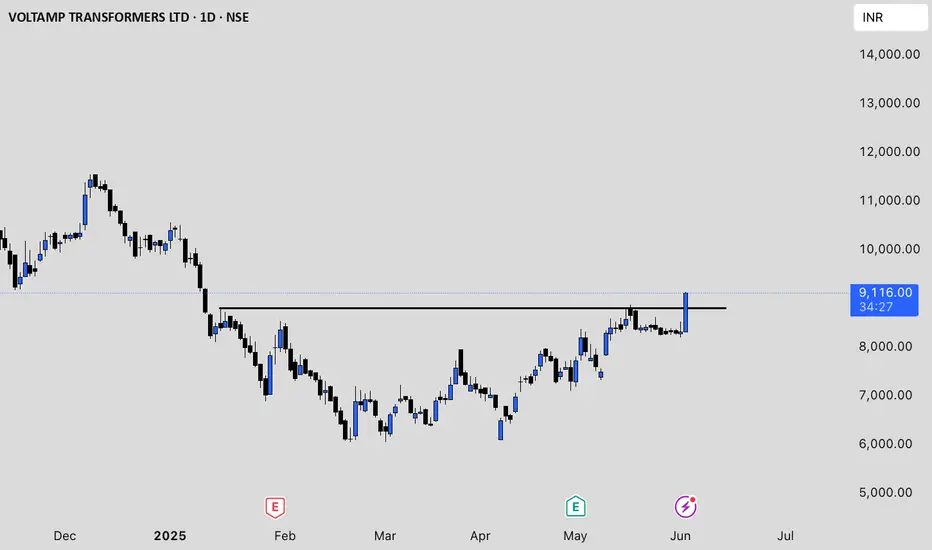
VOLTAMP Price actionVoltamp Transformers Ltd (NSE: VOLTAMP) is trading around ₹8,314 to ₹8,427 as of June 3, 2025 . The stock has experienced notable volatility over the past year, with a 52-week high of ₹14,800 and a low near ₹5,900 . Its market capitalization is approximately ₹8,383 crore .
**Valuation:**
VOLTAMP has a price-to-earnings (P/E) ratio of about 25.8 and a price-to-book (P/B) ratio of 6.19, both higher than its historical averages but lower than some industry peers such as ABB India and CG Power . The dividend yield stands at 1.21%, with a consistent payout ratio of around 30% .
**Growth and Profitability:**
The company has delivered steady growth, with revenue increasing at a compound annual rate of 14.5% over the last five years—well above the industry average . Net income has grown at a 29.4% CAGR in the same period. Return on equity (ROE) is strong at over 22%, and operating margins have improved to about 19% in FY25 .
**Shareholding Trends:**
Promoter holding has remained stable, and there is minimal pledged promoter holding. Retail participation has increased in recent months, while foreign institutional holdings have declined slightly .
**Analyst View:**
Most analysts rate VOLTAMP as a "buy," citing its strong profitability and moderate financial growth. However, the stock is considered high risk due to its volatility, and valuation is on the higher side relative to the broader market .
**Summary:**
VOLTAMP is fundamentally strong with robust revenue and profit growth, high returns, and a stable dividend. However, the stock is currently trading at elevated valuations and has shown significant price swings, so investors should weigh growth prospects against potential overvaluation and volatility.
BAJAJFINSV Price actionAs of March 24, 2025, Bajaj Finserv Ltd (BAJAJFINSV) is trading at ₹1,875.90, showing a 1.56% increase from its previous close of ₹1,847.25 . The stock has demonstrated positive momentum in recent trading sessions, with a 1-day return of 1.5% and a 1-week return of 0.17% .
## Performance Overview
- 1-month return: 0.92%
- 3-month return: 19.83%
- 1-year return: 18.1%
- 5-year return: 316.84%
The stock has shown strong performance over the long term, particularly in the 5-year timeframe, indicating sustained growth.
## Valuation Metrics
- Price-to-Earnings (P/E) Ratio: 17.52
- Price-to-Book (P/B) Ratio: 4.95
- Price-to-Sales (P/S) Ratio: 2.29
The current P/E ratio of 17.52 is lower than the industry average of 24.81, suggesting that the stock may be undervalued compared to its peers .
## Financial Performance
Bajaj Finserv reported strong financial results for Q3 2024-2025:
- Net profit increased by 3.4% year-over-year to ₹2,231 Cr
- Quarterly net profit growth of 6.9% compared to the previous quarter
## Market Position
With a market capitalization of ₹2,94,528.27 Cr, Bajaj Finserv is a significant player in the finance industry. The company has demonstrated robust financial performance with a 5-year CAGR of 43.77% and a healthy debt-to-asset ratio of 0.50 .
Given the company's strong financial performance, positive analyst outlook, and current valuation metrics, Bajaj Finserv appears to be an attractive investment option for those seeking exposure to the financial services sector in India.

Nalwa Sons Investment Ltd. (NSIL) Price Analysis### Nalwa Sons Investment Ltd. (NSIL) Price Analysis as of April 1, 2025:
#### **Current Price and Recent Trends**
- **Current Price (April 1, 2025):** ₹6,594.30 (Range: ₹6,268.53 - ₹6,895.56)
- **Previous Close (March 31, 2025):** ₹6,449.86
- **52-Week Range:** ₹2,245.15 - ₹9,974.00
- **All-Time High:** ₹9,974.00
#### **Key Metrics**
- **Market Cap:** ₹3,113 crore .
- **P/E Ratio (TTM):** 42.08 (High compared to sector average of 31.94)
- **Book Value Per Share:** ₹15,518.22 .
- **Dividend Yield:** 0%
#### **Technical Indicators**
- **Technical Strength:** Strong bullish momentum observed recently
- **RSI and EMA Trends:** Indicate positive momentum with potential for short-term gains
- **Volume Trends:** Average 20-day volume at 12,620 shares with a delivery percentage of 65.43%
#### **Forecast**
- **Short-Term Forecast (April 2, 2025):** Projected price range of ₹6,320.26 - ₹6,934.05 with an expected close around ₹6,613.46
- **Long-Term Outlook:** Potential growth of approximately 6.81% in one year with a target price of ₹6,570.93
#### **Strengths and Weaknesses**
**Strengths:**
- Excellent stability and strong technical indicators.
- Low Price-to-Book ratio of 0.39 suggests undervaluation relative to book value
**Weaknesses:**
- High P/E ratio indicates expensive valuations.
- Low profitability metrics such as ROA (0.45%) and ROE (0.53%)

IDFC BANK LONG TERM VIEWPrice seen taking support from the key demand area of 52-58 zone
Points To Note
- EMA 10-20 Bullish Cross At Weekly TF
- Downward Trendline Breakout
- Price Is Consolidating After T-line Breakout
- Once It Gives Break Above 70.80 Then We Can See Further Upsides
Lets See What It Follows Next
Till Then , Keep Following Markets

Get Unimech for 11% upsideTake entry at 1364Rs
Target 1510
Duration 3 months.
Company reports very good quarterly result. So it is ready to test its life high.....

Poonawalla Fincorp | Probable Bullish Flag Breakout Candidate📊 Technical Analysis Overview:
Poonawalla Fincorp is showing strong bullish momentum and is currently a probable flag breakout candidate. The stock has crossed the 200-day EMA with high volume, indicating strong institutional participation. Additionally, RSI is above 70, confirming bullish strength.
📌 Trade Setup & Key Levels
✅ Buy Entry: ₹357
🚨 Stop Loss: ₹333
🎯 Target Levels:
🔹 Target 1: ₹399.10
🔹 Target 2: ₹414.20
🔹 Target 3: ₹429.85
🔹 Target 4: ₹570.50
🔹 Target 5: ₹584.55
📈 Technical Observations
🔹 Flag Breakout Formation: The stock is attempting a breakout from a bullish flag pattern, which often leads to strong uptrends.
🔹 Volume Confirmation: A surge in volume alongside the breakout increases the probability of sustained upside.
🔹 200 DEMA Crossover: The price has successfully crossed the 200-day EMA, a strong bullish signal.
🔹 RSI Above 70: Indicates strong momentum, though a short-term pullback cannot be ruled out.
⚠️ Risk Management & Final Thoughts
Always use proper risk management to protect capital. The stop loss at ₹333 ensures a controlled downside, while the upside targets provide a strong risk-reward ratio.
📢 Watch for Retest: If the price retests the ₹357 level after the breakout and holds, it could provide another buying opportunity.
📊 What do you think? Will Poonawalla Fincorp continue its rally? Share your thoughts in the comments! 👇

JKLAKSHMI CEMENT - Bullish Inverted H&S Breakout (Daily T/F)Trade Setup
📌 Stock: JK Lakshmi Cement ( NSE:JKLAKSHMI )
📌 Trend: Strong Bullish Momentum
📌 Risk-Reward Ratio: 1:3 (Favorable)
🎯 Entry Zone: ₹862 (Breakout Confirmation)
🛑 Stop Loss: ₹807 (Daily Closing Basis) (~6.4% Risk)
🎯 Target Levels:
₹899.60
₹938.85
₹979.80
₹1,022.50 (Final Target)
Technical Rationale
✅ Bullish Inverted H&S Breakout - Classic reversal pattern confirming uptrend continuation
✅ Strong Momentum - Daily & Weekly RSI >60 (Bullish zone)
✅ Volume Confirmation - Breakout volume 376K vs previous day's 193K (Nearly 2x surge)
✅ Multi-Timeframe Alignment - Daily and weekly charts showing strength
Key Observations
• The breakout comes with significantly higher volume, validating strength
• Well-defined pattern with clear neckline breakout
• Conservative stop loss at recent swing low
Trade Management Strategy
• Consider partial profit booking at each target level
• Move stop loss to breakeven after Target 1 is achieved
• Trail stop loss to protect profits as price progresses
Disclaimer ⚠️
This analysis is strictly for educational purposes and should not be construed as financial advice. Trading in equities involves substantial risk of capital loss. Past performance is not indicative of future results. Always conduct your own research, consider your risk appetite, and consult a financial advisor before making any investment decisions. The author assumes no responsibility for any trading outcomes based on this information.
What do you think? Are you watching NSE:JKLAKSHMI for this breakout opportunity? Share your views in the comments!

HDFCBANK (Bullish)A very good consolidation, any breakout towards upside can propel price upto 2000. This same trend can also be seen and captured in BankNifty.

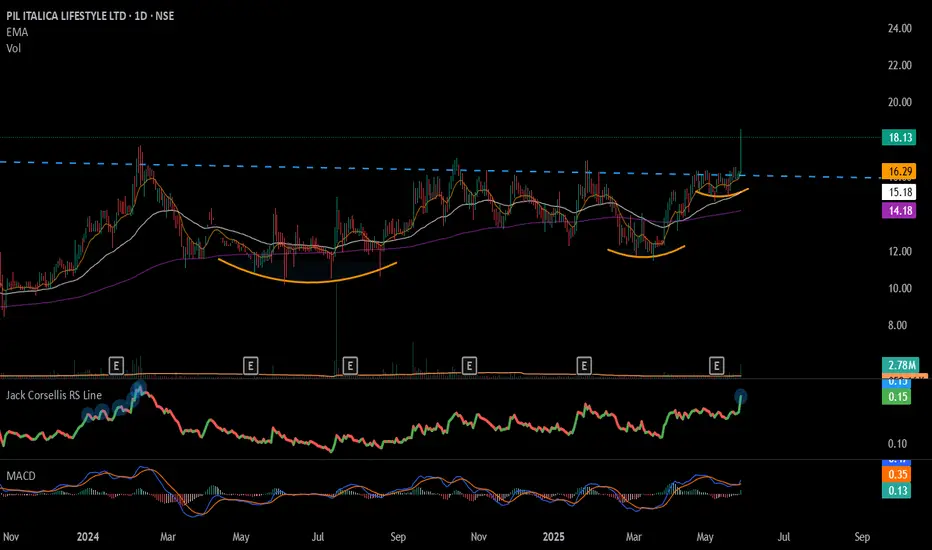
#PILITA - Multi Year BreakOut 📊 Script: PILITA
Key highlights: 💡⚡
📈 8 Year BreakOut in Daily Time Frame.
📈 Price consolidating near Resistance.
📈 Volume spike during Breakout
📈 MACD Bullish
📈 Can go for a swing trade
⚠️ Important: It’s a Penny Stock Trade with extreme caution
BUY ONLY ABOVE 17.50 DCB
⏱️ C.M.P 📑💰- 17.45
🟢 Target 🎯🏆 – NA%
⚠️ Stoploss ☠️🚫 – NA%
⚠️ Important: Market conditions are Okish, Position size 50% per Trade. Protect Capital Always
⚠️ Important: Always Exit the trade before any Event.
⚠️ Important: Always maintain your Risk:Reward Ratio as 1:2, with this RR, you only need a 33% win rate to Breakeven.
✅Like and follow to never miss a new idea!✅
Disclaimer: I am not SEBI Registered Advisor. My posts are purely for training and educational purposes.
Eat🍜 Sleep😴 TradingView📈 Repeat 🔁
Happy learning with MMT. Cheers!🥂
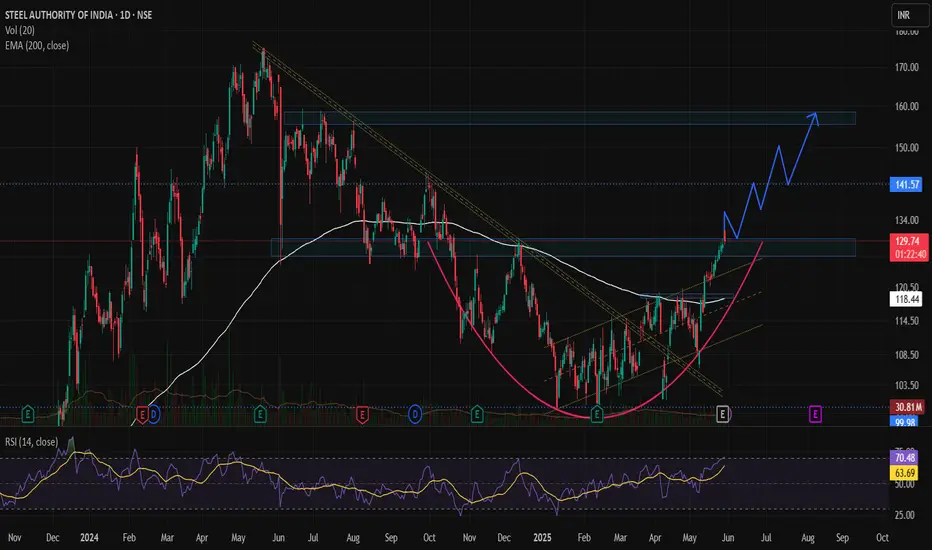
SAIL – Trend Reversal & Trade SetupA trend reversal appears to be taking shape in SAIL, indicating a potential shift from a downtrend to an uptrend. The stock has recently came out of a falling trendline and has closed above its 200-day EMA, placed at ₹117, signaling renewed strength and buyer interest.
🔄 Technical Outlook
- Breakout Zone: SAIL gave a technical breakout at ₹117, which aligns with its 200 EMA (Day), a widely tracked long-term moving average.
- Current Price Action: The stock is now trading at around ₹130, emerging from a rounding bottom pattern, which is a bullish continuation pattern indicating accumulation and base formation.
- Volume Analysis: Recent trading sessions have shown notable volume spikes, supporting the bullish breakout and trend reversal narrative.
- Fundamental Trigger: Q4 Results have been decent, providing a fundamental cushion to the technical setup. While not overly bullish, the results are good enough to support the ongoing trend reversal, especially if broader market sentiment remains stable.
📊 Support & Resistance Levels
- Crucial Support Zone: ₹127–₹130 — holding this zone is key for sustaining the bullish move.
- Key Breakout Zone: ₹127–₹130 — staying above this range will confirm the breakout and strengthen the upward move.
- Stop Loss: A protective stop-loss at ₹115, which lies just below the 200-day EMA, is advisable to manage downside risk.
🎯 Target Levels
First Target: ₹140
Second Target: ₹150
Final Target: ₹158
Time Frame: Expected to take 2–2.5 months to achieve the projected targets if momentum continues.
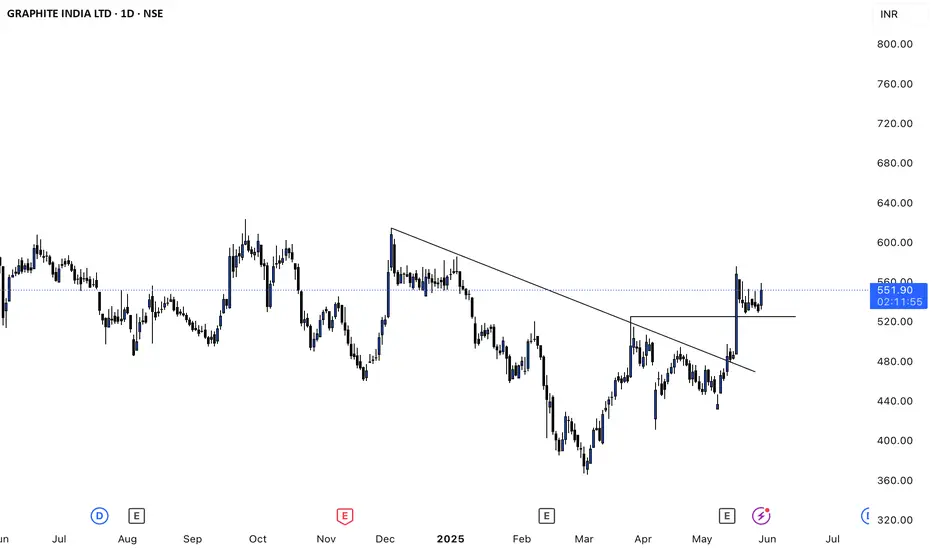
Graphite Price analysisGraphite India Ltd's share price is currently around ₹530.95 to ₹555.45 as of May 29, 2025. The stock has shown strong short-term momentum, gaining over 20% in the past month and more than 40% in the last three months. However, its one-year return is negative, down about 4–6%, underperforming the broader Sensex, though its five-year return remains impressive at over 190% .
Analyst sentiment is positive, with both covering analysts rating the stock as a "Strong Buy." Their average 12-month target price is ₹654, representing an upside of about 20–23% from current levels . The highest target is ₹718 and the lowest is ₹590 .
From a valuation perspective, Graphite India trades at a price-to-earnings (P/E) ratio of about 22–23x, which is significantly lower than its peer average (42x) and the broader Indian electrical industry average (nearly 40x). This suggests the stock is relatively undervalued compared to its sector . The estimated fair value per discounted cash flow models is around ₹421, so the current price is above fundamental fair value, but still below the fair P/E valuation of 49.8x .
Recent financials show volatility: revenue and net income have fluctuated quarter to quarter, with a notable recovery in Q1 FY25 after a loss in the previous quarter. Net profit margin also rebounded to 7.36% in the latest quarter .
Technically, the stock is experiencing mixed signals. Weekly indicators like MACD and Bollinger Bands suggest a mildly bullish trend, but monthly indicators remain sideways to mildly bearish. The daily trend is mildly bearish, reflecting some short-term caution despite strong recent gains .
In summary, Graphite India has recently rebounded sharply but remains below its 52-week high. It is seen as undervalued relative to peers, with analysts expecting further upside. However, technical and fundamental signals are mixed, so investors should watch for continued volatility and monitor quarterly performance for sustained recovery .
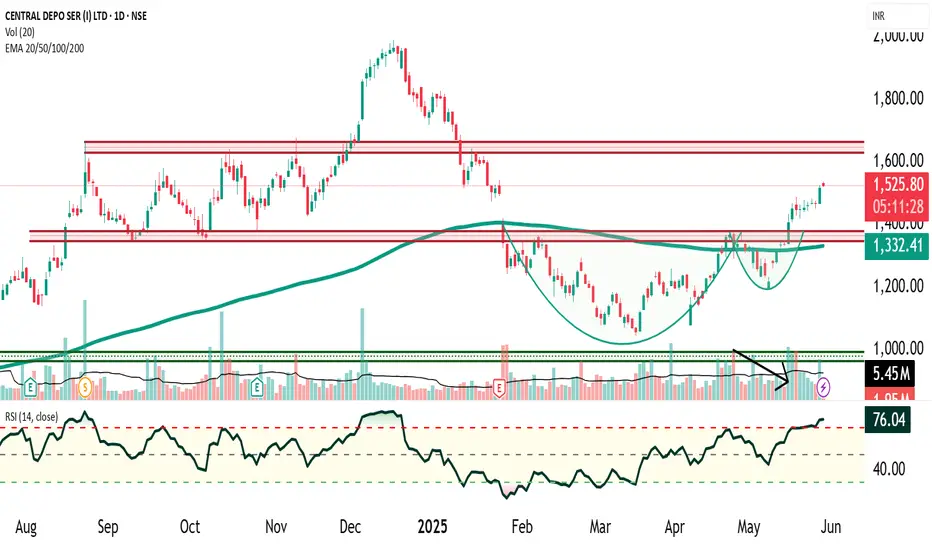
CDSL Bullish Cup and Handle Breakout ConfirmLate Published "Only for Educational Purpose"
📊 Pattern Formation: Bullish Cup and Handle
CDSL has officially broken out of a Bullish Cup and Handle chart pattern, signaling a strong technical breakout with high probability of an extended uptrend. This classic bullish continuation pattern took 4 months to form, indicating a well-developed structure with strong base formation.
Neckline Resistance: ₹1380
Breakout Confirmation: Occurred with rising volume, confirming buyer participation
Handle Formation: Characterized by a pullback on declining volume, a textbook sign of weak selling pressure and consolidation before a breakout
📈 Volume & Momentum Indicators
✅ Volume Surge : Confirmed breakout with significant increase in volume — a clear sign of institutional buying
✅ RSI (Relative Strength Index): Currently above 60, indicating strong bullish momentum and room for further upside
✅ Price > 200 EMA: Signals that CDSL is in a confirmed long-term uptrend; the price holding above the 200-day exponential moving average is a strong bullish sign
🎯 Price Target Calculation – Cup and Handle Measurement Rule
Measurement Rule Target:
📌 Target Price = Neckline + Depth of Cup
Neckline: ₹1380
Bottom of Cup (approx.): ₹1180
Cup Depth = ₹1380 - ₹1180 = ₹200
➡️ Projected Target = ₹1380 + ₹200 = ₹1580
🛡️ Stop-Loss (Risk Management)
Choose between Conservative and Aggressive exit strategies:
Conservative SL: Below the lowest low of the handle (approx. ₹1290)
Aggressive SL: Below the breakout candle low (approx. ₹1345)
🔥 Trending Takeaways
CDSL is exhibiting a bullish breakout setup with volume confirmation, strong RSI, and price above 200 EMA. This combination often precedes explosive price action and potential multi-week rally.
🚀 #CDSLBreakout #CupAndHandle #BullishBreakout #TechnicalAnalysis #StockMarketIndia #SwingTrading #MomentumStocks #NSEStocks #ChartPatterns #VolumeAnalysis #StockMarketNews #RSI60 #200EMA #BreakoutStocks #PriceActionTrading
Sobha Ltd's Price AnalysisSobha Ltd's share price as of late May 2025 is trading in the range of ₹1,349.60 to ₹1,386.10, with recent sessions showing minor fluctuations and a slight upward move from the previous close. Over the past year, the stock has declined by nearly 29%, though its longer-term performance remains strong, with a five-year return exceeding 600% .
From a valuation perspective, Sobha is trading at a high price-to-earnings (P/E) ratio of about 225–241, which is significantly above the industry average and suggests the stock is priced for substantial future growth or that current earnings are relatively low. Its price-to-book (P/B) ratio is also elevated, at around 4.25–5.85 times, indicating a premium to its book value. The intrinsic value estimate is much lower than the current market price, at approximately ₹538.36, suggesting the stock is overvalued by fundamental metrics .
Analyst sentiment remains largely positive, with about 76% of analysts recommending a buy and an average target price of ₹1,580.88, indicating a potential upside of around 15% from current levels. The highest analyst target is ₹2,459, while the lowest is ₹1,150, reflecting a wide range of expectations .
Recent financial trends show revenue growth over the last three quarters, with net profit margins improving but still modest. Mutual fund holdings have slightly increased, and promoter holdings remain stable, both of which are generally positive indicators. However, the company has a low interest coverage ratio and has delivered poor sales growth over the past five years, signaling some underlying financial risks .
Technically, the stock has shown short-term bearish signals, with a recent moving average crossover historically leading to declines in the following week. Despite this, the long-term outlook from analysts remains constructive, and historical data shows that Sobha has often delivered positive returns in May, with an average change of 6.85% for the month over 17 years .
In summary, Sobha Ltd's stock is currently trading at a premium, with high valuations and mixed short-term signals, but it remains favored by analysts for its long-term growth potential. Investors should weigh the optimistic forecasts against the elevated risk implied by current valuations and recent negative momentum.

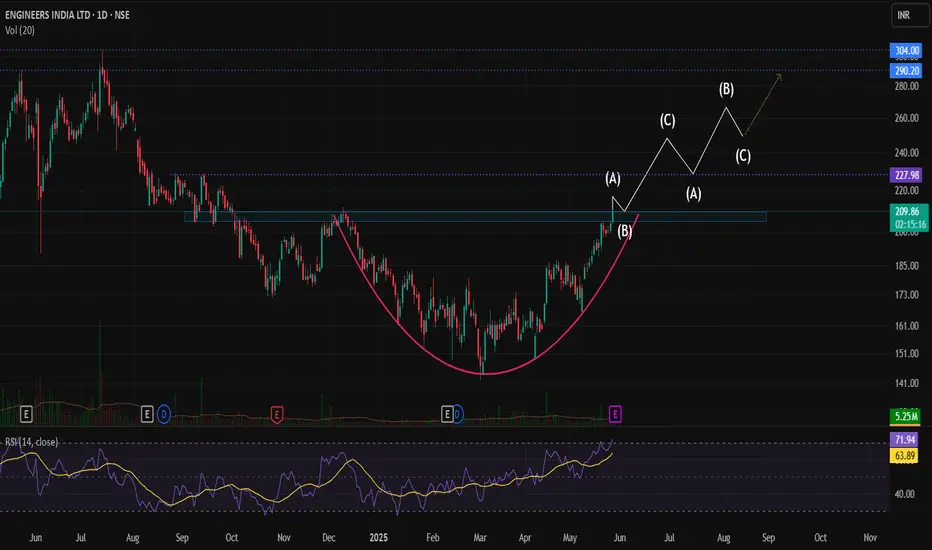
Engineers India – Technical Analysis & Trade SetupEngineers India Ltd has recently formed a rounding bottom pattern on the chart, a classic bullish reversal pattern that suggests a shift in momentum from bearish to bullish. The key resistance level lies at ₹210-212 price zone, and a breakout above this level with strong volume will confirm the pattern.
📈 Breakout Confirmation & Retest Zone :
A decisive close above ₹212 will mark a technical breakout, putting the stock at its 8-month high. Post-breakout, a retest of the ₹205–₹210 zone is likely. If the stock takes support and consolidates in this zone, it will indicate strength and readiness for the next upward leg.
📅 Fundamental Trigger – Q4 Results :
Investors and traders should closely monitor the Q4 results scheduled for 29 May. A strong earnings report could serve as a catalyst to support the technical breakout and sustain the uptrend. Conversely, a weak result may delay or invalidate the breakout momentum.
🎯 Targets & Price Action Outlook:
- Short-term buying range: Between ₹210 and ₹215.
- Immediate target: ₹250
- Next targets: ₹290 and eventually ₹300, which may take 3–4 months to achieve if the trend sustains.
- Stop loss can be placed at ₹185.
⚠️ Key Points to Watch:
- Volume confirmation on breakout above ₹212.
- Retest and support around ₹205–₹210.
- Q4 earnings impact on price action.
- Keep a disciplined stop-loss strategy based on risk appetite.
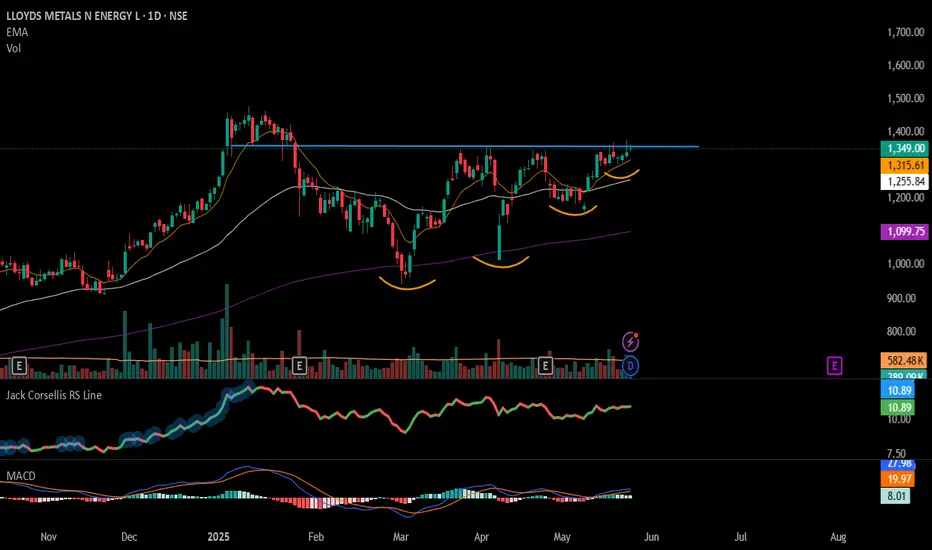
#LLOYDSME - BreakOut Soon Candidate📊 Script: LLOYDSME
Key highlights: 💡⚡
📈 VCP BreakOut in Daily Time Frame.
📈 Price consolidating near Resistance.
📈 Wait for Volume spike during Breakout
📈 MACD Bullish
📈 Can go for a swing trade
BUY ONLY ABOVE 1405 DCB
⏱️ C.M.P 📑💰- 1349
🟢 Target 🎯🏆 – NA%
⚠️ Stoploss ☠️🚫 – NA%
⚠️ Important: Market conditions are Okish, Position size 50% per Trade. Protect Capital Always
⚠️ Important: Always Exit the trade before any Event.
⚠️ Important: Always maintain your Risk:Reward Ratio as 1:2, with this RR, you only need a 33% win rate to Breakeven.
✅Like and follow to never miss a new idea!✅
Disclaimer: I am not SEBI Registered Advisor. My posts are purely for training and educational purposes.
Eat🍜 Sleep😴 TradingView📈 Repeat 🔁
Happy learning with MMT. Cheers!🥂
Reliance making head and shoulder n 15min timeframe.Reliance making head and shoulder n 15min timeframe. With a target of +1.5%
Stock retested its neckline today.
T1- 1460
T2- 1480
Stop loss : 1425

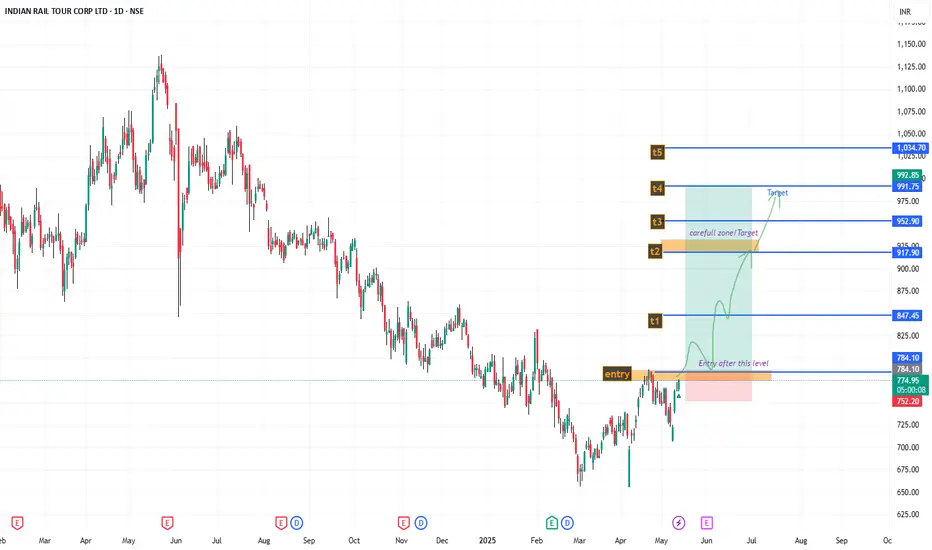
IRCTC , Looking good ; min 25% Roi ; swing For short term investment ;
Leave a " Like If you agree ".👍
.
Wait for small retracement & daily candle to close above - "785".
Trade carefully untill ENTRY level.
.
Entry: 785
Target: 850-917-991
sl: 745
major stoploss/ support: 700.
.
Enter only if market Breaks
"Yellow box" mentioned.
.
.
Don't make complicated trade set-up.📈📉
Keep it " simple, focus on consistency "💹
Refer our old ideas for accuracy rate🧑💻
Follow for daily updates👍
.
Refer old posted idea attached below.
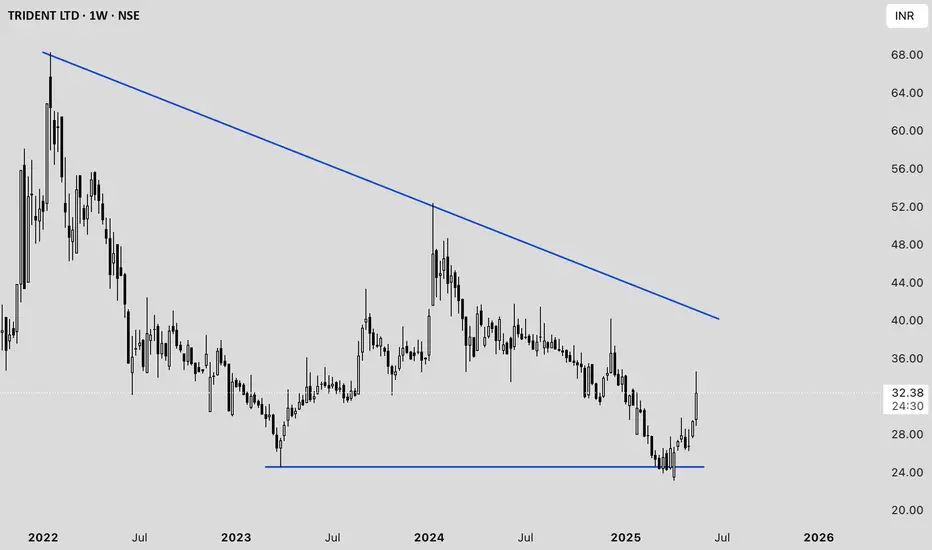
Trident Ltd. Price Analysis (as of May 23, 2025)#### **Current Price and Recent Movement**
- **Latest Price:** ₹32.11 (down 2.32% from the previous close) .
- **1-Week Return:** +9.29%
- **1-Month Return:** +9.11%
- **1-Year Return:** -15.39%
- **3-Year Return:** -32.89%
#### **Technical Analysis**
- **Buy Signal:** A 200-day moving average crossover occurred on May 21, 2025. Historically, this signal has led to an average gain of 6.61% within 30 days .
- **Momentum Indicators:**
- **RSI:** 62.17 (shows moderate bullish momentum)
- **MACD:** 0.535 (bullish signal)
- **Stochastic:** 75.40 (approaching overbought zone)
- **Supertrend:** 26.03 (bullish)
- **ROC:** 10.87 (positive momentum)
- **Analyst Sentiment:** 100% of analysts currently recommend a "Buy" with an average target price of ₹38, indicating a potential upside of ~15.6% .
#### **Fundamental Overview**
- **P/E Ratio:** 44.50–45.65 (well below the industry average of 126.09, but still high relative to earnings growth)
- **Price-to-Book Ratio:** 3.62–3.88
- **Dividend:** Announced ₹0.5 per share (record date: May 27, 2025) .
- **Net Profit Margin:** 5.78% (FY24)
- **Return on Equity:** 9.04% (FY24)
- **Debt/Equity:** 0.48 (moderate leverage)
- **Intrinsic Value Estimate:** ₹9.73 (suggests current price is at a premium to intrinsic value)
#### **Recent Financial Performance**
- **Q3 FY25 Revenue:** ₹1,667.09 crore (down 9.17% YoY)
- **Profitability:** Net profit/share for FY24 was ₹0.76, down from ₹0.83 in FY23
- **Expense Management:** Interest expense is low at 1.86% of operating revenue; employee cost is 13.2%
#### **Strengths**
- Strong technical momentum and recent bullish crossover.
- Consistent dividend payout.
- Low interest expense and moderate leverage.
#### **Weaknesses**
- Declining revenue and profit over the last few quarters.
- High valuation relative to earnings and intrinsic value.
- Long-term returns have been negative over 1 and 3 years.
#### **Outlook**
Analysts remain bullish in the short term, buoyed by technical signals and an expected price target of ₹38 . However, fundamental concerns such as declining profits, high P/E, and premium to intrinsic value warrant caution for long-term investors.
---
**Summary:**
Trident Ltd. is showing short-term bullish momentum with positive technical indicators and analyst sentiment. However, investors should be cautious due to weak long-term performance, high valuation, and recent declines in revenue and profit .
FSL price actionFirstsource Solutions Ltd (FSL) on the NSE is trading at ₹385.55 as of May 23, 2025 . The stock has shown strong performance over the past year, with a return of 87.31% and a five-year return exceeding 1,100% . FSL’s 52-week high is ₹422.30, while the 52-week low is ₹176.25 .
Recent price action shows that after peaking near its all-time high in January 2025, FSL corrected but has since rebounded sharply from the ₹320–₹330 range in early May to the current levels. Trading volumes have been robust during this rally, indicating strong market participation.
Technically, FSL is in a bullish trend, but short-term volatility remains high. Key support is seen around ₹355–₹360, while resistance is near ₹385–₹422. Sustained trading above ₹385 could open the way for a retest of the all-time high. The stock is considered high risk, being over three times as volatile as the Nifty index .
Fundamentally, FSL reported a 29.4% year-on-year revenue growth in Q4 FY25, driven by its healthcare and banking verticals. The company is focusing on client diversification and operational efficiency, with a projected 12–15% revenue growth for FY26. Its P/E ratio is 43.34 and P/B ratio is 6.96, both above the sector average, reflecting premium valuations .
In summary, FSL is in a strong uptrend with positive momentum and robust financial performance, but short-term volatility and premium valuations warrant cautious optimism for new investors .

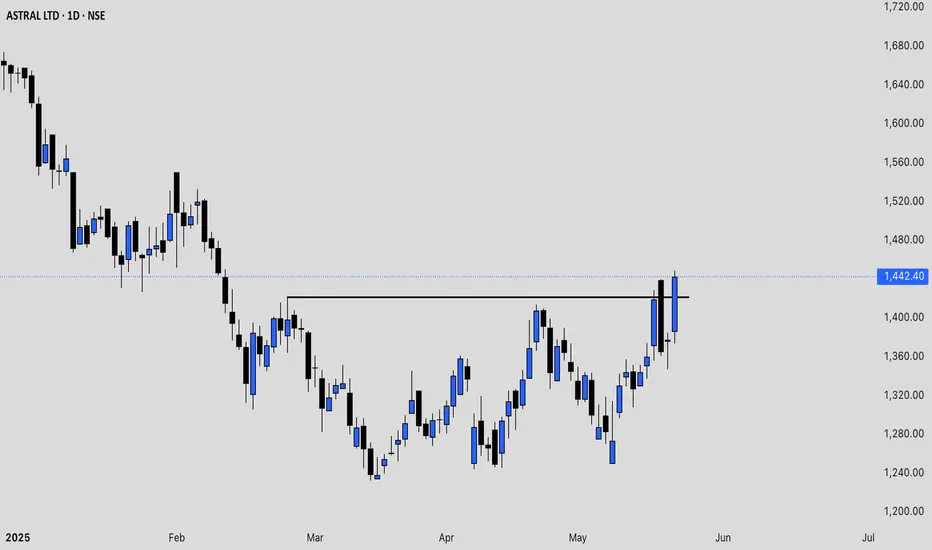
ASTRAL price action analysis Astral Ltd (ASTRAL) has shown a mix of volatility and recovery in May 2025. After a sharp decline earlier in the month, the stock rebounded, with recent prices moving from the ₹1,330–₹1,350 range up to ₹1,377.70 as of May 21, 2025. The trading volumes have remained strong, indicating active participation from both buyers and sellers.
Technically, Astral is trading above its short-term volume-weighted average price (VWAP) of around ₹1,362.9, which is a positive sign for near-term momentum . The price action over the past week has included both sharp drops and quick recoveries, suggesting a tug-of-war between bulls and bears. Oscillators and moving averages currently indicate a neutral to mildly bullish setup, with the stock having recovered from oversold levels seen earlier in May.
Astral’s 52-week high is ₹2,454, and the 52-week low is ₹1,232, showing that the current price is closer to the lower end of its yearly range . The price-to-earnings (P/E) ratio remains high (around 70), and the price-to-book (P/B) ratio is also elevated, reflecting premium valuations . The company’s fundamentals remain strong, but the high valuation and recent volatility suggest that further upside may require continued earnings growth or positive sector developments.
In summary, Astral is currently in a recovery phase after recent volatility. The technical outlook is neutral to slightly positive as long as the stock holds above the VWAP and key short-term support levels. Investors should watch for sustained moves above ₹1,380–₹1,400 for confirmation of renewed bullish momentum, while a drop below ₹1,350 could signal renewed weakness.
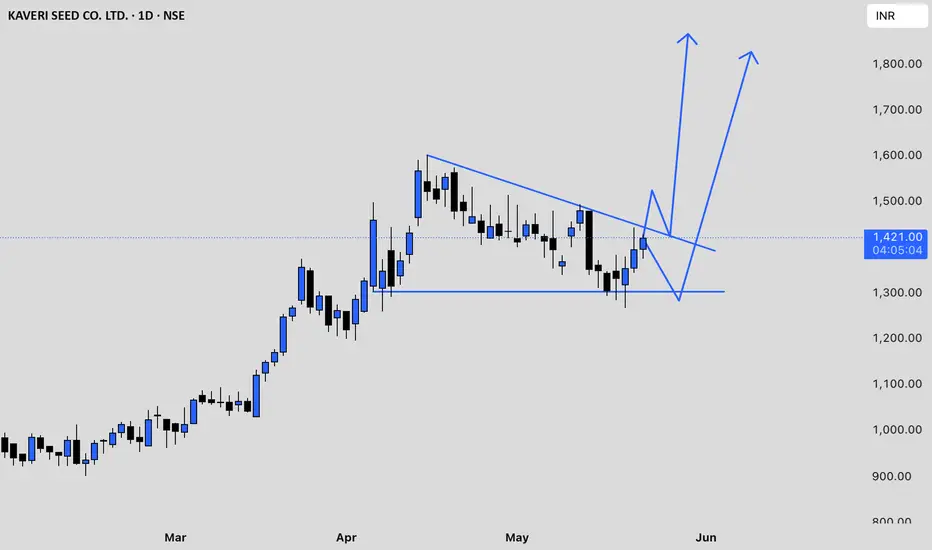
KSCL chart analysisKaveri Seed Company Ltd (KSCL) has recently experienced significant volatility. After reaching a peak above ₹1,480 in mid-May 2025, the stock corrected sharply, falling to the ₹1,305–₹1,345 range by May 16, marking a notable pullback of nearly 9% in a single session. Trading volumes have been high, indicating strong market participation during both the rally and the subsequent sell-off.
From a technical perspective, KSCL’s price remains above its 50-day, 100-day, and 200-day exponential moving averages, which suggests that the longer-term trend is still bullish. However, momentum indicators such as the Relative Strength Index (RSI) and Commodity Channel Index (CCI) are both in oversold territory, signaling that the recent correction may have been overdone and that a technical bounce could be possible if market sentiment improves. The Moving Average Convergence Divergence (MACD) is below its signal line, and the Average Directional Index (ADX) indicates the presence of a short-term downtrend.
Immediate support for KSCL is seen around ₹1,232, with further support at ₹1,174 and ₹1,116. On the upside, resistance is expected near ₹1,399, then at ₹1,457 and ₹1,515. The near-term pivot area is around ₹1,340–₹1,350.
Recent company developments—including the acquisition of a 30% stake in Aditya Agri Tech Pvt Ltd and the release of Q4 and FY25 results—may be influencing the current price action. The company has also been working to address challenges in receivables management, which could impact future performance.
In summary, KSCL is in a corrective phase after a strong rally, with oversold technical indicators suggesting potential for a short-term rebound if support holds. However, the short-term trend remains down, so traders should watch for stabilization above key support levels before considering new long positions. The longer-term outlook stays positive as long as the price remains above major moving averages, but caution is advised due to ongoing volatility and bearish momentum signals.
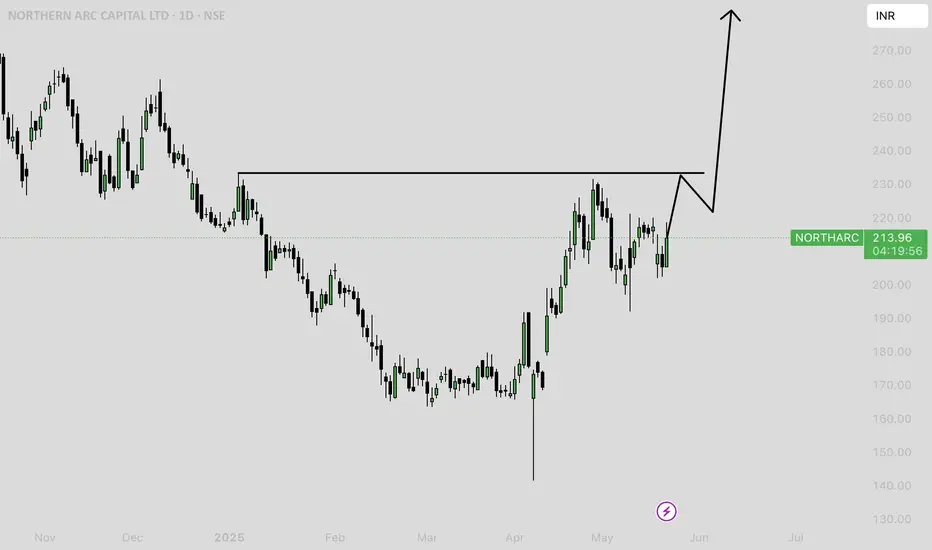
## NORTHARC Price Action Analysis
### **Recent Price Performance**
- **Current Price:** As of the latest available data, Northern Arc Capital Ltd (NORTHARC) is trading around ₹208–213.
- **Volatility:** The stock is showing a volatility of about 4.14% with a beta of 1.37, indicating higher-than-market volatility.
- **52-Week Range:** The price has ranged from a low of ₹141.47 (April 7, 2025) to a high of ₹350.00 (September 24, 2024).
- **Recent Trend:** NORTHARC has fallen by about 8% over the past week but is up nearly 14% over the past month. Over the last year, the stock is down 39% from its highs.
### **Technical Indicators**
#### **Moving Averages**
- **Short-term (20-day EMA/SMA):** Price is near or slightly below the 20-day EMA (₹201.94) and SMA (₹201.11), both indicating a neutral trend.
- **Medium-term (50-day EMA/SMA):** The price is below the 50-day EMA (₹216.61) and SMA (₹218.06), also signaling a neutral to weak trend.
#### **Oscillators**
- **RSI (14):** 34.43, indicating a downtrend and approaching oversold territory .
- **Stochastic RSI (14):** 0.41, signaling a strong downtrend.
- **CCI (14):** -97.09, also confirming a downtrend .
- **MFI:** 25.56, suggesting strong selling pressure and a strong downtrend.
#### **Support and Resistance Levels**
- **Immediate Support:** ₹188.54
- **Key Support:** ₹185.85, ₹181.19
- **Immediate Resistance:** ₹195.89
- **Next Resistance:** ₹200.55, ₹203.24
- **Pivot Level:** ₹193.2
### **Order Book and Liquidity**
- **Order Book:** There is active buying interest around ₹207–208 and selling interest around ₹210–215, indicating a tight trading range and liquidity at current levels.
- **Volume:** Trading volume is robust, with recent daily volumes exceeding 1.6 million shares.
### **Fundamental and Event Context**
- **Recent One-Time Provision:** NORTHARC recorded a significant one-time provision (impairment of ₹1,200 crore) in Q4 FY25, sharply reducing reported profits. Excluding this, underlying business performance was strong, and some analysts expect a rebound in the coming months.
- **Valuation:** The stock is trading at a price-to-book (P/B) ratio of 1.02 and a trailing P/E of 9.49, both below the sector average, suggesting attractive valuations if underlying fundamentals remain stable.
### **Technical Summary**
- **Overall Technical Rating:** Mixed signals. Moving averages are neutral, but oscillators indicate a downtrend and possible oversold conditions.
- **Short-Term Outlook:** The stock is near key support levels, with oscillators hinting at potential for a technical bounce if selling pressure abates. However, sustained weakness below ₹188 could trigger further downside.
- **Medium-Term Outlook:** Recovery potential exists if the stock holds above support and market absorbs the impact of the one-time provision.
---
**In summary:** NORTHARC is currently consolidating near its recent lows, with technical oscillators in a downtrend but approaching oversold territory. The price is below key moving averages, and significant support exists around ₹185–188. The stock may see a technical bounce if support holds, but further downside is possible if it breaks below these levels. The impact of the recent one-time provision is a key factor, with some market participants expecting a rebound as fundamentals normalize.