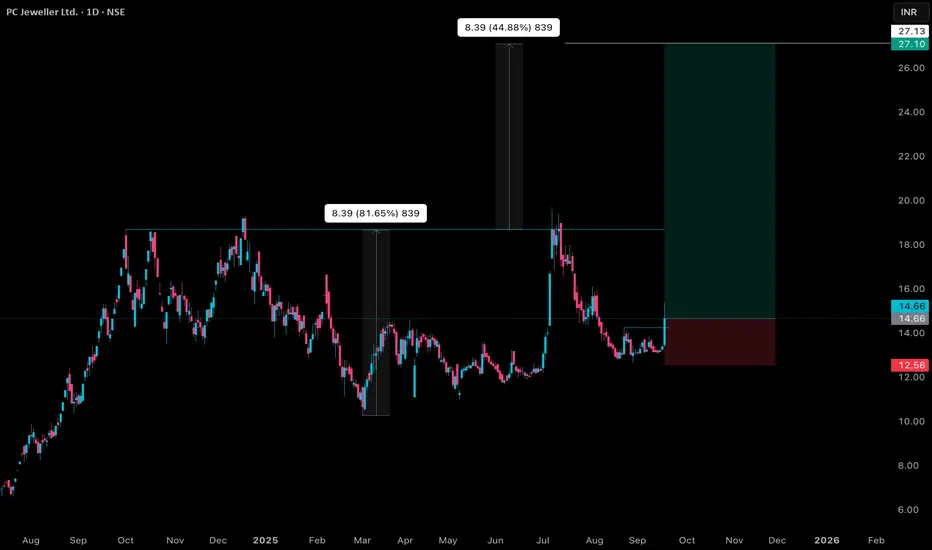
PCJEWELLER Price ActionPC Jeweller closed today at ₹14.66, up around 9.4% from the previous close. The stock traded in a range between ₹13.37 and ₹15.38 during the session, showing strong buying interest and significant intraday volatility. The price surge follows better-than-expected quarterly results, with a 4% year-on-year rise in consolidated net profit and substantial revenue growth, which supported bullish momentum.
Technically, PC Jeweller is showing signs of a bullish shift with support around ₹13–14 and resistance near ₹15–16.70. A sustained move above ₹15 could open the path toward higher levels between ₹16 and ₹17. The stock has been forming higher lows and maintaining good volume, signaling strength. However, a breakdown below ₹13–13.50 would indicate a loss of momentum and potential short-term correction.
Overall, PC Jeweller currently exhibits bullish momentum with positive fundamentals supporting the uptrend, but it remains essential to monitor key support and resistance zones closely for trade decisions.
Bullishpattern
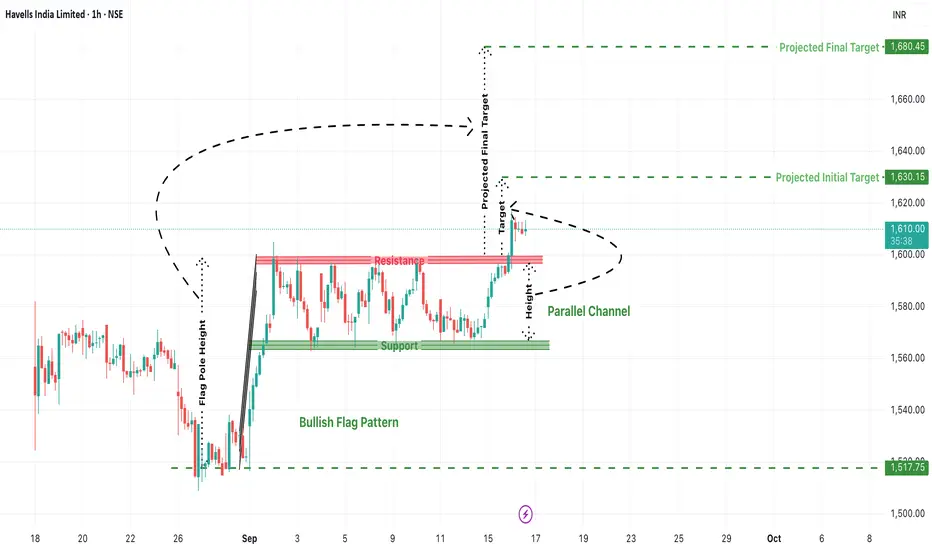
Havells Bullish Flag Breakout: Can We See a Rally to 1680+?Havells India Ltd. is currently showing a classic bullish technical setup—a Bullish Flag Pattern—that could lead to a potential breakout and strong upside movement in the short term. Traders who favor breakout-based strategies should pay close attention to this chart, especially considering the structured parallel channel and previous rally that preceded it.
1. Bullish Flag Pattern: Anatomy of the Setup
A bull flag is a continuation pattern that occurs after a sharp price rise (flagpole), followed by a period of consolidation within a narrow parallel channel (the flag). This structure typically suggests that the bullish trend will resume once the price breaks out of the flag range.
In Havells:
Flag Pole: The stock surged sharply from the 1517 zone to near 1610, forming a vertical rise.
Flag/Channel: Price moved sideways within a narrow support at ~1570 and resistance at ~1610, creating a clean parallel channel.
This shows price compression after a strong move, typically a sign of healthy consolidation before another leg up.
2. Breakout Levels and Price Action Confirmation
As per the current chart:
Havells has broken above the resistance zone around 1610, signaling a potential breakout.
The breakout candle is attempting to close above the red resistance band, and follow-up candles will be crucial to confirm strength.
A retest of this breakout zone could offer ideal long entries.
3. Projected Targets from the Pattern
Using the flagpole height, we can project upside targets from the breakout point:
Initial Target: ₹1630.15
A conservative target based on minor resistance and pole extension.
Final Projected Target: ₹1680.45
This marks the full measured move and could be achieved if the rally sustains momentum.
4. Ideal Trading Plan (For Traders)
Entry:
After confirmed breakout above ₹1610
Or on retest near ₹1600–1610 zone with bullish price action.
Stop Loss:
Below the flag support zone at around ₹1570
Aggressive traders can keep it below ₹1585.
Targets:
T1: ₹1630
T2: ₹1680+
Risk-Reward Ratio:
Minimum 1:2 depending on entry price.
5. Risk Scenarios to Watch For
False Breakouts: If the breakout doesn’t sustain and price falls back into the channel, it may trap early longs.
Macro Events: Broader market volatility (Nifty moves or global cues) can impact momentum.
Volume: Lack of volume on breakout candles can reduce conviction—always monitor volume to confirm strength.
Conclusion: Havells Looks Set for a Fresh Rally
This is a textbook bullish flag breakout in formation, with clear upside potential. If the momentum sustains, Havells could very well reach 1680+ in the coming sessions. However, traders must practice disciplined risk management, wait for confirmation, and avoid chasing without a proper plan.
ETH Setup You Can't Ignore:4k FVG to 5k Seller Zone ⚠️ ETH Setup You Can’t Ignore: 4K FVG to 5K SELLER ZONE!
ETHUSD – Fair Value Gap & Liquidity Sweep Setup
Ethereum is trading within a critical range, presenting a potential ICT-style setup:
Fair Value Gap (4000–4200) – Key demand zone with a “Golden Line” midpoint; price may dip to fill this imbalance before reversing.
Seller Zone (~5000) – Major supply zone where profit-taking or distribution could trigger.
Bias – Expect a sweep of downside liquidity, a reaction within the FVG, and a possible rally toward the 5000 zone if higher timeframe confluence supports it.
⚠️ Always wait for confirmation and manage risk before execution.

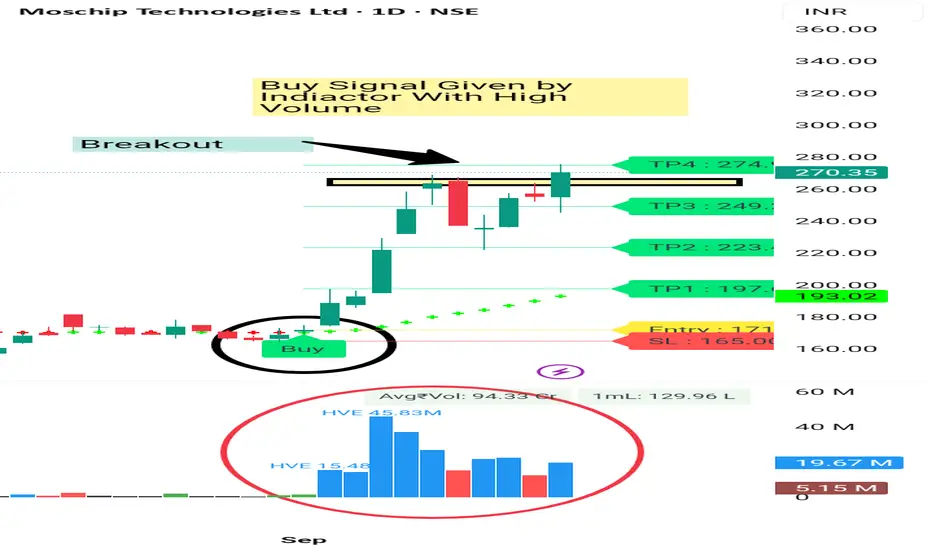
MOSCHIP BREAKOUT with Heavy Volume moschip is Given Decent Movement in past with High Volume. And now it's given good Breakout with Bullish Englulfing Candle. It's a Clear Breakout and it can give 5 -8% Quick movement from here . Keep SL 5%
Consult your financial advisor before making any position in stock market.
For More information. Visit my Tradingview Profile.
Always Trade with Stoploss.
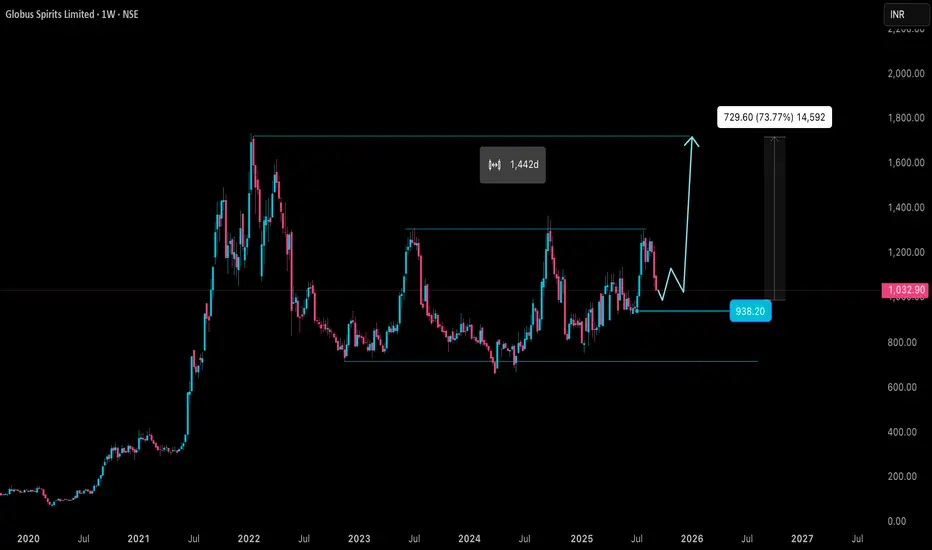
GLOBUSSPR Price ActionGlobus Spirits Ltd is trading at ₹1,203.65 as of September 14, 2025, reflecting strong price action near its annual high of ₹1,373.35 and well above its 52-week low of ₹751.05. Market capitalization stands at approximately ₹3,487 crore, with active trading volumes indicating sustained investor interest.
The company posted a total income of ₹2,537.14 crore for the latest financial year, with a net profit of ₹21.92 crore and earnings per share at ₹8.75 on a trailing twelve-month basis. Operations span branded Indian Made Foreign Liquor (IMFL) and bulk ethanol sales, driving stable revenue growth amid resilient demand from both retail and institutional buyers. Operating margins are healthy, helped by improved product mix and continued cost discipline, while net profit margin remains modest due to ongoing investments in capacity and distribution expansion.
Globus Spirits maintains a robust balance sheet with manageable debt, strong cash flows, and regular dividend payouts. Promoter shareholding is steady, supporting long-term confidence in business strategy and execution. Technical indicators show the stock trading above key short- and long-term moving averages, with momentum oscillators still in a bullish zone. However, given the recent rally, investors should watch for profit booking near resistance levels.
Overall, Globus Spirits demonstrates solid financial strength and growth prospects, supported by sector tailwinds in the alcobev and ethanol market, value-added product launches, and expanding distribution networks. The medium-term outlook is constructive, contingent on healthy demand and prudent operational execution.
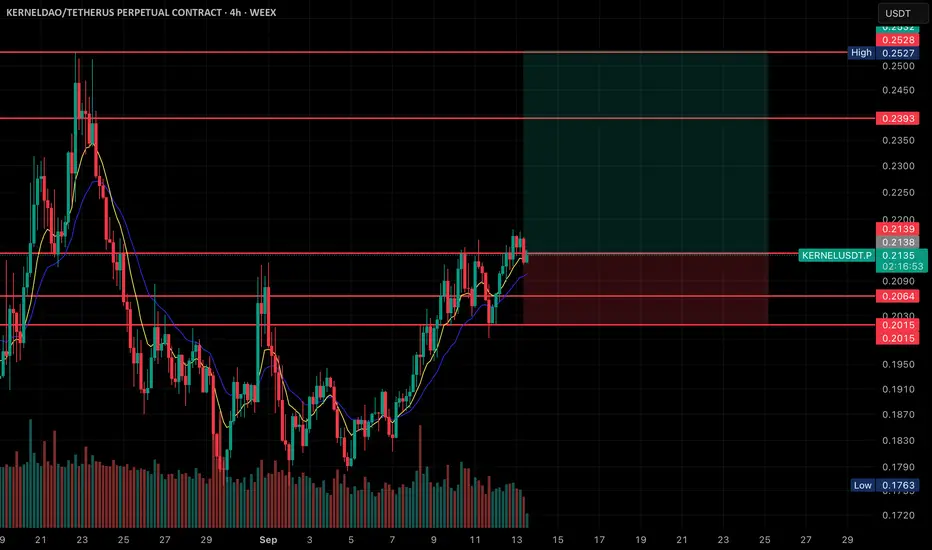
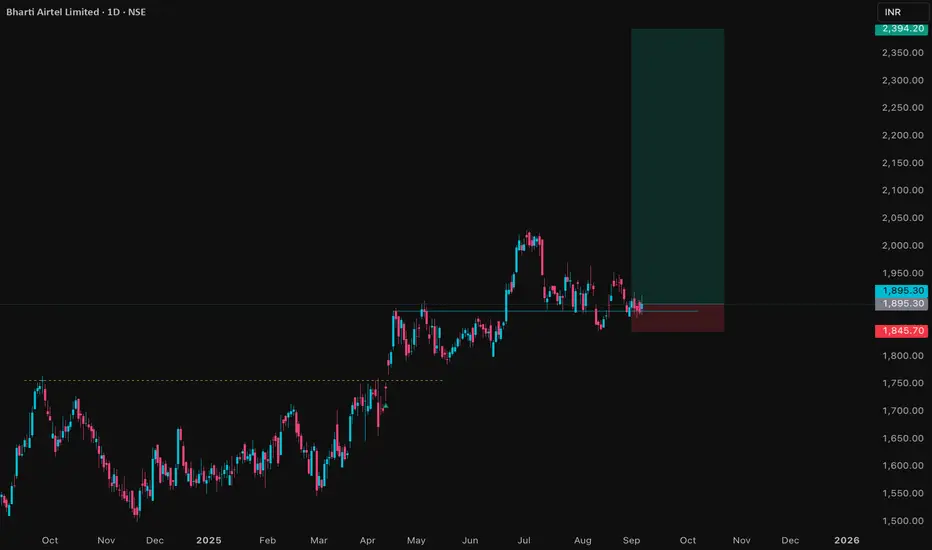
Kernel long idea• Pair/Timeframe: KERNELDAO/USDT Perpetual Contract, 4H chart (WEEX).
• Current Price: ~0.2133 USDT (slightly down −0.79%).
⸻
🔹 Market Structure:
• The price has been in a steady uptrend since early September, forming higher lows and pushing into resistance.
• Current movement shows consolidation near the 0.2139 zone, which was a previous resistance now acting as support.
⸻
🔹 Trade Setup (Highlighted Box):
• Entry Zone: Around 0.2133 – 0.2139.
• Stop-Loss: Below support levels, around 0.2040 – 0.2015.
• Target (Take-Profit): ~0.2393 – 0.2527, with the upper resistance being the main target.
• Risk-to-Reward: Favorable setup, as the potential upside is significantly higher than the defined downside.
⸻
🔹 Key Levels:
• Resistance Levels:
• 0.2139 (current breakout retest zone)
• 0.2393 (major resistance)
• 0.2527 (upper resistance / target area)
• Support Levels:
• 0.2064 (first support)
• 0.2040 (secondary support)
• 0.2015 (stop-loss zone)
• 0.1763 (major swing low)
⸻
🔹 Indicators:
• Moving averages (short-term) are aligned upward, supporting bullish continuation.
• Volume shows increased activity during the recent breakout, adding strength to the trend.
⸻
📈 Summary: The chart is showing a bullish continuation setup. As long as price holds above 0.2139 support, it has potential to rally toward 0.2393 – 0.2527. The stop-loss is well protected below 0.2040 – 0.2015.
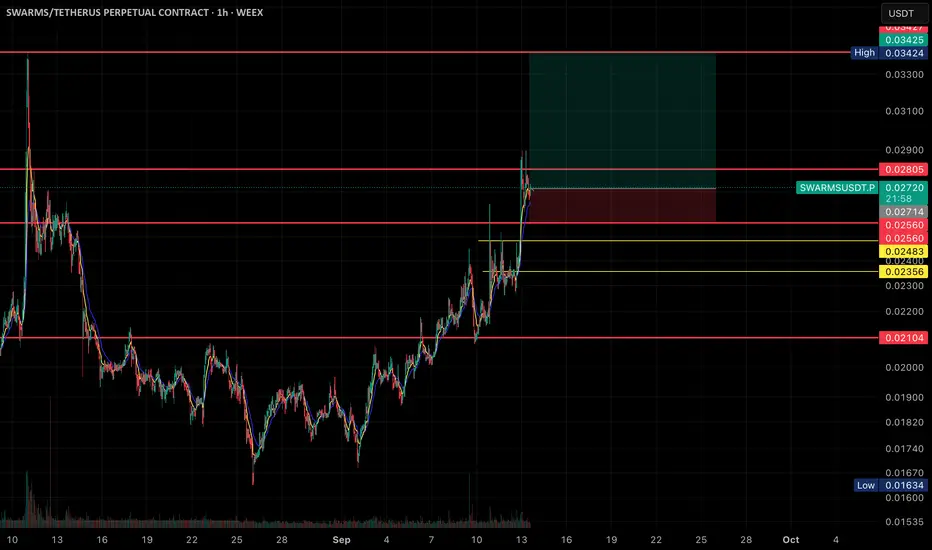
Swarms long ideaPair/Contract: SWARMS/USDT Perpetual Contract (1H timeframe, WEEX).
• Current Price: ~0.02719 USDT (+3.19%).
• Price Action:
• The chart shows a strong uptrend with higher highs and higher lows from early September.
• Price recently broke above a key resistance around 0.02714 – 0.02805, now acting as support.
• Setup:
• A long trade position is highlighted.
• Entry Zone: around current price (0.02719).
• Stop-loss: placed below the breakout zone, around 0.02560.
• Target Zone: ~0.03324 (upper resistance area).
• Support & Resistance Levels:
• Resistance: 0.02805, 0.03424.
• Supports: 0.02714, 0.02560, 0.02483, 0.02400, 0.02356, and a major support at 0.02104.
• Risk/Reward:
• The highlighted green/red box shows a favorable risk-to-reward ratio (larger upside potential vs downside).
• Indicators: Short-term moving averages are aligned upward, supporting bullish momentum.
📈 In summary: The chart is showing a bullish breakout setup where the price has pushed above resistance, with upside potential toward the 0.033+ zone, while stop-loss is set just below the breakout level.
GRSE Price ActionGarden Reach Shipbuilders & Engineers Ltd (GRSE) is trading at ₹2,581.90 as of September 13, 2025, marking robust momentum after a sharp rally in recent months. The stock opened at ₹2,370 and reached a session high of ₹2,586.40, comfortably near its 52-week peak of ₹3,538. Market capitalization stands at approximately ₹29,576 crore, indicating significant institutional and retail interest following active trading volumes.
The company’s annual revenue exceeds ₹3,300 crore, propelled by sustained order flow from the Indian Navy, Coast Guard, and growing export opportunities. Net profit margins and operating margins have shown improvement, with current operating margin around 16% and return on equity above 18%, signifying strong operational efficiency and effective cost control. Recent quarterly profits have confirmed consistent earnings growth, supported by a healthy order book and streamlined project execution.
Financially, GRSE maintains a solid balance sheet with low debt and robust cash flows, enabling regular dividend payouts and reinvestment in capacity expansion. The price-to-earnings ratio is moderately higher than sector averages, reflecting market optimism about continued order wins and timely delivery of key projects. Promoter holding remains stable, and increased institutional participation underscores confidence in long-term prospects.
Technically, the stock trades decisively above both its 50-day and 200-day moving averages, indicating sustained bullish momentum. RSI and MACD readings are in a strong trend zone, but not yet in overbought territory, suggesting further upside potential if sector tailwinds persist. GRSE’s outlook remains constructive, with earnings visibility supported by a growing pipeline and ongoing modernization initiatives in naval and defense shipbuilding.

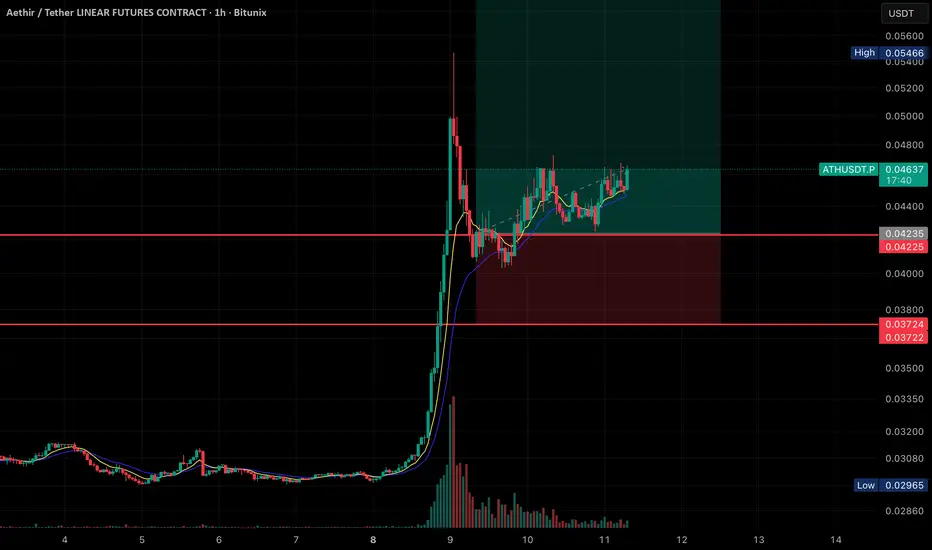
ATH/USDT Going for ATHHere’s the breakdown of what’s shown:
• Price Action:
The chart shows a massive spike in price on September 8th, followed by a retracement and consolidation phase.
Currently, the price is trading at 0.04634 USDT, with slight bullish movement (+1.58%).
• Indicators:
• Moving averages (likely EMA 9 & 21) are plotted, and the price is staying above them, showing bullish support.
• Volume spiked heavily during the breakout and has since decreased while consolidation is happening.
• Trade Setup (Highlighted Zone):
• Entry: Around the current price (0.0463 USDT).
• Stop Loss: Just below 0.0422–0.0423 support zone.
• Target Zone: Extends upward past 0.054 (previous high), indicating a long trade setup with a good risk-to-reward ratio.
• Support & Resistance:
• Support 1: 0.04225 – 0.04235
• Support 2: 0.03722 – 0.03724
• Resistance: 0.05466 (recent swing high)
👉 Overall, this looks like a bullish continuation setup after a breakout, with price consolidating in a higher range before a possible push toward the recent highs
OLAELEC Price ActionOla Electric Mobility Ltd is trading around ₹58.34 as of September 10, 2025. The stock has fluctuated between ₹57.40 and ₹60.79 through the session, with a previous close of ₹59.83. Market capitalization is approximately ₹25,700 crore. The share price has faced significant volatility, falling from a 52-week high of ₹123.90 down to a low of ₹39.60, and remains well below its all-time high.
Financially, Ola Electric continues to operate at a loss, reporting a negative trailing twelve-month EPS of -₹5.34 and an ROE of -108%, indicating unprofitable operations despite firm topline revenue. Annual net sales for FY25 are ₹4,514 crore, but operating profit and net profit remain negative due to heavy ongoing investments and interest expenses.
Key metrics on the balance sheet highlight low leverage (debt-to-equity ratio of 0.59) and a book value per share of ₹14.90, but the stock trades at 3.92 times its book value, indicating that valuation is stretched relative to fundamentals. No dividend has been declared, and recent large block stake sales from major investors have caused additional price swings.
Technically, Ola Electric is trading near its 20-day VWAP and remains highly liquid, with daily average trading volumes above 30 million shares. Momentum is subdued, and the near-term price action suggests more downside risk if selling pressure persists, with support seen near ₹55 and resistance close to ₹62. The outlook depends on the company’s ability to reverse losses and capitalize on India’s EV market growth amid challenging competitive and financial conditions.

SBI Card | Double Bottom Breakout | Bullish BiasSBI Card is showing signs of strength on the daily timeframe, completing a double bottom pattern, a classic bullish reversal setup. The stock is expected to close positively today around ₹830, confirming breakout intentions.
🔹 RSI is hovering near 60, indicating rising bullish momentum without being overbought.
🔹 The 20 EMA is sloping upward, reinforcing the short-term bullish trend.
🔹 Watch for resistance near ₹880, which coincides with a falling window gap — a likely profit-booking and supply zone.
📌 Key Levels:
Breakout above ₹830 can trigger momentum towards ₹880.
₹880 remains a crucial level to watch for follow-through or rejection.
🔔 Keep an eye on volume confirmation to validate the breakout.

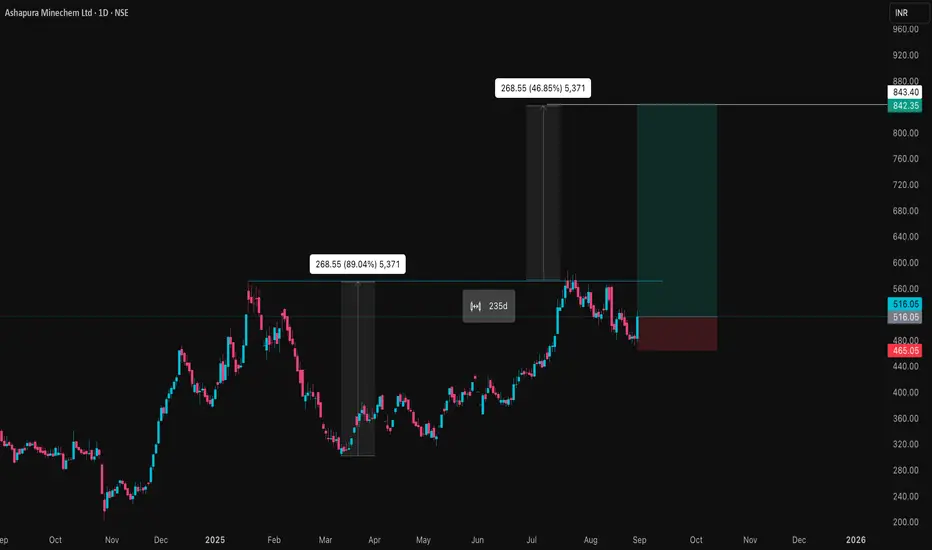
ASHAPURMIN Price ActionAshapura Minechem’s share price as of August 31, 2025, is trading near ₹514, continuing a strong uptrend that has seen a remarkable rise of nearly 49% in the past six months. The stock has moved from a 52-week low around ₹200 to a high of ₹587, driven by exceptional financial results and robust business momentum in both domestic mineral solutions and bauxite exports from Guinea.
Recently reported quarterly results show income from operations of over ₹1,355 crore and profit before tax of about ₹132 crore, up more than 100% year-on-year. Net profit and earnings per share have also seen healthy growth, and the company’s operating profit to interest ratio has hit a five-quarter high, indicating improved ability to manage debt. The debt-equity ratio is now under one, further signaling financial stability.
Valuation remains attractive with a price-to-earnings ratio of approximately 14 and a price-to-book ratio of just 0.25, suggesting there could be further room for appreciation if growth sustains. Technical signals remain bullish as the stock continues to trade above major moving averages, with strong volume supporting recent price action. Overall, Ashapura Minechem combines solid fundamentals and a positive growth outlook, appealing to investors looking for small-cap mineral sector exposure.
SOMI 1H LONG Set upCurrent Price: Around 1.5764 USDT, trading slightly bearish (-4.51%).
• Setup:
• A long trade setup is marked with risk/reward box (green zone above, red zone below).
• Entry Zone: Around 1.56 – 1.58 USDT (current price).
• Stop-Loss (SL): Around 1.55 – 1.42 USDT (marked red levels).
• Target (TP): Around 2.50 USDT (green box top).
• Key Levels:
• Resistance 1: 1.80
• Resistance 2: 1.89 – 1.90 (previous high)
• Major Target: 2.50
• Support Zone: 1.55 – 1.42
• Indicators:
• Moving averages (short-term) are shown, price is consolidating around them.
• Volume is relatively higher before consolidation, suggesting accumulation.
📌 Summary:
This chart shows a bullish setup with a long entry around the current consolidation zone (1.56–1.58). If price holds above 1.55, potential upside target is 2.50. But if it breaks below 1.55, downside risk extends to 1.42.

BHARTIARTL Price ActionBharti Airtel is trading near ₹1,887 as of September 8, 2025, maintaining its leadership position in India’s telecom sector with robust price performance and sector-beating fundamentals. The company’s market capitalization has surpassed ₹11 lakh crore, and it continues to deliver consistent growth in sales, profits, and shareholder value.
The most recent quarterly results showed net profit rising 43% year-on-year to ₹5,948 crore, fueled by a 28% surge in consolidated revenue. Average revenue per user (ARPU) climbed to ₹250, underlying the continued strength in data consumption and premium pricing. Operating profit margins have expanded, with latest EBITDA at ₹28,167 crore and an impressive 56.9% margin.
On the technical front, the stock trades above its 50-day and 200-day moving averages, indicating a sustained bullish trajectory. Return on equity is currently 23%, a result of effective capital allocation and profitability. Despite a slight dip in promoter shareholding, institutional confidence remains high with solid trading volumes.
Bharti Airtel remains focused on network expansion, digital services, and international growth, particularly its profitable Africa operations. Its sound balance sheet, controlled debt, and resilient free cash flow provide ample scope for ongoing investments and dividends. The outlook remains strongly positive, with the company well-positioned to capture further growth in India’s expanding communications market.
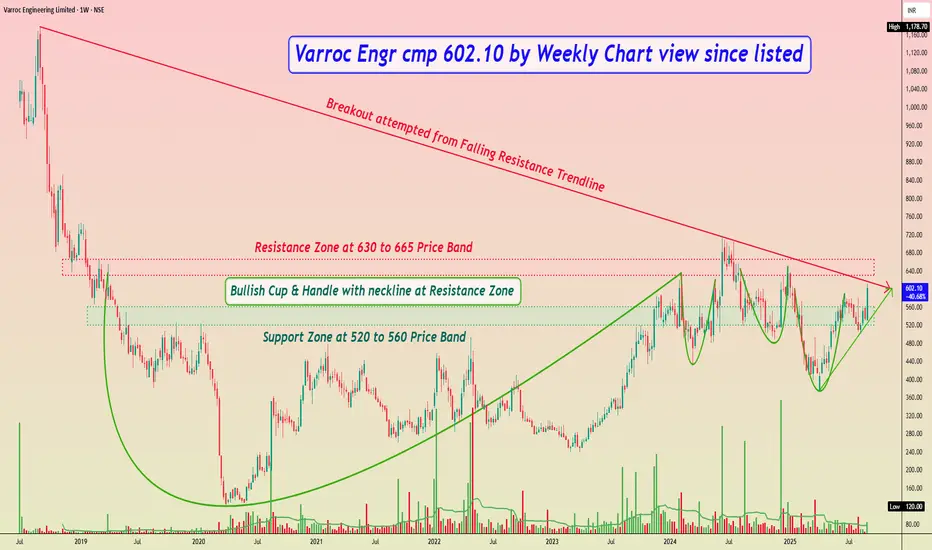
Varroc Engr cmp 602.10 by Weekly Chart view since listedVarroc Engr cmp 602.10 by Weekly Chart view since listed
- Support Zone at 520 to 560 Price Band
- Resistance Zone at 630 to 665 Price Band
- Breakout attempted from Falling Resistance Trendline
- Bullish Cup & Handle with neckline at Resistance Zone
- Bullish Rounding Bottoms also formed by Resistance Zone neckline
- Heavy Volumes based Breakout on Daily Chart after Support Zone testing retesting
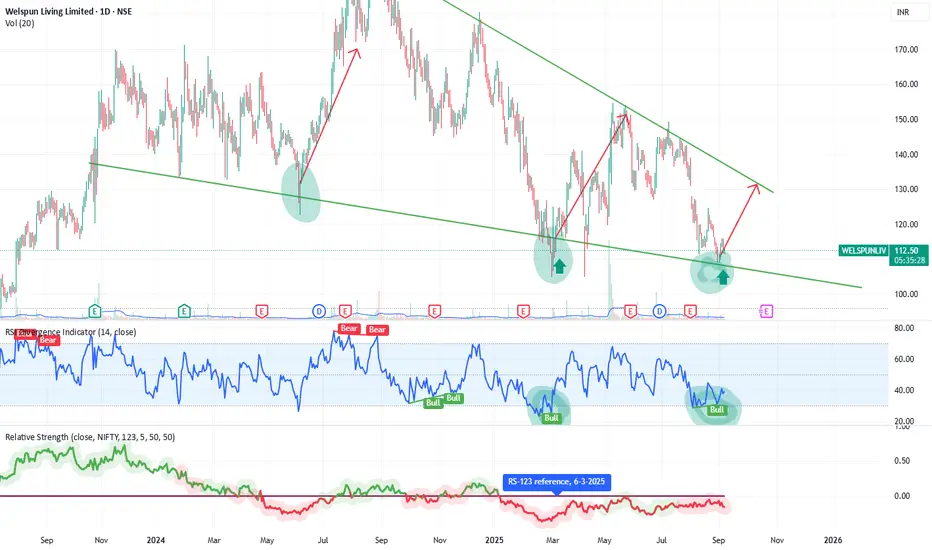
Welspun Living – Bullish Reversal | Swing Trade SetupWelspun Living (NSE: WELSPUNLIV) is showing a potential bullish reversal after bouncing off a long-term descending trendline support. This level has previously triggered strong upward swings.
The chart also shows a bullish RSI divergence, indicating waning selling momentum. A breakout above immediate resistance (~₹115–₹117) could lead to a swing move towards ₹125–₹130.
Key support lies at ₹105. Watch for volume confirmation and RSI strength for entry validation. 📈
Please note : This chart reflects my analysis only—not a trading recommendation. Always conduct your own research before acting and consider your risk tolerance. You’re responsible for your own investment decisions.
SAGAR CEMENT BULLISH CHART DON'T HAVE TIME TO MANAGE YOUR TRADES?
Sagar Cement given good breakout. Its given breakout after good consolidation. It's given breakout after rounding pattern . We can see 5 -6% Upmove easily.
Take BTST trades at 3:25 pm every day
Try to exit by taking 4-7% profit of each trade
SL can also be maintained as closing below the low of the breakout candle
Now, why do I prefer BTST over swing trades? The primary reason is that I have observed that 90% of the stocks give most of the movement in just 1-2 days and the rest of the time they either consolidate or fall
Trendline Breakout in SAGCEM
BUY TODAY SELL TOMORROW for 5%

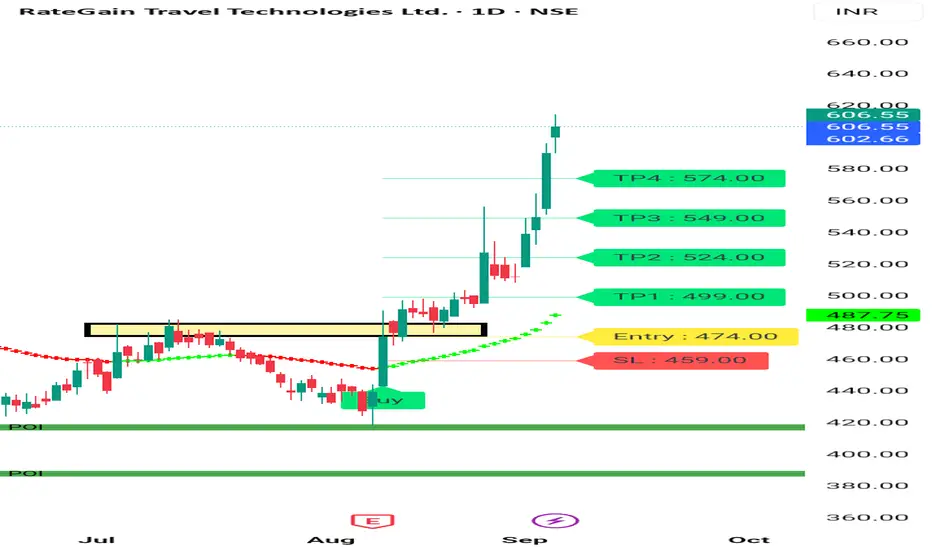
RATE Gain Bullish Structure Rate Gain is Given Good Breakout Above 485 From 485 it's moved to 600 . It's All Time High is 897 . It's given Weekly Breakout also . Ist Daily Rsi above 80 , it has to take Retracement Before Further Movement. It may move to 800 Levels in next 3 -6 months . Wait for Good Risk Reward. At Current price not good entry .who have already they can Trial SL .
For more information Watch my Profile . Always Trade with SL. No trade without Stoploss.
Consult your financial advisor before making any position in stock market.
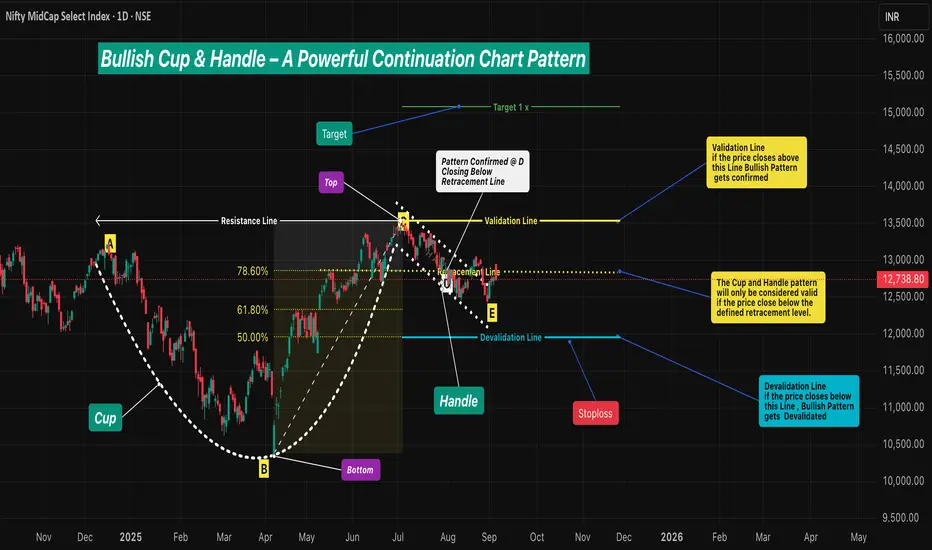
Bullish Cup & Handle – A Powerful Continuation Chart Pattern🔹 Intro / Overview
☕ The Cup and Handle is a 📈 bullish continuation pattern often studied in technical analysis.
⚔️ It forms when there is a fight between bulls 🐂 and bears 🐻 — the Cup develops as both remain strong.
📉 During the Handle, sellers 🛑 temporarily gain strength.
📈 But when price closes above the Validation Line, buyers regain control 💪 and bullish momentum dominates.
____________________________________________________________
📖 How to Identify
✅ Validation → The pattern is valid if price closes above the Validation Line.
❌ Devalidation → The pattern is invalid if price closes below the Devalidation Line(before Validation).
📉 Retracement Rule →The pattern is only confirmed if the price closes below the Retracement Line during the Handle formation.
This ensures a proper pullback forms before breakout .
____________________________________________________________
📖 Key Points of Pattern
✅ A valid Cup requires the retracement condition — confirmation occurs only if price closes below the Retracement Line .
⚖️ Balanced Highs → Point A (left peak) and Point C (right peak) should be relatively close in price, ensuring a proper Cup shape 🍵.
🔒 The Handle must not break the structural integrity of the Cup.(No Close Below Devalidation Lines)
____________________________________________________________
🎯 Trading Plan (Educational Only)
📌 Entry → Considered only after confirmation when price closes above the Validation Line.
🛡️ Stop-Loss (SL) → After validation, the Devalidation Line may act as an SL.
🎯 Target (TP) →
First Target → 1R (equal to the risk defined by Entry–SL distance).
Remaining Lots → Trail using ATR, Fibonacci levels, Box Trailing, or structure-based stops.
____________________________________________________________
📊 Chart Explanation
🍵 The Cup forms with a rounded base Point B and two balanced tops: Point A (left peak) & Point C (right peak) - The marginal price difference should be small to ensure a reliable Cup.
📈 The Retracement Line ( Point D ) confirms the pattern only if price closes below the Fibonacci Level of 78.60% and above the 50.00% .
📉 The Handle develops as price pulls back, with Point E marking the Handle low. and Good Handle of Cup is Formed (this low should not go below 50.00% Level )
📏 The Fibonacci retracement levels are drawn from Point B (Cup base) to Point C (right peak). These levels provide a reference framework to observe Retracement (minimum 78.60%) , Validation (100.00%) , and Devalidation (50.00%) areas for educational study of the structure.
____________________________________________________________
👀 Observations
✨ Works best after a strong uptrend 🚀 or at major support–resistance zones 🧱.
⚖️ A balanced Cup (Top Right ≈ Top Left) improves reliability.
📏 Handle Formation
The Handle should be shorter than the Cup depth — and should also be longer than the required minimum depth for proper structure.
If the Handle is too deep, it weakens the setup — and also if it is too short, the formation loses reliability.
____________________________________________________________
❗ Why It Matters
🔍 Shows the market battle between buyers and sellers.
💪 Highlights how buyers regain dominance after retracement validation.
⚖️ Balanced structure + strict rules = better filtering of weak setups.
📝 Provides clarity on entry, SL, and TP with a structured framework.
____________________________________________________________
🎯 Conclusion
The Cup and Handle pattern, when validated through Fibonacci retracement rules 📉, balanced highs ⚖️, and proper Handle structure 🔒, offers a disciplined framework for studying bullish continuation setups.
🔥 Patterns don’t predict. Rules protect.
____________________________________________________________
⚠️ Disclaimer
📘 For educational purposes only.
🙅 Not SEBI registered.
❌ Not a buy/sell recommendation.
🧠 Purely a learning resource.
📊 Not Financial Advice.
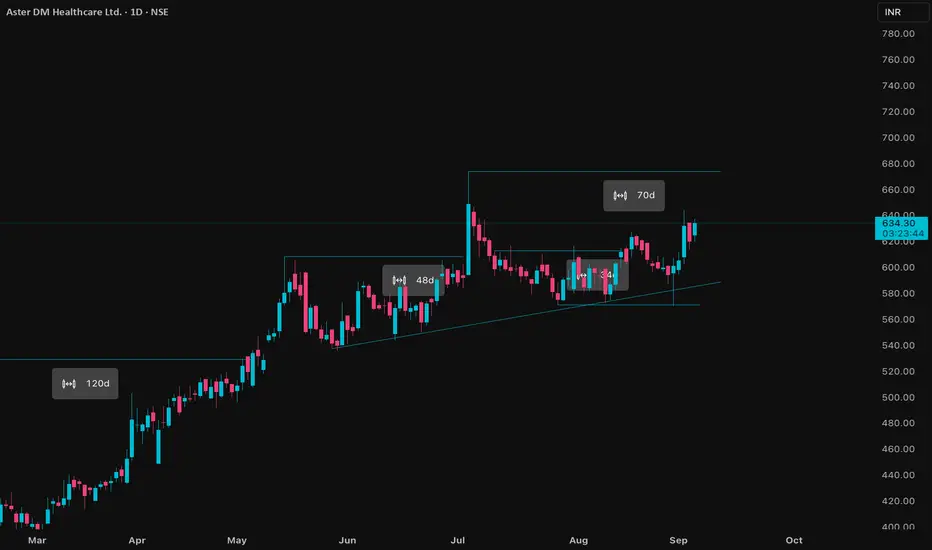
ASTERDM Price ActionAster DM Healthcare is trading around ₹632–₹634 as of September 4, 2025, and has shown solid resilience and upward movement over recent sessions. The company’s market capitalization stands at about ₹32,122 crore, and its current price-to-book ratio is roughly 9.4, reflecting growth expectations and sector strength.
Recent financial results highlight substantial improvement: Q1 FY26 revenue reached ₹1,078 crore, up 8% year-on-year, and consolidated net profit for the quarter is ₹85.52 crore, maintaining momentum following last year’s major gains from the strategic disposal of its Gulf business. The EBITDA margin for FY25 has strengthened, averaging 19.5%, due to increased patient volumes and operational efficiency. For the whole of FY25, revenue grew 12% to ₹4,138 crore, and net profit posted a strong jump to over ₹5,400 crore with strategic gains from the GCC business separation.
Balance sheet analysis shows rising book value and a stable asset base, indicating ongoing capital investment and sector expansion. Total expenses have grown moderately, while EBIT and PAT both reflect favorable YoY growth, with EBIT up 30% for the recent period. Trading volumes are steady, and the price action is currently above key moving averages, supporting a bullish technical outlook.
Aster DM Healthcare’s positive trend is backed by solid quarterly results, sector tailwinds, and strategic realignment of its international operations. Investors remain optimistic for further medium-term gains if the company sustains improved margins and expanding patient demographics.
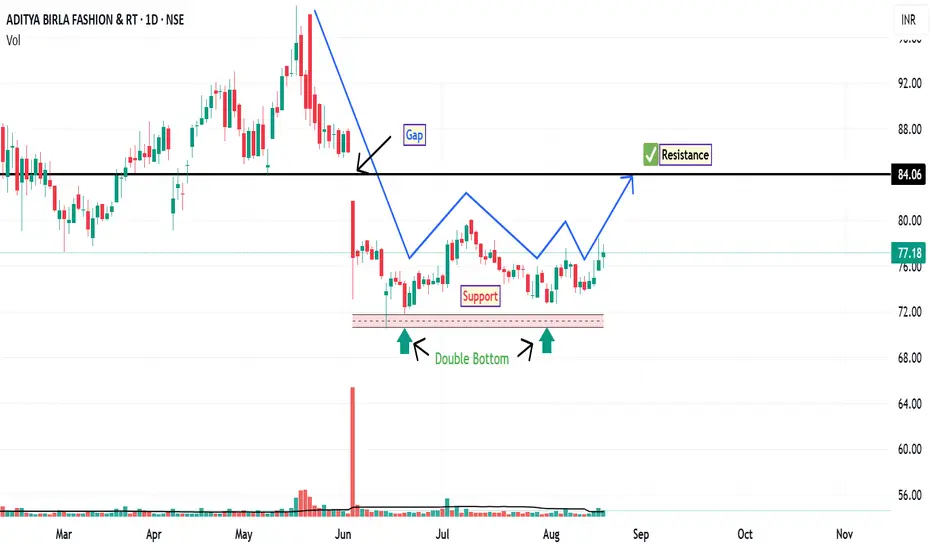
ABFRL: Price Action OverviewFollowing a gap-down opening on June 4, ABFRL entered a consolidation phase, trading within a well-defined supply and demand zone. This range-bound movement suggests a period of accumulation or indecision among market participants. During this consolidation, the stock has formed a double bottom pattern on the daily chart—a classical reversal structure that often indicates a potential shift from a downtrend to an uptrend, provided confirmation follows.
An inverted hammer appeared near the second bottom, signaling potential buying interest at lower levels. This was followed by a bullish pin bar, reinforcing the possibility of a short-term reversal. These candlestick formations, especially when occurring near support zones, can be interpreted as early signs of bullish momentum returning—though follow-through price action is essential.
If bullish momentum sustains than the stock may attempt to fill the gap left from the June 4 session. The gap resistance level is around ₹84 , which could act as a near-term target for traders monitoring this setup.
Disclaimer: This analysis is for educational and informational purposes only. It does not constitute investment advice or a recommendation to buy, sell, or hold any security. Always conduct your own research or consult a licensed financial advisor before making investment decisions.
SAIL (Bird view) By KRS Charts28th May 2025 / 10:17AM
Why SAIL??
1. As we can see from above chart, it clearly turning Bullish Trend stock from Berish .
2. Fundamentally its Durable and is at decent valuation right now.
3. Technically, in 1D TF fake selling and Gap Down is visible showing sellers got trapped. Such move market gives when they need liquidity, and this can happen both the side.
4. Further Bullish traits Sell candles volume is getting lower and allover lower than bullish candles. which usually noticed when Stock turned bullish on bigger cycles.
5. 100 EMA is underneath in many significant timeframes which also indicates buyers had shown more interest in past and likely this time as well.
Targets and Stop Loss is mentioned in Chart.
Note: This is 1M TF view will be Medium to Long Term

NMDC By KRS Charts9th June 2025 / 19:01
Why NMDC?
1. Dow Theory , it turned into Bullish Trend with Higher Highs & Higher lows.
2. Huge Accumulations since many Years and as I said above HHs & HLs.👆
3. In major timeframes stock is above 100EMA which is sign that more upside might possible.
4. Wave counts are picture perfect with more than 0.618 retracement for wave(2) and Reversed to upside from 0.5 Retracement between wave(2) & wave4 bottom points.
Targets & SL is mentioned in Chart.
NSE:NMDC NSE:CNXMETAL
