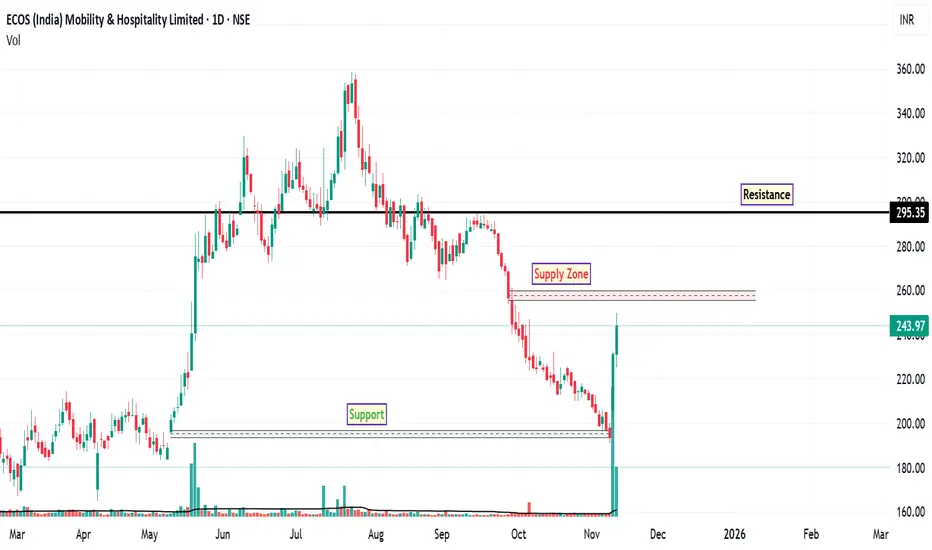
ECOSMOBLTY: Potential Reversal SignalsThe daily chart of ECOSMOBLTY indicates early signs of a possible bullish reversal following a prolonged bearish trend. Recent price action suggests renewed buying interest, supported by multiple technical factors.
The stock has rebounded from a long-term support level near ₹191 , accompanied by higher-than-average trading volume. This combination often signals increased market participation and potential trend reversal.
A bullish crossover on the MACD has been observed on the daily timeframe. This momentum-based indicator often suggests a shift from bearish to bullish sentiment when confirmed by price and volume.
The RSI has moved above 62, indicating strengthening bullish momentum. While not yet in overbought territory, this level reflects improving trend strength.
There is a notable supply zone around ₹257 , which may act as an interim resistance. Price could consolidate or retrace near this level before attempting further upward movement.
Immediate Resistance: ₹257 (potential supply zone)
Major Resistance: ₹295 (historical level based on prior price action)
Support Zone: ₹191 (long-term support and invalidation level for bullish setup)
Disclaimer: This analysis is intended for educational and informational purposes only. It does not constitute investment advice or a recommendation to buy, sell, or hold any financial instrument. Market participants should conduct independent research and consult with a licensed financial advisor before making any investment decisions.
Bullishreversal
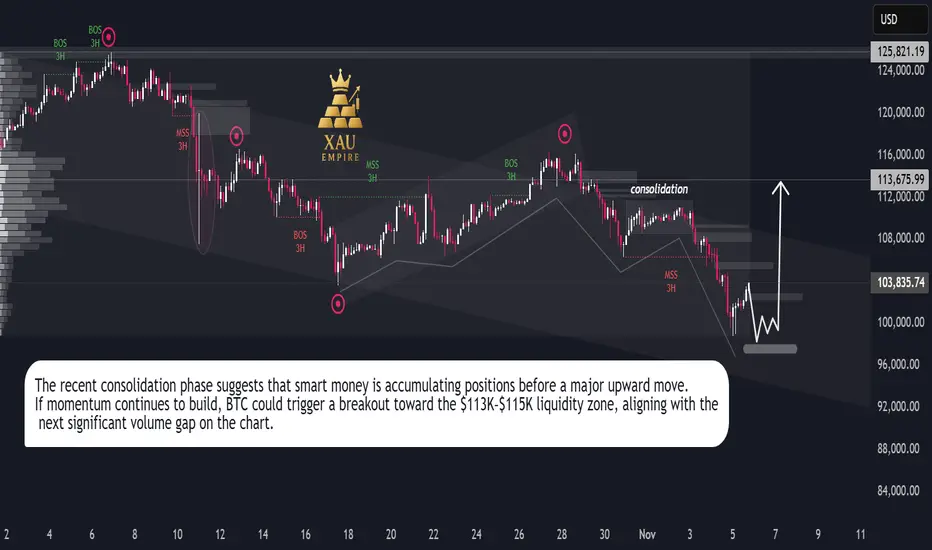
Bitcoin Bulls Target $113K**Bitcoin (BTC/USD) Analysis — November 2025**
Bitcoin has been moving within a controlled downtrend channel, facing continuous lower highs since late October. The market recently went through a **liquidity sweep**, followed by a minor **market structure shift (MSS)** on the 3-hour timeframe. This suggests exhaustion in the current bearish leg.
After a period of **sideways consolidation**, price is testing a strong accumulation zone near the **$100K–$97K** region. This zone aligns with prior demand and high-volume nodes, making it a potential base for a bullish reversal.
A clean rebound from this level could drive Bitcoin toward the **$113K–$115K** area, where the next liquidity cluster sits. If buyers regain momentum, this move could accelerate into a **V-shaped recovery**, confirming the start of a fresh mid-term bullish cycle.
Overall sentiment remains **bullish**, supported by renewed buyer activity and potential macro-driven inflows ahead. Traders should watch for volatility spikes as the market transitions from accumulation to breakout mode.
**Key Takeaway:**
BTC is stabilizing near key demand, eyeing a rebound toward $113K+. Momentum confirmation above the short-term consolidation zone could trigger a strong upward continuation.
**#Bitcoin #BTCUSD #CryptoAnalysis #BitcoinForecast #BTCPricePrediction #CryptoTrading #BullishReversal #CryptoMarket #TradingViewAnalysis**
INTELLECT Price ActionAs of **October 24, 2025**, **Intellect Design Arena Ltd (NSE: INTELLECT)** closed at **₹997.95**, gaining around **3.6%** from the previous close of ₹963.50. The stock opened at **₹965.00**, reached a **high of ₹1,008.00**, and a **low of ₹950.50**, supported by a trading volume of about **4.01 lakh shares**.
The company’s **market capitalization** stands around **₹13,760 crore**, with an **EPS of ₹25.05** and a **P/E ratio near 39.8**, suggesting a moderate premium valuation compared to the IT sector average. The **50-day moving average** is around ₹985, and the **200-day moving average** near ₹925, indicating a continued uptrend in both short-term and medium-term momentum.
From a technical perspective, the stock shows signs of strength after recent consolidation between ₹940 and ₹995. The **RSI level at ~60** supports sustained positive momentum without nearing the overbought zone. **Immediate support** lies near ₹970–₹975, while **resistance** is placed at ₹1,010–₹1,025. If the stock sustains above ₹1,010, it could aim for the next target range of ₹1,050–₹1,080.
In the broader outlook, **Intellect Design Arena** remains fundamentally strong with consistent revenue growth in digital banking and fintech solutions. Robust margins, recurring international contracts, and growing adoption of its AI-driven platforms reinforce a bullish medium-term trend, though investors should watch for consolidation near ₹970 as a potential accumulation zone.

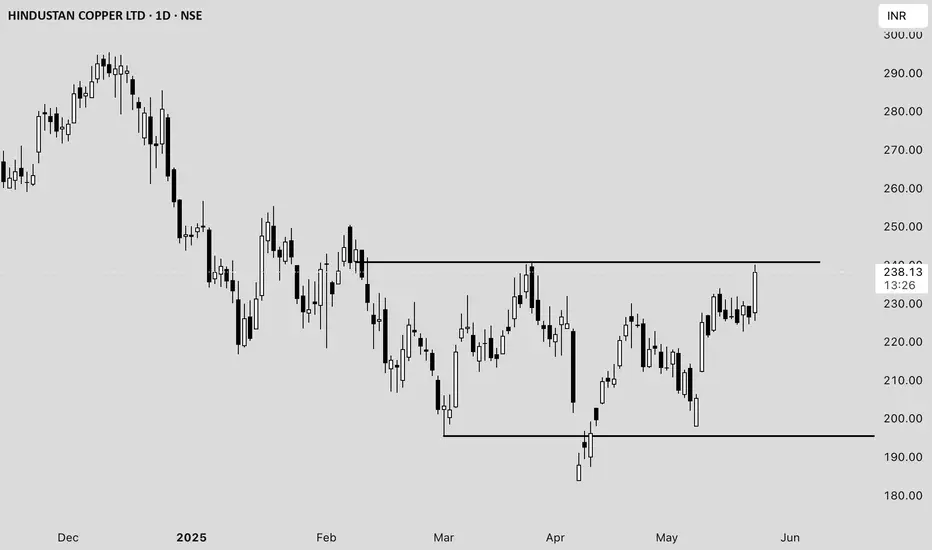
Hindustan Copper Ltd. (HINDCOPPER) Price Analysis **Date:*#### **Current Price and Intraday Movement**
- **Latest Price:** ₹237.98 (+5.09% / +₹11.52)
- **Day’s Range:** ₹225.50 – ₹240.10
- **Open:** ₹227.60
- **Previous Close:** ₹226.46
- **Volume:** 1.63 crore shares (well above average daily volume of 55.89 lakh)
#### **Technical Overview**
- **52-Week Range:** ₹183.82 – ₹381.90
- **50-Day Average:** ₹216.99
- **200-Day Average:** ₹260.58
- **Market Cap:** ₹23,013 crore
- **P/E Ratio:** 57.48
- **EPS:** ₹4.14
#### **Recent Performance and Trends**
- **Short-Term Trend:** The stock surged over 5% today, outperforming its sector and showing strong buying interest .
- **Volume Spike:** Today’s volume is nearly triple the average, indicating heightened trader participation .
- **Technical Position:** The stock is trading above its 50-day moving average but remains below the 200-day average, suggesting a recovery from recent lows but still under medium-term resistance .
- **Support/Resistance:** Immediate resistance is near ₹240–₹249 (upper circuit), with support at ₹225 and ₹216 (50-DMA) .
#### **Fundamental Snapshot**
- **Valuation:** High P/E ratio (57.48) signals expensive valuation relative to earnings .
- **Profitability:** EPS at ₹4.14; profit margins have been under pressure.
- **Industry Position:** Hindustan Copper is India’s primary copper producer, with exposure to global copper price trends and domestic infrastructure demand.
#### **Outlook**
- **Short-Term:** Strong momentum and volume could drive further upside if it breaks above ₹240, but overbought conditions may trigger profit booking near resistance.
- **Medium-Term:** Needs to sustain above the 200-DMA (~₹260) for a confirmed trend reversal.
- **Risks:** High valuation and recent volatility; global commodity price swings can impact earnings.
---
**Summary:**
Hindustan Copper is showing robust short-term momentum with strong volume and price gains, but faces resistance near ₹240–₹249. The stock remains fundamentally expensive, and investors should watch for sustained moves above the 200-DMA for a longer-term bullish signal .
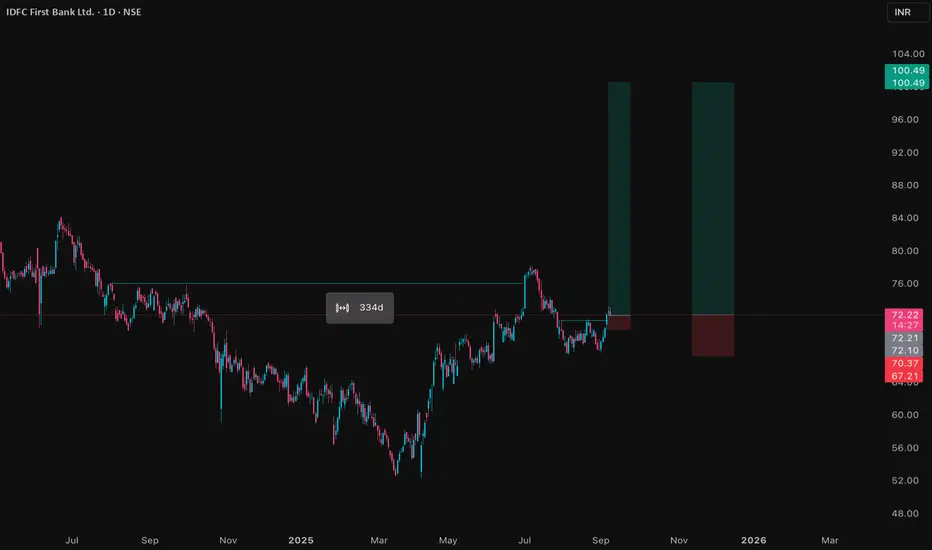
IDFC First (D) - High-Volume Breakout Confirms Bullish ReversalAfter a significant downtrend from its All-Time High in September 2023, IDFC First Bank has been in a clear trend reversal since April 2025. This new uptrend has just been powerfully confirmed by a high-volume breakout, signaling strong buyer commitment.
This Week's Decisive Breakout
The past week has been pivotal for the stock, culminating in a decisive technical event:
- Massive Weekly Volume: The stock has surged +9.85% so far this week, supported by an enormous total volume of 207.92 million shares .
- Today's Confirmation: Today's session (Thursday, October 23, 2025) saw a +2.85% gain on a massive 94.12 million shares, confirming the bullish conviction.
- Key Resistance Breach: Most importantly, the stock broke out and closed above a key short-term horizontal resistance trendline that had been in place since July 2025.
Broad-Based Technical Strength
This bullish price action is strongly underpinned by a powerful alignment of momentum indicators across all major timeframes (Monthly, Weekly, and Daily):
- Short-Term EMAs: All three timeframes are in a bullish Positive Crossover (PCO) state.
- RSI (Relative Strength Index): The RSI is also in a rising trend on all three timeframes.
This multi-timeframe alignment indicates that the bullish momentum is broad, synchronized, and strengthening.
Outlook and Key Levels to Watch
With the resistance now cleared, the path of least resistance has shifted upwards.
- Bullish Target: If this bullish momentum continues, the next logical area of resistance and potential target is the ₹90 level.
- Critical Support: The recently broken resistance now becomes the most critical new support level. A successful retest of this level would be a strong sign, while a failure to hold it would be a warning. A deeper support level exists at ₹70 , but the immediate focus should be on the new breakout zone.

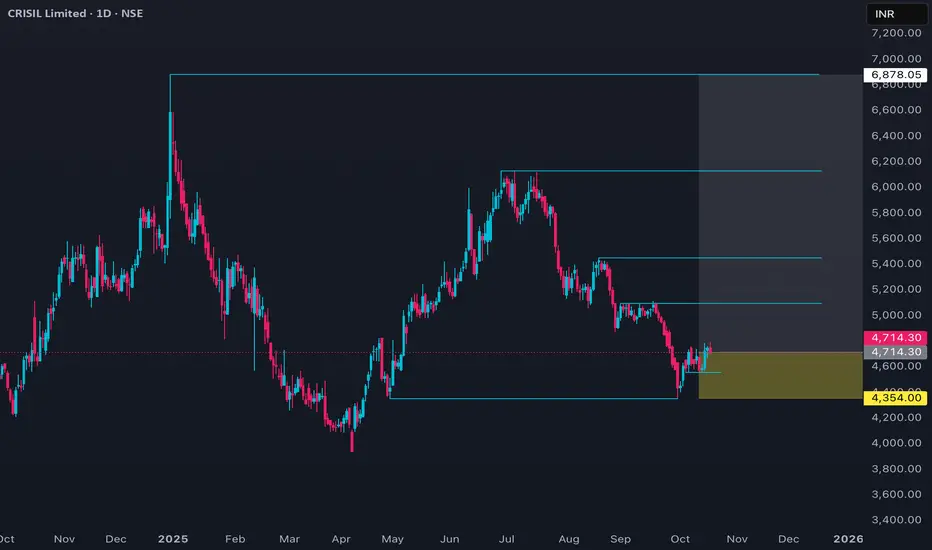
CRISIL Price actionCRISIL Limited traded mildly negative on October 18, 2025, closing near ₹4,695 after slipping about 0.7% intraday from an open around ₹4,770. The day’s range was between ₹4,694 and ₹4,781, maintaining consolidation below its recent resistance zone near ₹4,800. The stock’s 52-week range stands between ₹3,894 and ₹6,955, showing it remains in a mid-range retracement from its highs earlier in the year.
The current trailing 12-month EPS is approximately ₹99.3, giving a P/E ratio near 47, which aligns with its longer-term valuation band. The 50-day moving average (~₹4,965) and 200-day MA (~₹5,115) remain above current levels, indicating medium-term bearish momentum. Volumes were subdued, suggesting a lack of strong directional conviction.
Overall, CRISIL’s short-term trend is sideways-to-weak, facing resistance around ₹4,780–₹4,820 and finding interim support near ₹4,670 followed by ₹4,600. Sustained closes above ₹4,820 could revive buying momentum, while a break below ₹4,600 may invite further correction toward ₹4,450. The technical bias remains neutral until there’s a decisive move outside this consolidation band.
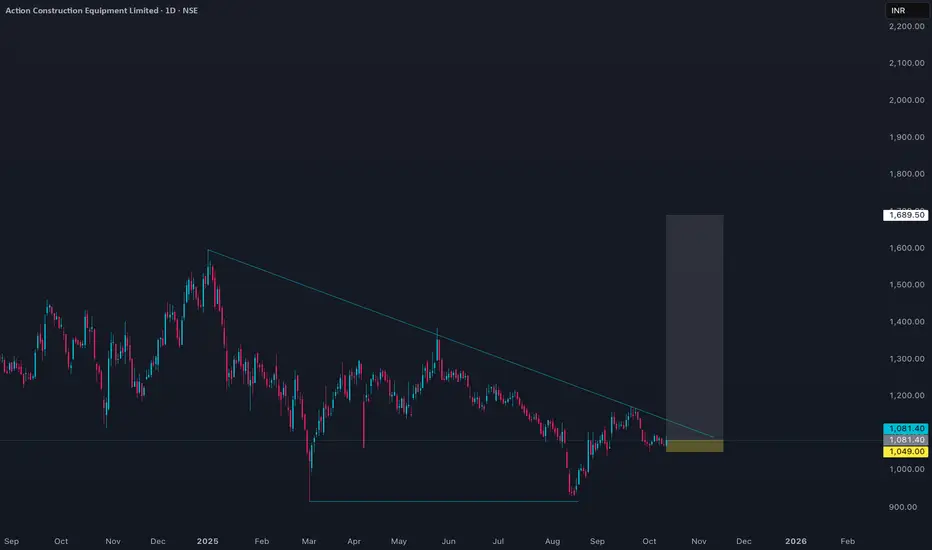
ACE Price Action with probable 18R trade set up- Current Price: Around ₹1,081 as of October 2025.
- Market Capitalization: Approximately ₹12,870 Crores.
- 52-week Range: The stock traded between ₹917 and ₹1,600 in the past year.
- PE Ratio: Roughly 31, indicating moderate to high valuation relative to earnings.
- EPS: Around ₹34.4 (TTM).
- Price-to-Book Ratio: About 8, suggesting a premium valuation relative to its book value.
- Dividend Yield: Low, approximately 0.19%.
- Revenue and Profit: Latest annual revenue near ₹3,245 Crores and net profit around ₹423 Crores.
- Price Trend: The stock has faced some downside pressure recently with a 19% decline over the last year but historical performance showing strong growth over 3-5 years.
- Volatility: The stock is moderately volatile, about 3.2 times more than the Nifty index.
- Sector: ACE operates in the heavy machinery and industrial equipment sector, showing good profitability and efficiency metrics with consistent earnings growth.
Overall, ACE trades at a premium valuation reflecting growth expectations but recent price corrections indicate some caution in the market. The company shows good fundamentals with strong earnings growth potential balanced against sector cyclicality and market volatility.
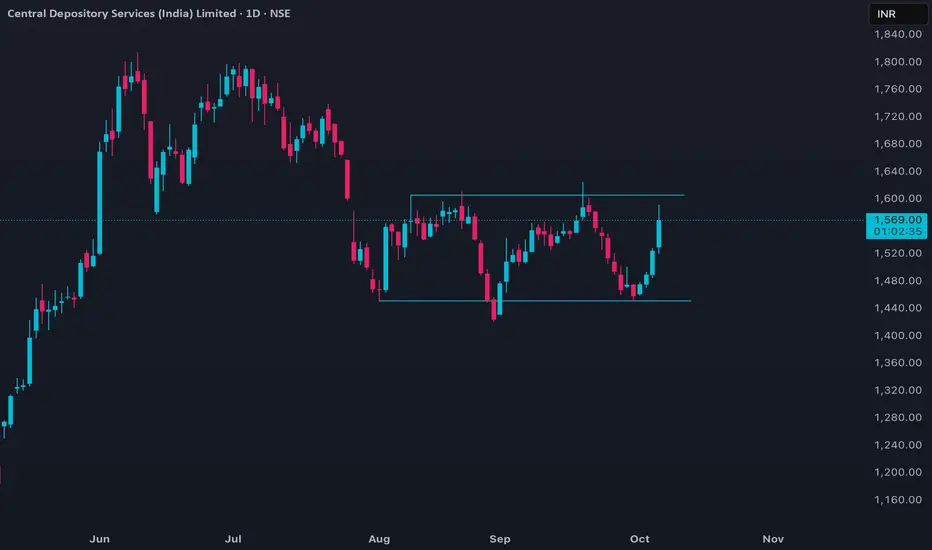
CDSL Price ActionCDSL opened the session with strong buying interest and surged nearly 3% in early trade, reflecting robust momentum and outperforming broader sector trends. The stock is currently trading around 1,570, after touching an intraday high near 1,592 and respecting support at 1,520. Volumes are significantly above the recent average, indicating active participation from both institutional and retail traders.
On the technical front, CDSL continues to trade above its 50-day and 200-day moving averages, maintaining a mildly bullish trend as confirmed by momentum oscillators. The daily charts exhibit a series of higher lows, and the stock has rebounded from its recent base near 1,450. Key resistance is seen at 1,625; a breakout above this zone could trigger a further rally toward 1,800. Immediate support for short-term traders lies at 1,535, and any dip toward this zone may see strong buying interest.
Technically, mixed longer-term indicators suggest some caution—while the RSI remains bullish and the overall trend is favorable, weekly signals like MACD show mild bearishness, indicating some volatility. Still, the overall bias remains positive as long as the price sustains above key support levels, making CDSL a favored pick in the capital market sector for the near term.
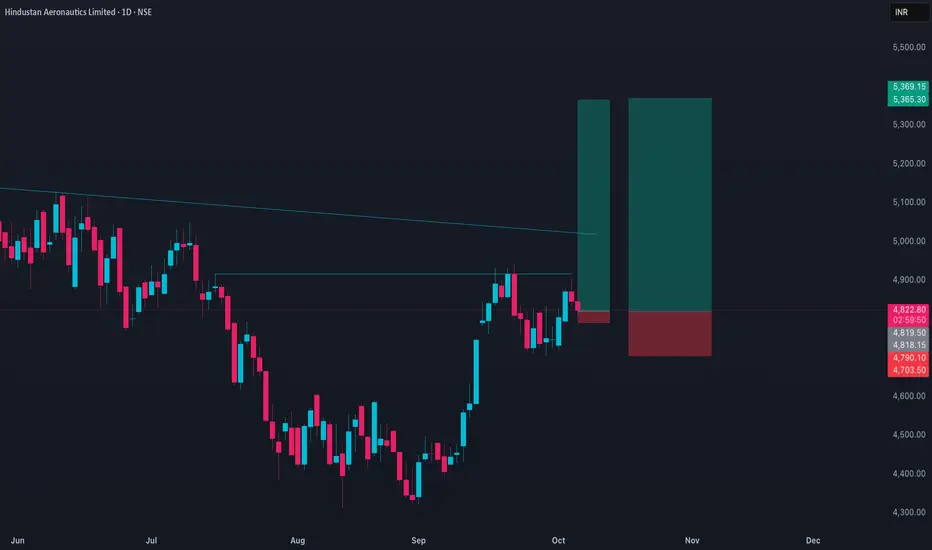
HAL Price ActionHindustan Aeronautics Limited (HAL) opened the day strong, continuing its upward momentum from the previous sessions. The stock traded above key moving averages, indicating sustained bullish sentiment. Early in the session, the price held above recent swing lows, and mild intraday retracements provided support zones for buyers.
On the technical side, HAL maintains a higher-high, higher-low structure on the daily chart, signifying that buyers are still in control. Volumes are stable, and no signs of distribution are visible so far. If the price sustains above the short-term support near recent intraday lows, further upward movement is likely. Any breakdown below immediate support could trigger a short-term pullback; however, medium-term outlook remains positive as long as the price holds above its last consolidation base.
COCHINSHIP Price ActionCOCHINSHIP exhibited steady price action today, maintaining a balanced trading range through most sessions. After opening with an initial minor uptick, the stock displayed mild volatility, oscillating within a narrow band and avoiding any sharp declines. Resistance was noted near recent highs, with persistent supply seen above that level, while dips found buyers at established support zones. Volume activity remained moderate, neither confirming nor rejecting direction bias. The intraday candlestick structure suggested a neutral to mildly bullish undertone, backed by consistent demand at lower bands. Overall, price sentiment favored gradual accumulation rather than aggressive breakout or reversal characteristics.

DELHIVERY Price ActionDELHIVERY has recently displayed a stable performance, with its stock trading in a tight range after recovering from previous lows. The price trend shows higher support levels indicating accumulation, while minor pullbacks have led to renewed buying interest. The company’s operational strengths in logistics and expanding e-commerce volumes continue to support positive market sentiment.
Technically, DELHIVERY maintains momentum above key moving averages, and volumes have been steady during upticks. There is mild resistance near its recent peak, and a clear breakout could trigger additional gains. On the downside, sustained weakness below established support may encourage short-term corrections. Overall, the outlook remains constructive, driven by robust business fundamentals and positive demand for digital logistics solutions.

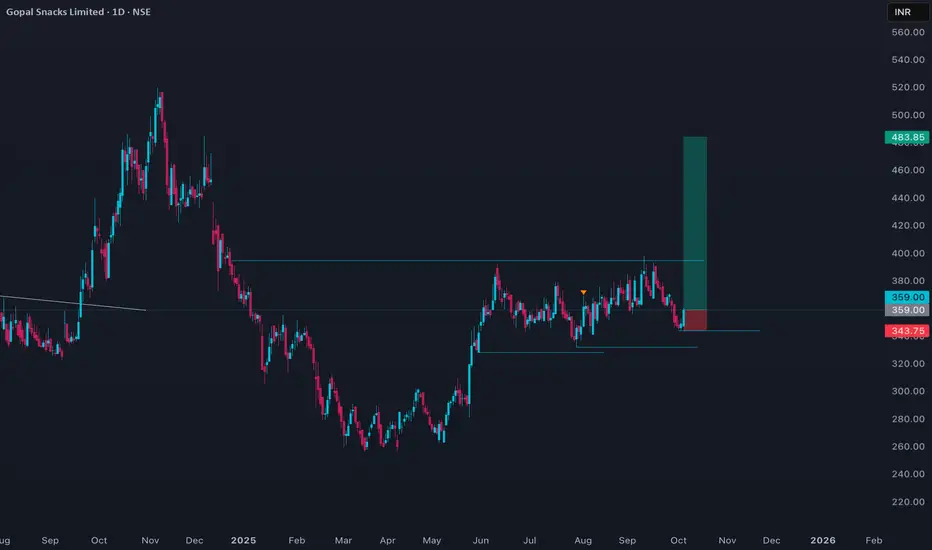
GOPAL Price ActionGopal Snacks Ltd is currently trading at around ₹348.8, having shown some recovery from lower levels over the last few months. The stock has a 52-week high of ₹520 and a low of ₹255.9, indicating significant volatility during the year. In the past week, the price remained largely stable, with minor gains, and the one-month performance is up by nearly 10%.
Despite recent price improvement, Gopal Snacks faces a relatively high price-to-earnings (P/E) ratio and trades at a premium to its book value. Its return on equity and return on capital employed are decent compared to peers, but sales growth has been modest over the longer term. Trading volumes and price action suggest continued investor interest, but profit-taking has limited any sharp upward surge. Near-term movement is expected to stay range-bound unless there is a major earnings surprise or sector catalyst. The dividend yield remains modest, reflecting its growth-focused policy. Overall, the price reflects a balance between recent recovery and ongoing valuation concerns, with technical support seen near ₹340 and resistance around ₹360–370.
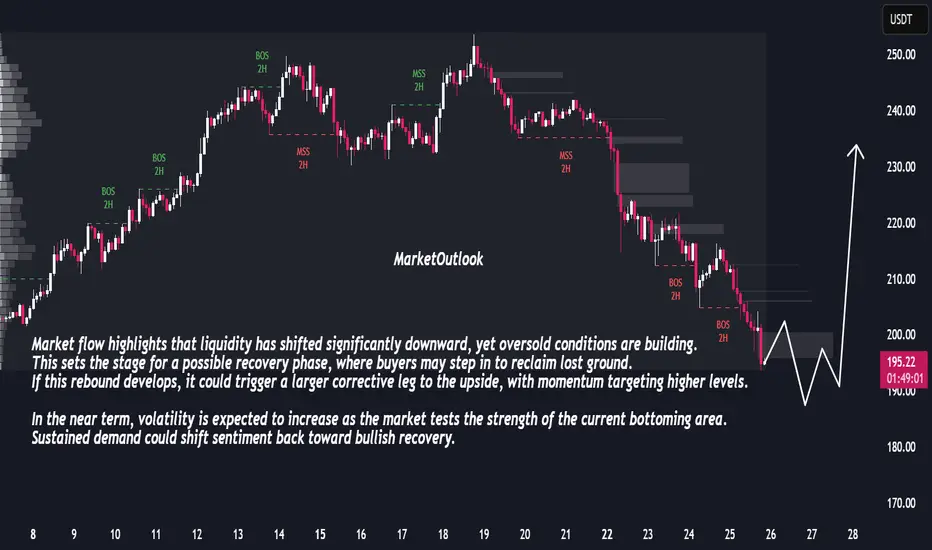
Bullish Reversal Ahead: Market Prepares for Sharp RecoveryThe market has been under consistent selling pressure, with a clear sequence of bearish breaks in structure confirming downside control. Price has now entered a zone where momentum shows signs of slowing, suggesting potential exhaustion in the recent decline. The sharp extension lower indicates that sellers may be reaching a short-term limit, creating conditions for a corrective rebound.
Market flow highlights that liquidity has shifted significantly downward, yet oversold conditions are building. This sets the stage for a possible recovery phase, where buyers may step in to reclaim lost ground. If this rebound develops, it could trigger a larger corrective leg to the upside, with momentum targeting higher levels.
In the near term, volatility is expected to increase as the market tests the strength of the current bottoming area. Sustained demand could shift sentiment back toward bullish recovery.
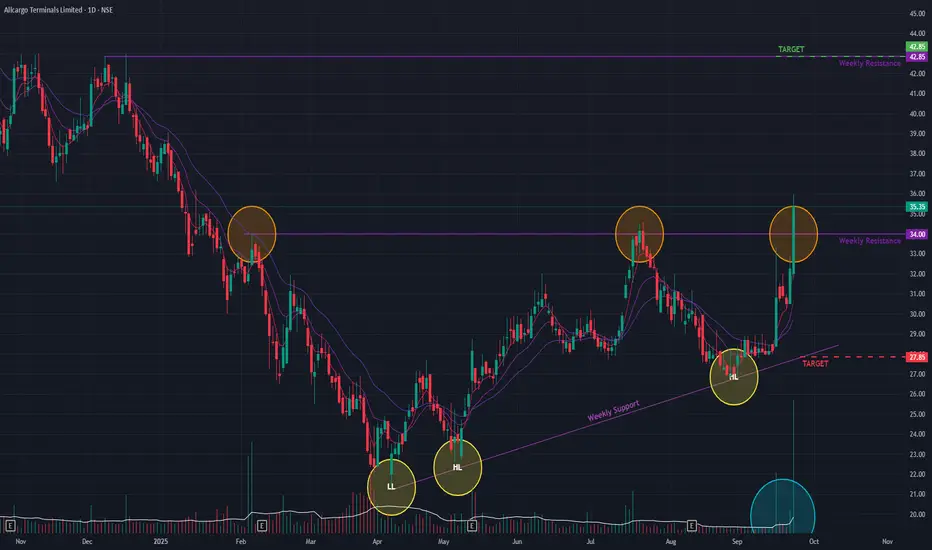
ATL (D) - Signals Bullish Reversal with Powerful BreakoutAllcargo Terminals has demonstrated a significant bullish development, suggesting its long-term downtrend may be reversing. Today, the stock decisively broke out of a key horizontal resistance trendline , a move confirmed by an impressive +9.61% price surge on the back of massive trading volume.
This breakout is the latest in a series of positive signs since May 2025, including the consistent formation of Higher Lows , which indicated a potential shift in market structure after the downtrend from January 2024.
Broad-Based Bullish Confirmation 👍
The positive outlook is strongly supported across multiple indicators and timeframes:
- Volume Thrust: The breakout was accompanied by exceptionally high volume , signaling strong conviction from buyers.
- Daily & Weekly Momentum: Both the short-term Exponential Moving Averages (EMAs) and the Relative Strength Index (RSI) are exhibiting bullish crossovers on both the daily and weekly charts, indicating synchronized positive momentum.
Outlook and Key Levels
Following a strong breakout, a common technical development is a retest of the former resistance level as new support . The price action in the coming days will be crucial for confirming the breakout's validity.
- Bullish Case 📈: If the momentum is sustained and the breakout level holds, the stock could proceed towards the next resistance target near ₹42 .
- Bearish Case 📉: However, if the stock fails to hold the breakout and momentum wanes, it could pull back towards the support level of ₹27 .
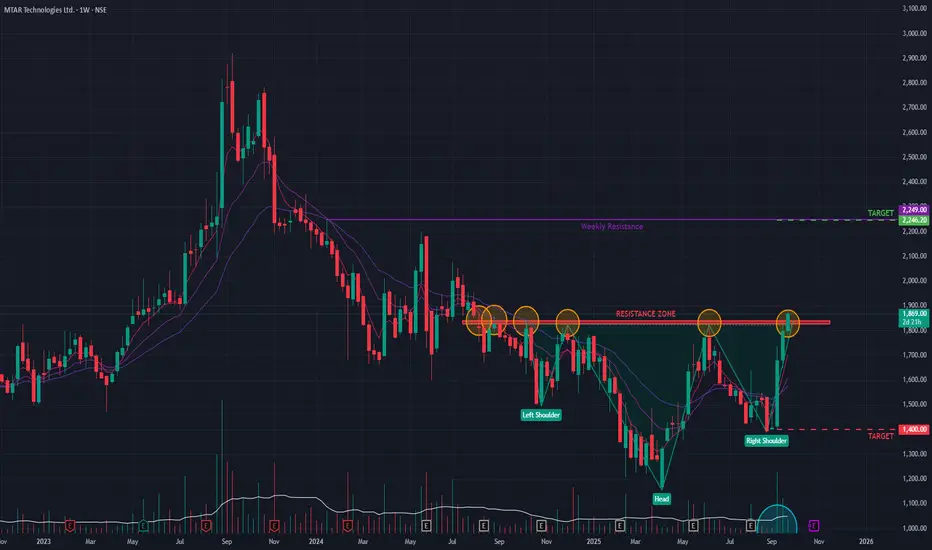
MTAR Tech (W) - Signals Bullish Reversal with Pattern BreakoutMTAR Tech has shown a significant sign of a potential long-term trend reversal. The stock, which has been in a prolonged downtrend since its All-Time High in September 2023, has decisively broken out of an Inverse Head & Shoulders pattern on the weekly chart today.
This classic bullish reversal pattern was confirmed by a strong upward move that breached the neckline, supported by decent trading volume .
Multi-Timeframe Confirmation 👍
The bullish thesis is strongly supported by momentum indicators across all major timeframes:
- Broad Momentum: The Relative Strength Index (RSI) is in a bullish crossover state on the monthly, weekly, and daily charts , indicating synchronized positive momentum.
- Volume Trend: The general trend of building volume suggests increasing buyer participation and conviction in the upward move.
Future Outlook and Key Levels
The breakout from this major reversal pattern suggests the downtrend that began in mid-2023 may be over. The price action in the coming days will be crucial for confirmation.
- Bullish Case 📈: If the breakout momentum is sustained, the stock could be on a path toward the next major resistance level near ₹2,245 .
- Bearish Case 📉: However, if the breakout fails to hold and momentum wanes, the stock could pull back to test support around the ₹1,400 level.
VSTTILLERS Price Action Multiple set upVST Tillers Tractors Ltd closed today at ₹5,186, slipping slightly by approximately 0.86%. The stock traded between an intraday low of ₹5,146 and a high of ₹5,272, reflecting minor profit booking after recent robust gains. The company remains fundamentally strong, operating with zero debt for the last five years and consistently offering a dividend payout.
Technically, VST Tillers holds above its 50-day and 200-day moving averages, maintaining its uptrend on the daily chart. The price-earnings ratio is approximately 39, and return on capital employed stands healthy. Support is clustered around ₹5,146, with the next key zone near ₹5,100; resistance is seen at ₹5,272 with the all-time high at ₹5,548. In terms of market cap growth and volume, investor interest remains elevated, supporting its overall upward trajectory.
In summary, VST Tillers is showing strong medium-term structure with bullish bias. Pullbacks have attracted buyers and, barring a decisive fall below ₹5,100, the stock is well positioned for further appreciation towards its 52-week high region.

GODREJIND Price ActionGodrej Industries Ltd closed at ₹1,175.60 today, experiencing a 3.4% decline with heavy trading volume and a daily price range between ₹1,160 and ₹1,222.80. The stock has traded weakly in recent sessions, following a period of sideways consolidation, and now sits just above key support near ₹1,150.
From a technical perspective, the stock averages—50-day and 200-day—are at ₹1,184 and ₹1,122 respectively, suggesting the price remains above long-term support but has slipped below short-term momentum lines. Indicators like RSI and MACD are showing reduction in buying momentum, and the recent moving average crossover points to a near-term bearish bias. The current price is also well below the year’s high of ₹1,390 but still far from the yearly low of ₹766.
Fundamentally, Godrej Industries remains a diversified holding company with strong assets in consumer products, real estate, and agriculture. The most recent quarter shows healthy revenue growth and improving operating margins, but ongoing concerns about muted profit growth and pressure on consumer demand are apparent. Promoter holding has increased slightly, which is a positive, but the stock continues to trade at a relatively high price-earnings multiple, indicating limited value upside in the short term.
Looking forward, key areas to watch include the ₹1,150 support zone for signs of demand, and ₹1,200–₹1,230 as resistance for any bounce attempts. Any decisive move below support may accelerate downside, while a recovery above resistance could restore bullish sentiment. Despite recent weakness, long-term prospects remain tied to the group’s ability to generate stable earnings and diversify growth across its business lines.

SUMMITSEC Price ActionSummit Securities Ltd is trading near ₹1,914 as of September 13, 2025. The share price has seen a steady uptrend through the year, moving from its 52-week low of ₹1,226 to highs approaching ₹1,959. Market capitalization is around ₹2,080 crore, reflecting niche investor interest in this diversified investment holding company.
Financially, Summit Securities maintains a conservative approach with a strong balance sheet, minimal debt, and healthy cash reserves. The company’s core portfolio contains significant equity holdings in top Indian conglomerates, driving stable dividend income and capital gains. Operating margins and net profit margins remain high thanks to low operating costs and recurring investment returns, resulting in a robust return on equity above 8%.
Technically, the stock is trading well above its short- and long-term moving averages, indicating continued positive sentiment. Both RSI and MACD are in a neutral-to-bullish zone, showing momentum is intact without risks of over-extension. Shareholding is primarily with promoters and institutional investors, ensuring stability. Overall, Summit Securities offers a constructive outlook, anchored in prudent capital preservation and consistent portfolio value growth.

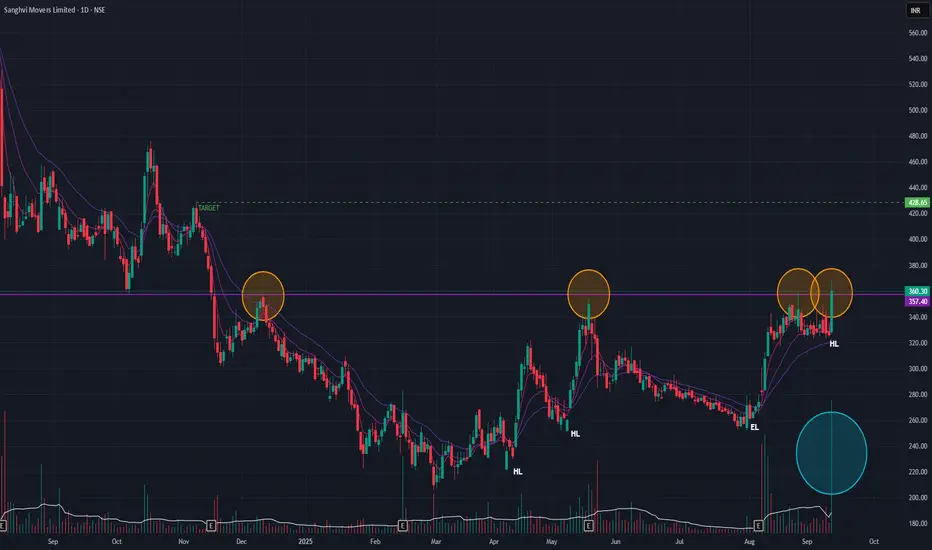
Sanghvi Movers (Daily Timeframe) - Potential BreakOut ??Sanghvi Movers has been in a corrective downtrend since peaking at its all-time high in May 2024. A notable shift in market structure appeared in March 2025, with the stock starting to print a series of higher lows —an early sign of a potential trend reversal.
A significant horizontal resistance, established in August 2023, has capped multiple rally attempts. Today, however, the stock challenged this level with conviction, closing +10.45% higher on massive volume , which suggests strong institutional interest. Bullish sentiment is further reinforced by a recent Simple Moving Average (SMA) Golden Cross.
While we await a confirmatory Positive Crossover (PCO) on the short-term Exponential Moving Averages (EMAs) , a sustained breakout above this resistance could signal the start of a new uptrend. The next logical price target on a successful breakout would be the ₹428 zone.
SBI Card | Double Bottom Breakout | Bullish BiasSBI Card is showing signs of strength on the daily timeframe, completing a double bottom pattern, a classic bullish reversal setup. The stock is expected to close positively today around ₹830, confirming breakout intentions.
🔹 RSI is hovering near 60, indicating rising bullish momentum without being overbought.
🔹 The 20 EMA is sloping upward, reinforcing the short-term bullish trend.
🔹 Watch for resistance near ₹880, which coincides with a falling window gap — a likely profit-booking and supply zone.
📌 Key Levels:
Breakout above ₹830 can trigger momentum towards ₹880.
₹880 remains a crucial level to watch for follow-through or rejection.
🔔 Keep an eye on volume confirmation to validate the breakout.

IDFCFIRSTB Price ActionIDFC First Bank is trading at ₹72.60 as of September 8, 2025, and maintains a solid presence in India’s private banking sector. The stock has a market capitalization near ₹53,264 crore, having seen an 8.7% gain over the last three months and a 25% rise over six months, while its year-on-year change is slightly negative. The share price is just below its 52-week high of ₹78.50, reflecting mild short-term consolidation after recent rallies.
Financially, IDFC First Bank continues to deliver growth: its annual operating revenue for FY25 approached ₹36,500 crore. Net interest margin remains strong at 5.6%, and the bank’s gross NPA ratio has declined to 1.87%, with net NPA at 0.53%, representing improved asset quality. Net profit for the previous year edged higher, and the latest quarter saw stable promoter holdings, a minor uptick in DII ownership, and balanced institutional participation.
The valuation remains elevated, with a price-to-earnings ratio of 40.78 and price-to-book near 1.4, as the market is factoring in future growth from retail advances, digital initiatives, and improving cost efficiencies. Technical indicators show the share trading above 50-day and 200-day averages, confirming ongoing bullish sentiment, and weekly stochastics point to strong price momentum. Dividend yield is modest but consistent, as the bank prioritizes growth and capital buffers.
Overall, IDFC First Bank offers a constructive outlook thanks to ongoing improvements in profitability, asset quality, and operational metrics. The bank is well-positioned for further gains if trends in retail lending, fee income, and digital channels remain favorable.
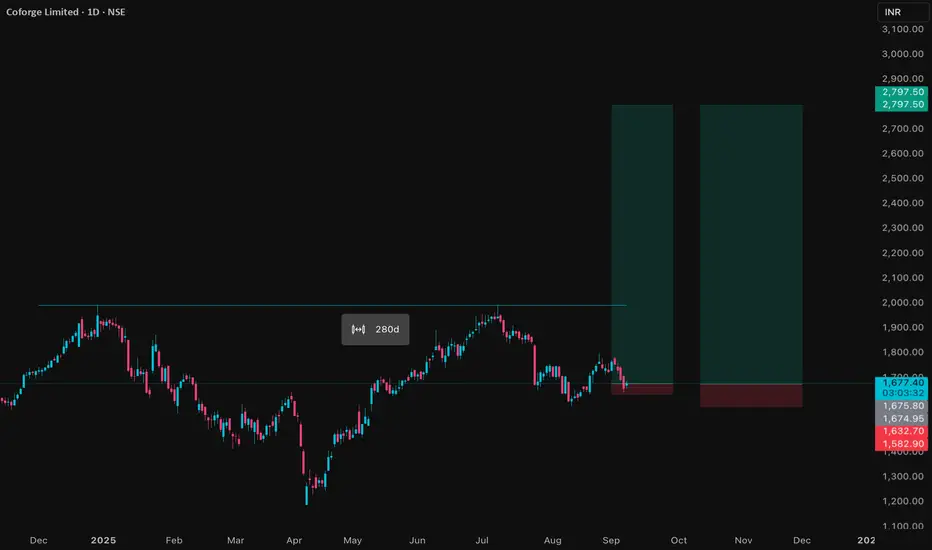
COFORGE Price AnalysisCoforge Ltd is trading near ₹1,675 as of September 8, 2025, undergoing mild recovery after a recent period of price consolidation. The stock’s market capitalization is around ₹56,000 crore, and average daily volume remains robust, reflecting solid institutional and retail participation. Coforge reached a 52-week high of ₹2,005 and a low of ₹1,194, highlighting significant volatility in the past year.
Recent quarterly revenue crossed ₹3,777 crore with net profit at ₹356 crore, showing resilience despite sector-wide macro uncertainties. Annual profit stood at ₹936 crore on a total income of ₹12,050 crore, as digital transformation and global IT services remain growth drivers. Operating profit margins are healthy and comparable to top industry peers, with cost controls and process efficiency supporting bottom-line growth.
Coforge trades at a price-to-earnings ratio above 50, reflecting the market’s expectation of future earnings growth. Technical indicators currently show support near ₹1,657 with minor resistance at ₹1,710; the stock is slightly below its 50-day moving average but well-supported over the medium term by improving fundamentals. The dividend yield is modest, as the company prioritizes reinvestment for expansion and client acquisition.
Overall, Coforge’s outlook is stable, bolstered by its diversified service portfolio, strong client relationships, and continued demand for IT and cloud services. Near-term swings may persist, but the stock remains attractive for investors seeking steady long-term growth within the IT sector.
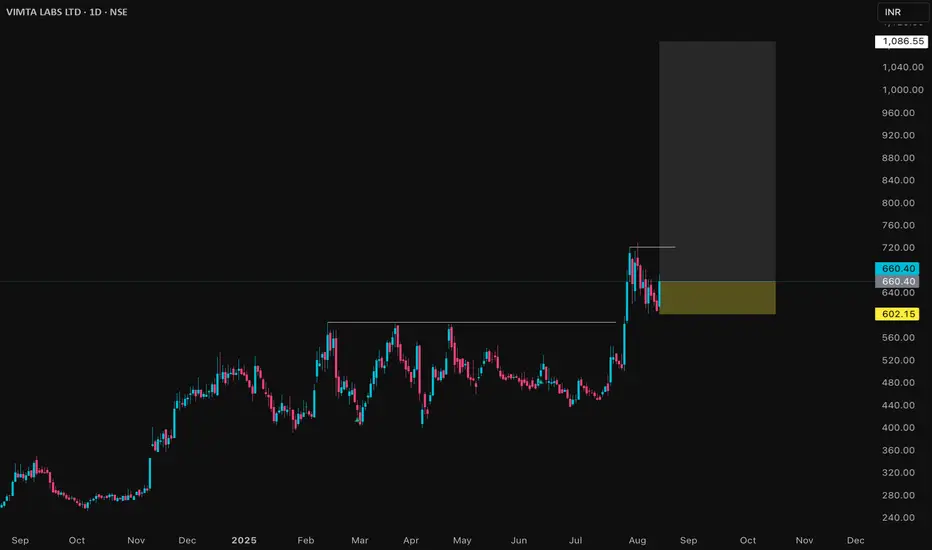
VIMTALABS Price Action## Vimta Labs Ltd – Price Analysis (August 2025)
### Price & Market Metrics
- Current share price is around ₹646–₹659 as of August 13, 2025.
- Market capitalization is approximately ₹2,900 crore.
- The 52-week price range is ₹241.30 (low) to ₹728.95 (high).
- The all-time high was ₹728.95 recorded in early August 2025.
- Recent price movement shows a strong rebound with gains around 6-7.5% over the past day.
### Returns & Volatility
- Over the last 1 year, the stock has surged by approximately 150-160%.
- The 6-month growth pace is about 14-16%.
- Weekly price moves have shown notable volatility, with recent declines around 7.5% in a short time frame.
- The stock exhibits moderate volatility consistent with strong recent price momentum.
### Valuation
- Price/Earnings (P/E) ratio is around 38.
- Price/Book (P/B) ratio is low, roughly 0.14 based on some sources, though others note around 3.6, indicating possible variation in book value interpretation.
- Dividend yield data is not prominent, indicating limited or no regular payout.
### Business & Fundamentals
- Vimta Labs is in the testing, inspection, and certification sector focused on quality control and laboratory testing services.
- The company benefits from growth in industrial and infrastructure sectors fueling demand for quality and compliance services.
- Recent market action indicates investor interest fueled by strong earnings growth expectations.
### Technical & Sentiment Overview
- The stock hit a fresh 52-week high recently but has shown some corrective pullbacks.
- Volume remains healthy reflecting active trading interest.
- The stock price is trading well above average levels, supported by positive market sentiment and sector tailwinds.
***
### Summary
Vimta Labs Ltd has exhibited a strong price rally in the past year with over 150% gains, reaching new highs in early August 2025. The current valuation by P/E stands elevated at about 38, reflecting growth optimism. The share price volatility is moderate but notable due to recent sharp moves. Market capitalization is close to ₹2,900 crore, with the stock trading near its peak levels. Investors should consider the premium valuation against ongoing growth prospects and sector dynamics, while monitoring for potential short-term price fluctuations or corrections.
Overall, Vimta Labs appears to be a growth-oriented stock with robust recent performance, but with valuation levels demanding careful risk assessment for new investors.