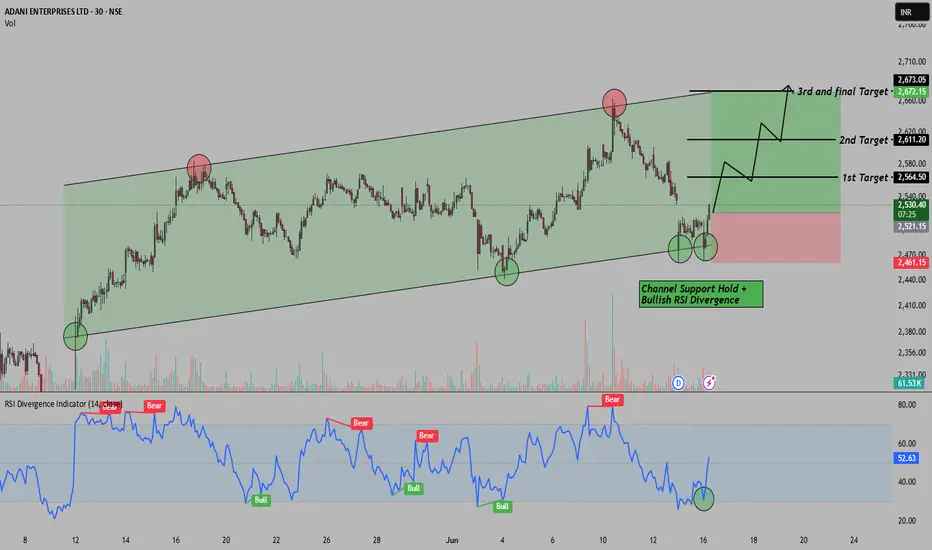
Rising Channel+RSI Divergence=Reversal Setup in Adani EnterpriseHello Everyone, i hope you all will be doing good in your life and your trading as well. Today i have brought a setup in Adani Enterprises , where we’re spotting a short-term reversal opportunity inside a clean rising channel . Price recently tested the channel support for the 3rd time and gave a solid bounce, which is also confirmed by a bullish RSI divergence . This combo often works as a reliable early reversal signal for positional or intraday swing traders. Here we are expecting at least 4%+ move behalf of this setup.
This trade is completely logic based so i placed Stop loss around 2461 for controlled risk. for the targets please check the chart above i have mention there.
Reward-to-Risk Ratio looks favorable here , especially with clear trend structure and momentum support from RSI. Let’s see how this setup plays out!
If you liked this breakdown, don’t forget to LIKE & FOLLOW for more real chart setups, data-backed ideas, and smart money zones.
Disclaimer: This post is for educational purposes only. Do your own research or consult a financial advisor before investing.
Bullishsetup
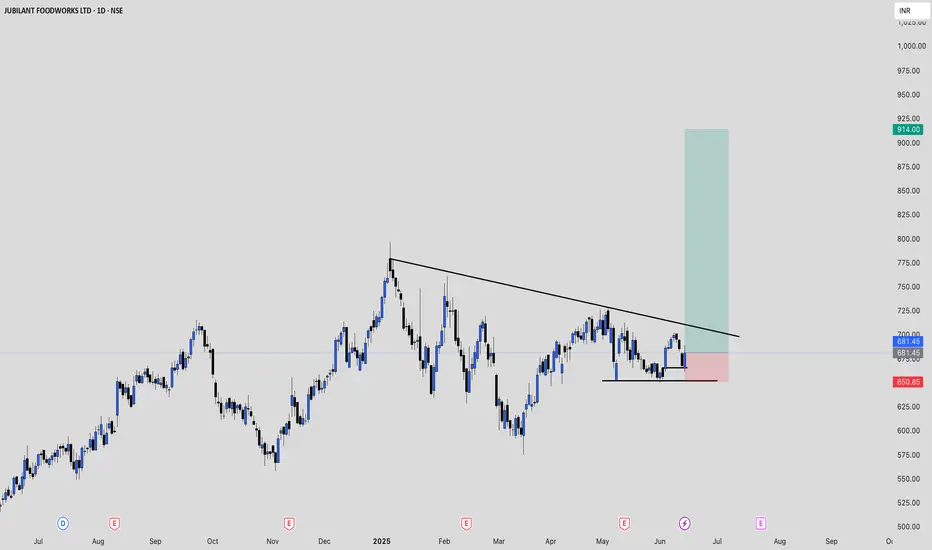
JUBLFOOD price actionJUBLFOOD (Jubilant Foodworks) is currently trading at ₹681.45 as of June 13, 2025, up 2% for the day. Over the past year, the stock has gained about 26.5%, though it remains roughly 14% below its 52-week high of ₹796.75 and about 30% above its 52-week low of ₹522.25.
Technically, the stock is showing mixed signals. The RSI is neutral around 49.5, while MACD and ADX are giving sell signals. However, most short-term moving averages (except the 5 and 50-day) are showing buy signals, and the price is currently above the VWAP, indicating some short-term strength. The Stochastic RSI is in the overbought zone, suggesting caution.
Fundamentally, JUBLFOOD is trading at a high P/E of 197, which points to an expensive valuation. Its book value is ₹31.9, with the stock trading at over 21 times book value. The dividend yield is low at 0.18%, and the average ROE over three years is moderate at 13.8%. The company remains a leader in the quick-service restaurant sector in India, holding franchise rights for Domino’s, Dunkin’ Donuts, and Popeyes.
Analysts have a wide range of price targets, from as low as ₹516 to as high as ₹1,000. While the company’s fundamentals are strong, the high valuation and mixed technicals suggest investors should be cautious. The short-term trend is up, but further upside will depend on sustained buying and a breakout above resistance levels.
Get Bluejet for short term upside of 6%Take entry at cmp 904
Target 966
Bluejet reports very good last quarter profit.
Big volumes generates on daily time frame so it is ready to move upside

Jayshree Tea: A Worthy Stock Pick!The chart of JAYSHREETEA provides delineates critical price thresholds that signify breakout points, along with specific support levels that serve as indicators of where buying interest may manifest.
Additionally, the chart highlights regions likely to act as ceiling points for future price ascensions, allowing for informed decisions on entry and exit strategies.
Disclaimer: The information contained in this technical analysis report is intended solely for informational and educational purposes. It should not be interpreted as financial advice or a recommendation to buy or sell any security. Investors are strongly encouraged to conduct their own research and consult with a qualified financial advisor before making any investment decisions.

STOCK - PFC (POSSIBLITY OF LONG HAPPENDING)Price seen breaking out a downward trendline
Retest is pending
Near Support -400 Rs
Resistance - 444
Resistance - 474
Resistance - 523
Till Then Stay Focused,

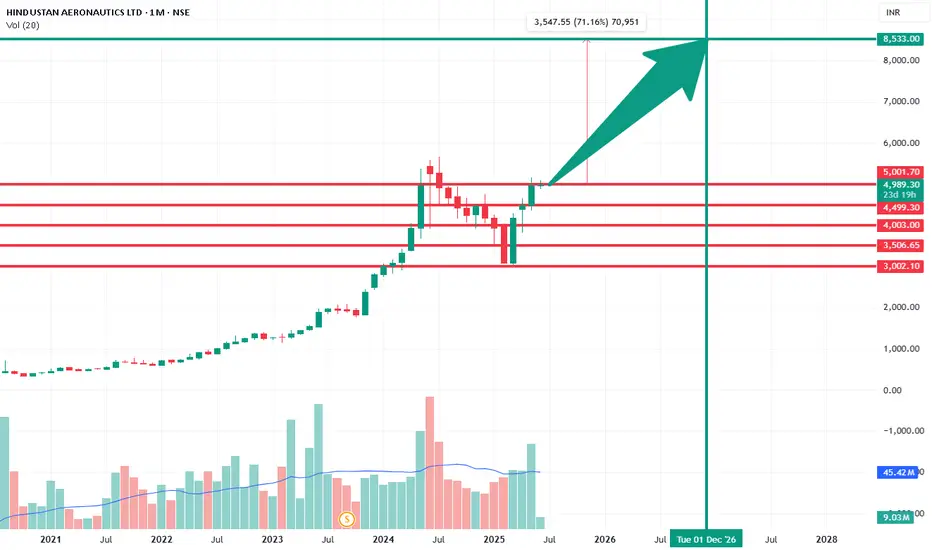
Boom with HAL for 71% profit within 1.5 year by secure methodHAL
CMP 5000
Follow below method for investment
Example:
1. 5000Rs....Buy 10 Share
2. 4500Rs....Buy 20 Share....Your Avg will be 4667Rs
3. 4000Rs....Buy 30 Share....Your Avg will be 4343Rs
4. 3500Rs....Buy 40 Share... Your Avg will be 4000Rs
5. 3000Rs....Buy 50 Share... Your Avg will be 3636Rs
Target : 8533Rs....Almost 71%
Duration : 19 Months only
This is the best method to invest in HAL....If you have small amount then you can start with 1 quantity and later 2 3 4 5....
Be invested and grow you money !!!
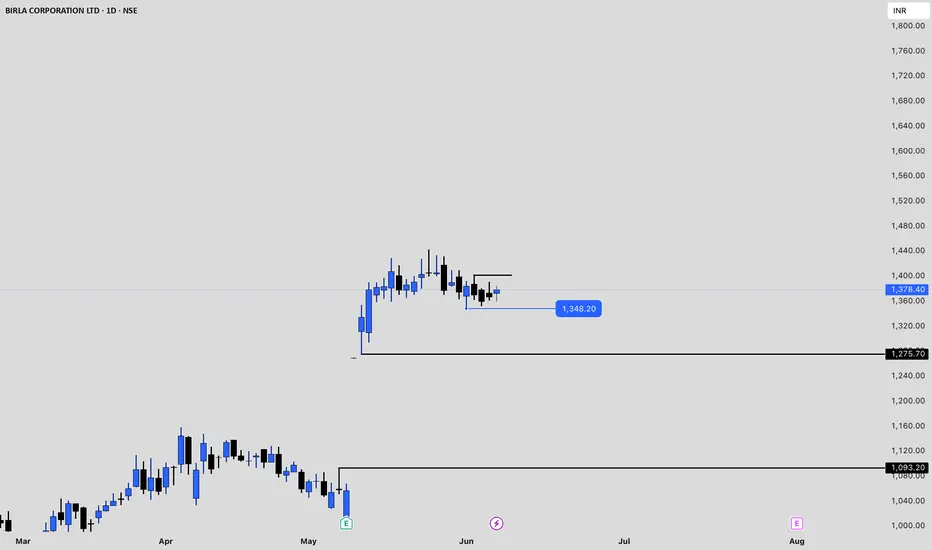
BIRLACORPN Price actionBirla Corporation Ltd (BIRLACORPN) closed at approximately ₹1,385.20 on June 6, 2025, reflecting a 1.65% gain over the previous session . The stock has shown strong recent momentum, rising 31.34% over the past month . However, over the past year, the company’s market capitalization has slightly declined, currently standing at around ₹10,642 crore .
The stock’s 52-week high is ₹1,656.10 (reached on June 27, 2024), and its 52-week low is ₹901.85 (on March 4, 2025), indicating significant volatility within the past year . Birla Corporation’s all-time high is ₹1,801.25, set in February 2024 .
On the financial front, for the quarter ended in 2025, Birla Corporation reported a consolidated profit of ₹256.60 crore on total income of ₹2,863.14 crore. For the year ended 2024, profit stood at ₹420.56 crore on revenue of ₹9,662.72 crore . Despite this, the company’s sales growth has been modest, with a 5.91% increase reported recently .
Analyst sentiment has turned positive following recent quarterly results, with ICICI Securities issuing a ‘Buy’ rating and a target of ₹1,540, citing the stock’s upward momentum after strong Q4 performance .
In summary, Birla Corporation is experiencing a strong short-term rally and has rebounded sharply from its 52-week low. While profitability and revenue remain solid, overall sales growth has been modest. The stock is currently trading closer to the upper end of its yearly range, and analyst outlook is optimistic following its latest results .
ADANIGREEN Price actionAdani Green Energy Ltd (ADANIGREEN) closed at ₹1,009.50 on June 6, 2025. The stock has shown notable volatility in recent months. Over the past month, it gained nearly 10%, and over the last three months, it’s up 18.25%. However, longer-term performance is weaker, with a 6-month decline of 18.38% and a significant 45% drop over the past year .
The stock’s 52-week high is ₹2,091, while the 52-week low is ₹758, indicating substantial price swings. ADANIGREEN trades at a high valuation, with a P/E ratio of 112.77 and a P/B ratio of 7.21, both well above sector averages (sector P/E: 20.60; sector P/B: 3.07), suggesting the stock is priced at a premium .
Operationally, Adani Green has reported robust growth, with revenue expanding at an average annual rate of 38.37% over the last five years, significantly outpacing the industry average. The company continues to expand its renewable energy capacity, targeting 5 gigawatts of new installations this year and aiming for 50 gigawatts by 2030. Despite project delays and regulatory challenges, Adani Green has improved its financial position through cost reductions and refinancing, and it remains well-funded for future growth .
Analyst sentiment is generally positive, with most recommending a ‘buy’ at current levels, citing strong operational performance and growth prospects. However, the high volatility (nearly four times that of the Nifty index) and premium valuation mean the stock carries elevated risk .
In summary, Adani Green Energy is a leader in renewable energy with strong growth and expansion plans, but its stock is highly volatile and currently trades at a substantial premium. Investors should weigh the company’s aggressive growth trajectory and industry leadership against its recent price declines and high valuation multiples.

KEC Price ActionKEC International’s share price as of June 6, 2025, is around ₹889.25, reflecting a 2.16% increase from the previous close. Over the past month, the stock has surged by 28.8%, and it is up 6.83% in the last week, showing strong short-term momentum. However, over the last six months, the stock is down by 26.85%, indicating significant volatility in the medium term .
The company is currently trading at a price-to-earnings (P/E) ratio of 40.6 and a price-to-book (P/B) ratio of 4.33, both of which are considered high compared to the sector average P/E of 28.9. This suggests that the stock is priced at a premium relative to its peers . The dividend yield stands at 0.63% .
KEC International recently secured new orders worth ₹2,211 crore across various segments, including Transmission & Distribution, Oil & Gas Pipelines, and Cables. This has contributed to a 40% year-to-date growth in orders and strengthened its international order book. As a result, analysts maintain a ‘Buy’ rating, with target prices ranging from ₹911 to ₹998, and some suggesting a potential 10% upside from current levels .
Financially, the company’s trailing twelve-month earnings per share (EPS) has grown by 58.95% year-on-year, and the company has a market capitalization of about ₹23,295 crore . The stock hit its 52-week high at ₹1,313.25 and its 52-week low at ₹627.45, highlighting its volatility over the past year .
In summary, KEC International is showing positive short-term momentum, backed by strong order inflows and optimistic analyst ratings. However, its high valuation multiples and recent volatility suggest that investors should approach with some caution, balancing growth prospects against the premium pricing and market fluctuations .

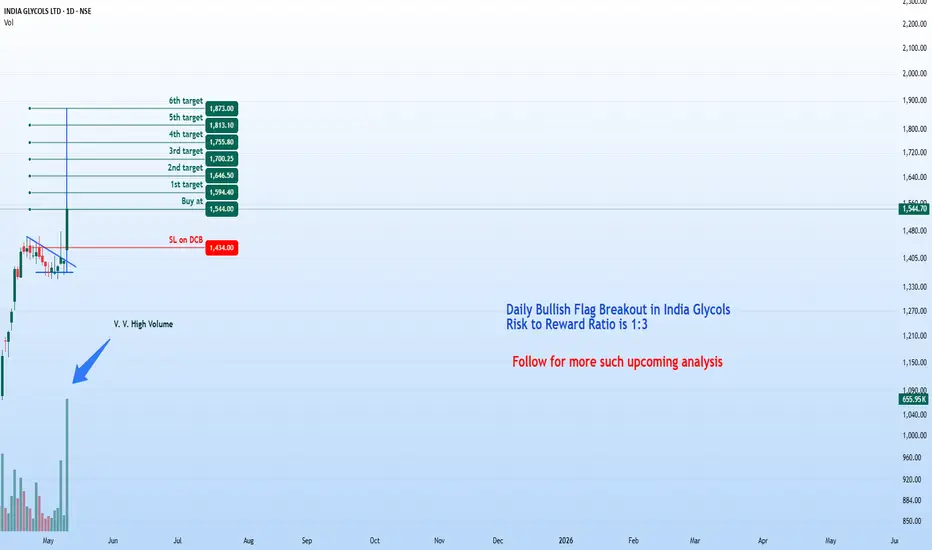
India Glycol Ltd – Bullish Breakout Setup (Daily Timeframe)Stock: India Glycol Ltd ( NSE:INDIAGLYCO )
Trend: Bullish Momentum 🚀 | Risk-Reward: 1:3
Trade Parameters
🎯 Entry: ₹1,544 (Breakout Confirmation)
🛑 Stop Loss: ₹1,434 (Daily Closing Basis | ~7.1% Risk)
🎯 Targets:
₹1,594.40
₹1,646.50
₹1,700.25
₹1,755.80
₹1,813.10
₹1,873.00 (Final Target)
Technical Rationale
✅ Bullish Flag Breakout – Price surged out of consolidation, signaling trend continuation.
✅ RSI Strength – Daily & Weekly RSI >60 (bullish momentum confirmed).
✅ Volume Surge – Breakout volume 656K (vs. previous day’s 75K – 8.7x spike!).
✅ Risk-Reward Advantage – Final target (₹1,873) offers 1:3 reward potential relative to risk.
Key Observations
High-volume breakout suggests institutional/strong hands participation.
Progressive targets allow for partial profit booking.
Stop loss on daily closing basis reduces intraday volatility risks.
Trade Management
Trail SL: Move stop loss to breakeven after Target 1 is hit.
Partial Booking: Secure profits incrementally at each target.
Discipline: Stick to the SL level to avoid emotional trading.
Disclaimer 📢
This analysis is strictly educational and does NOT constitute financial advice. Trading equities carries significant risk, including potential capital loss. Past performance is no guarantee of future results. Always conduct independent research or consult a certified financial advisor before making investment decisions. The author assumes no liability for financial outcomes based on this content.
Thoughts? Are you tracking NSE:INDIAGLYCO for this setup? Comment below!
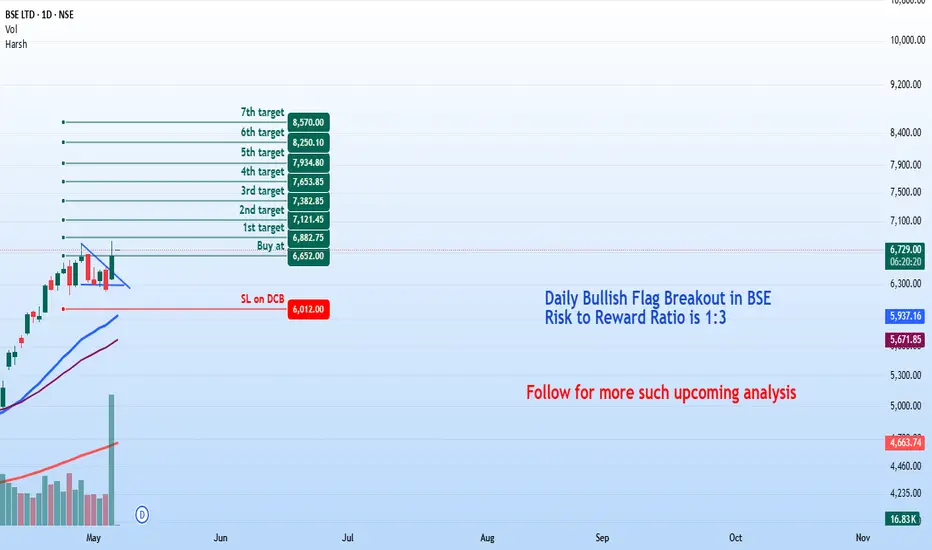
BSE Ltd - Bullish Breakout Setup (Daily Timeframe)Stock: BSE Limited ( NSE:BSE )
Trend: Strong Bullish Momentum 🚀
Risk-Reward Ratio: 1:3 (Favorable)
Trade Parameters
🎯 Entry Zone: ₹6,650 (Breakout Confirmation)
🛑 Stop Loss: ₹6,012 (Daily Closing Basis) (~9.6% Risk)
🎯 Target Levels:
₹6,882.75
₹7,121.45
₹7,382.85
₹7,653.85
₹7,934.80
₹8,250.10
₹8,570 (Final Target)
Technical Justification
✅ Bullish Flag Breakout - Price has broken out from a consolidation pattern, indicating continuation of uptrend
✅ Strong Momentum - Daily & Weekly RSI >60 (Bullish zone)
✅ Volume Confirmation - Breakout volume 10.8M vs previous day's 2.51M (4.3x surge!)
✅ Fundamental Catalyst - Very good quarterly results supporting bullish sentiment
Key Observations
• The breakout comes with exceptionally high volume, validating strength
• Multiple targets allow for progressive profit booking
• Risk-reward ratio of 1:3 makes this an attractive setup
Trade Management Tips
• Consider partial profit booking at each target level
• Move stop loss to breakeven after Target 1 is achieved
• Trail stop loss to protect profits as price progresses
Disclaimer 📢
This analysis is for educational purposes only and does not constitute financial advice. Trading in equities involves substantial risk of loss and is not suitable for every investor. Past performance is not indicative of future results. Always conduct your own research and consider your risk tolerance before making any investment decisions. The author assumes no responsibility for any trading losses that may occur from using this information.
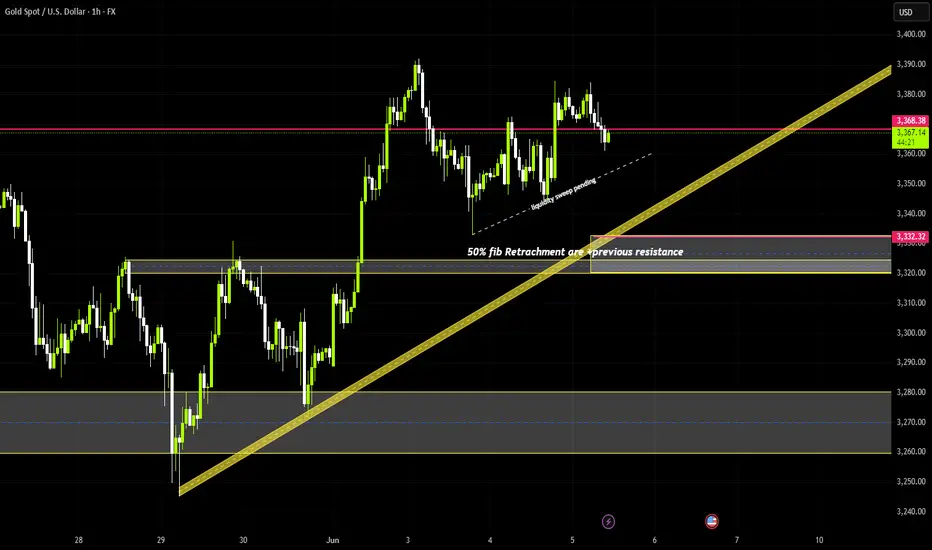
XAUUSD (GOLD) Bullish Analysis of The Day
We can see Good Bullish Move In From The Zone OF 3220-3232 Area
Points To Note
- H1 Liquidity sweep Pending
- We H4 T-line Coming At Buying Area
- Previous Resistance Now Could Act Like Support For Further Move
Till Then, Keep Following Markets
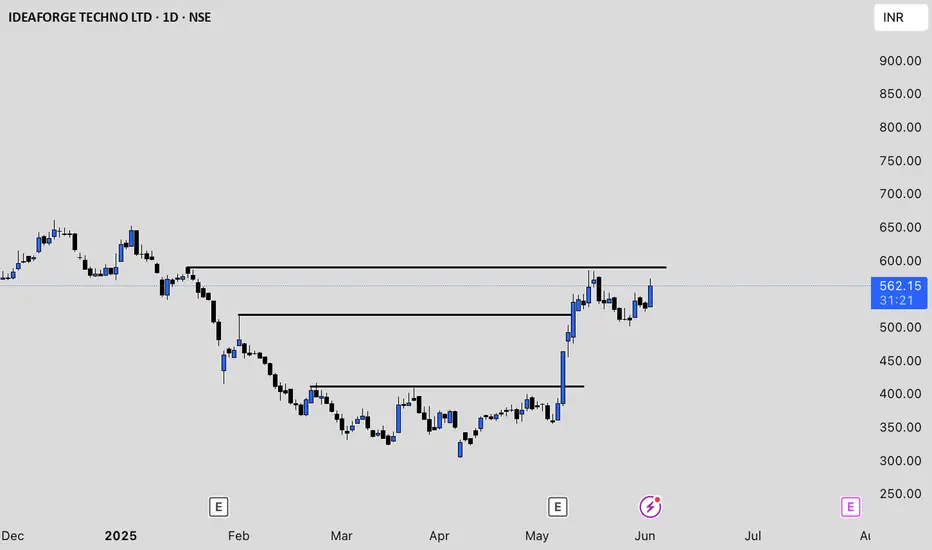
IDEAFORGE Price action## ideaForge Technology Ltd (IDEAFORGE) Price Analysis
**Current Price and Recent Performance**
As of June 3, 2025, ideaForge Technology Ltd (IDEAFORGE) is trading at approximately ₹529 on the NSE . The stock has experienced significant volatility in recent months, with a 52-week high of ₹864 and a low of ₹301 . Over the past few weeks, the price has rebounded sharply from the ₹360–₹400 range in early May to above ₹520 by the end of May, indicating strong recent momentum .
**Valuation and Financials**
- Market capitalization stands at about ₹2,413 crore .
- The stock is trading at roughly 3.9 times its book value, which is considered high for its sector .
- Return on capital employed (ROCE) is negative at -9.36%, and return on equity (ROE) is also negative at -9.81% for the latest period, reflecting operational challenges or recent losses .
- The company is almost debt-free, which is a positive factor for financial stability .
- No dividends have been declared, and the company’s interest coverage ratio is low, suggesting limited ability to cover interest expenses from profits .
**Operational Highlights and Risks**
- ideaForge operates in the unmanned aircraft systems (UAS) segment, a high-growth and innovative sector .
- Promoter holding is relatively low at 29.2%, which may affect investor confidence .
- The company’s debtor days and working capital days have increased significantly, indicating potential challenges in cash flow management .
- Over the last three years, ROE has averaged just 0.86%, highlighting weak profitability .
**Recent Price Action**
- After a sharp rally from ₹360 in early May to over ₹530 by the end of the month, the stock has stabilized in the ₹528–₹559 range in early June .
- Trading volumes have been high during this period, suggesting increased investor interest and possible speculative activity .
**Summary**
ideaForge Technology Ltd has shown strong recent price momentum but faces fundamental challenges, including negative returns, high valuation relative to book value, and growing working capital requirements. The company’s debt-free status and position in a high-potential industry are positives, but weak profitability and low promoter holding are key risks. Investors should monitor operational improvements and cash flow management before considering long-term positions .
BAJAJFINSV Price actionAs of March 24, 2025, Bajaj Finserv Ltd (BAJAJFINSV) is trading at ₹1,875.90, showing a 1.56% increase from its previous close of ₹1,847.25 . The stock has demonstrated positive momentum in recent trading sessions, with a 1-day return of 1.5% and a 1-week return of 0.17% .
## Performance Overview
- 1-month return: 0.92%
- 3-month return: 19.83%
- 1-year return: 18.1%
- 5-year return: 316.84%
The stock has shown strong performance over the long term, particularly in the 5-year timeframe, indicating sustained growth.
## Valuation Metrics
- Price-to-Earnings (P/E) Ratio: 17.52
- Price-to-Book (P/B) Ratio: 4.95
- Price-to-Sales (P/S) Ratio: 2.29
The current P/E ratio of 17.52 is lower than the industry average of 24.81, suggesting that the stock may be undervalued compared to its peers .
## Financial Performance
Bajaj Finserv reported strong financial results for Q3 2024-2025:
- Net profit increased by 3.4% year-over-year to ₹2,231 Cr
- Quarterly net profit growth of 6.9% compared to the previous quarter
## Market Position
With a market capitalization of ₹2,94,528.27 Cr, Bajaj Finserv is a significant player in the finance industry. The company has demonstrated robust financial performance with a 5-year CAGR of 43.77% and a healthy debt-to-asset ratio of 0.50 .
Given the company's strong financial performance, positive analyst outlook, and current valuation metrics, Bajaj Finserv appears to be an attractive investment option for those seeking exposure to the financial services sector in India.

Nalwa Sons Investment Ltd. (NSIL) Price Analysis### Nalwa Sons Investment Ltd. (NSIL) Price Analysis as of April 1, 2025:
#### **Current Price and Recent Trends**
- **Current Price (April 1, 2025):** ₹6,594.30 (Range: ₹6,268.53 - ₹6,895.56)
- **Previous Close (March 31, 2025):** ₹6,449.86
- **52-Week Range:** ₹2,245.15 - ₹9,974.00
- **All-Time High:** ₹9,974.00
#### **Key Metrics**
- **Market Cap:** ₹3,113 crore .
- **P/E Ratio (TTM):** 42.08 (High compared to sector average of 31.94)
- **Book Value Per Share:** ₹15,518.22 .
- **Dividend Yield:** 0%
#### **Technical Indicators**
- **Technical Strength:** Strong bullish momentum observed recently
- **RSI and EMA Trends:** Indicate positive momentum with potential for short-term gains
- **Volume Trends:** Average 20-day volume at 12,620 shares with a delivery percentage of 65.43%
#### **Forecast**
- **Short-Term Forecast (April 2, 2025):** Projected price range of ₹6,320.26 - ₹6,934.05 with an expected close around ₹6,613.46
- **Long-Term Outlook:** Potential growth of approximately 6.81% in one year with a target price of ₹6,570.93
#### **Strengths and Weaknesses**
**Strengths:**
- Excellent stability and strong technical indicators.
- Low Price-to-Book ratio of 0.39 suggests undervaluation relative to book value
**Weaknesses:**
- High P/E ratio indicates expensive valuations.
- Low profitability metrics such as ROA (0.45%) and ROE (0.53%)

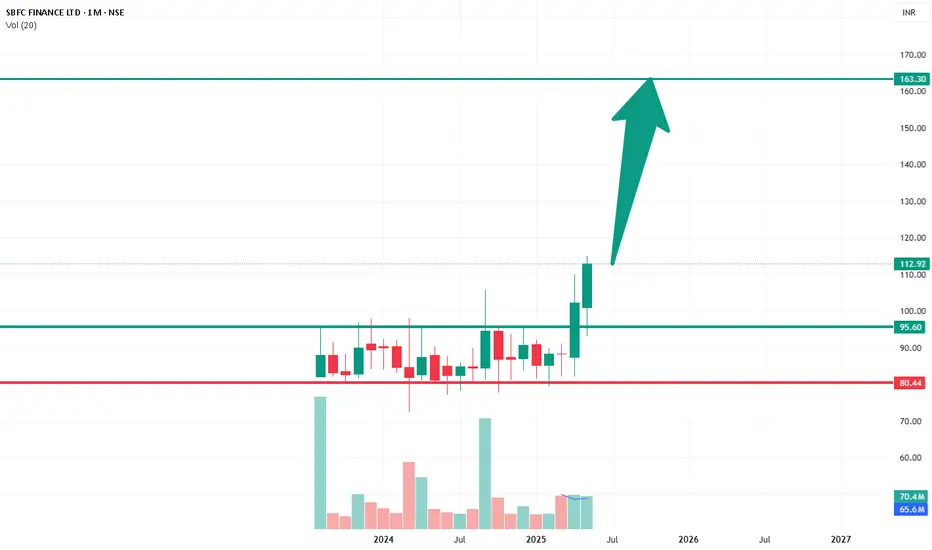
Deal in SBFC finance for rocket move Take entry at cmp 110
Target 163
Next invest at 95Rs
Duration : 14 Months.
This counter report good last quarterly result.
Already break its life high.
FII DII already catch it
Dont be unlucky to missed this opportunity .
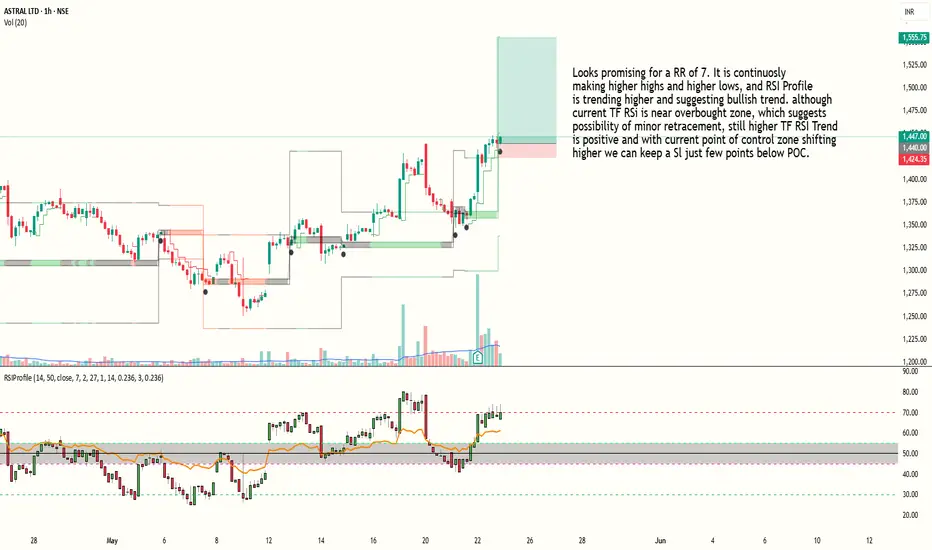
Bullish trade building up in Astral with RR of 7Looks promising for a RR of 7. It is continuosly making higher highs and higher lows, and RSI Profile is trending higher and suggesting bullish trend. although current TF RSI is near overbought zone, which suggests possibility of minor retracement, still higher TF RSI Trend
is positive and with current point of control zone shifting higher we can keep a Sl just few points below POC.
Entry at 1440
SL around 1423
Target around 1555
Risk to reward ratio is around 7.
Indicator used : RSI Hybrid Profile (Link available in my profile)
PS : This is an Educational post and doesn't constitute any trading or financial advice, just do your own research.
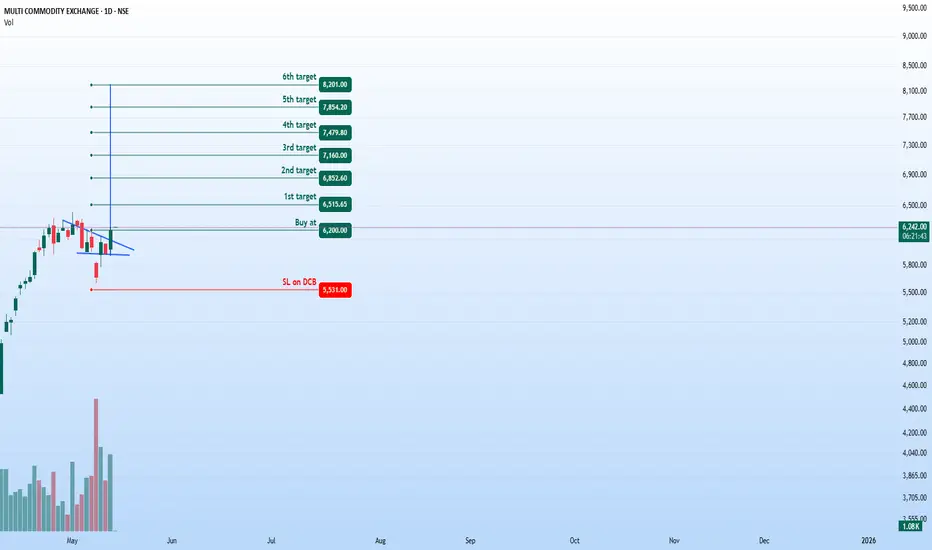
MCX - Bullish Breakout Opportunity (Daily Timeframe)Stock: MCX ( NSE:MCX )
Trend: Bullish Momentum Building 🚀
Risk-Reward Ratio: 1:3 (Favorable Setup)
Trade Parameters
🎯 Entry Zone: ₹6,200 (Breakout Confirmation)
🛑 Stop Loss: ₹5,531 (Daily Closing Basis) (~10.8% Risk)
🎯 Target Levels:
₹6,515.65
₹6,852.60
₹7,160.00
₹7,479.80
₹7,854.20
₹8,200 (Final Target)
Technical Rationale
✅ Bullish Flag Breakout - Price has broken out from consolidation pattern
✅ Strong Momentum - Daily & Weekly RSI >60 (Bullish territory)
✅ Volume Confirmation - Breakout volume 868K vs previous day's 571K (~52% increase)
✅ Technical Structure - Higher highs and higher lows formation
Key Observations
• The breakout comes with significantly higher volume
• Multiple targets allow for progressive profit booking
• Attractive 1:3 risk-reward ratio
• Strong technical structure supporting bullish case
Trade Management Strategy
• Consider partial profit booking at each target level
• Move stop loss to breakeven after Target 1 is achieved
• Trail stop loss to protect profits as price progresses
• Watch for volume confirmation on upside moves
Disclaimer ⚠️
This analysis is strictly for educational purposes and should not be construed as investment advice. Trading in financial markets involves substantial risk and is not suitable for all investors. Past performance is not indicative of future results. Always conduct your own thorough research and consult with a qualified financial advisor before making any investment decisions. The author assumes no responsibility for any trading losses that may occur from using this information.
What do you think? Are you watching this breakout on NSE:MCX ? Share your views in the comments!
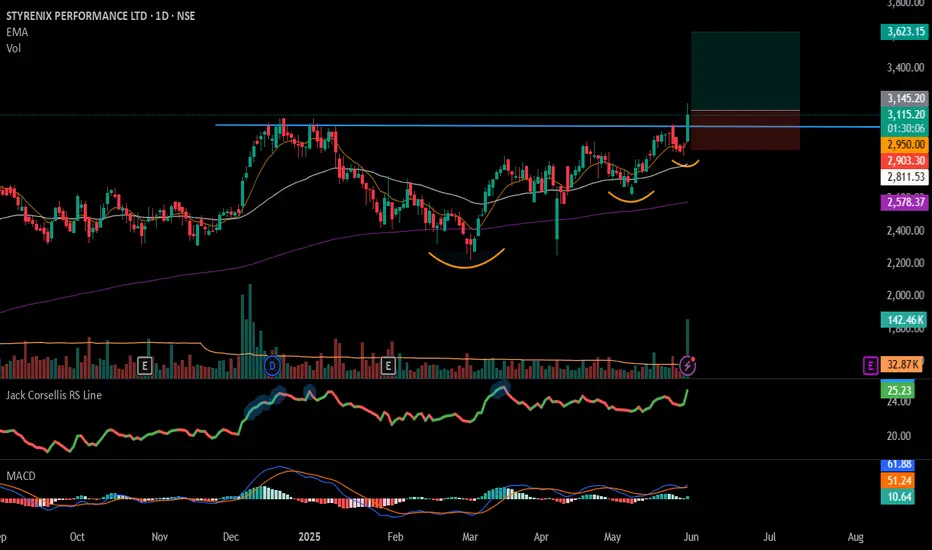
#STYRENIX - VCP BreakOut in Daily Time Frame📊 Script: STYRENIX
Key highlights: 💡⚡
📈 VCP BreakOut in Daily Time Frame.
📈 Price consolidating near Resistance.
📈 Volume spike during Breakout
📈 MACD Bounce
📈 Can go for a swing trade
BUY ONLY ABOVE 3145 DCB
⏱️ C.M.P 📑💰- 3115
🟢 Target 🎯🏆 – 16%
⚠️ Stoploss ☠️🚫 – 8%
⚠️ Important: Market conditions are Okish, Position size 50% per Trade. Protect Capital Always
⚠️ Important: Always Exit the trade before any Event.
⚠️ Important: Always maintain your Risk:Reward Ratio as 1:2, with this RR, you only need a 33% win rate to Breakeven.
✅Like and follow to never miss a new idea!✅
Disclaimer: I am not SEBI Registered Advisor. My posts are purely for training and educational purposes.
Eat🍜 Sleep😴 TradingView📈 Repeat 🔁
Happy learning with MMT. Cheers!🥂
VPRPL - NSE | Daily Timeframe📊 VISHNU PRAKASH R PUNGLIA LTD (VPRPL) – NSE | Daily Timeframe
📅 Date: May 29, 2025
📈 CMP: ₹190.49 (−0.41%)
📌 Ticker: NSE:VPRPL
🧠 Technical Overview
✅ Cup & Handle Pattern in Formation 🍵
Price action is carving out a clean Cup & Handle base near the ₹195.80 resistance zone. A breakout above this neckline could ignite a fresh upside rally. The symmetry, volume spike, and recent bullish structure are all supporting potential continuation.
🧪 Volume Analysis
Noticeable volume increase as the price nears breakout zone, indicating accumulation and rising interest.
📍 Key Levels to Watch
🟡 Breakout Resistance:
₹195.80 (horizontal neckline)
🟢 Support Zone:
₹174.50 (base support of the cup)
₹165 (lower handle risk zone)
🎯 Potential Targets (Post Breakout):
₹220
₹240
₹265 (pattern-measured target zone)
💡 Trade Plan
Entry (on breakout): ₹196+ (with strong volume confirmation)
Stop Loss: Below ₹174
Target Range: ₹220–₹265
Risk-Reward: ~1:2.5+
⚠️ Disclaimer
This chart analysis is for educational purposes only. Always DYOR (Do Your Own Research) and consult a financial advisor before making investment decisions.
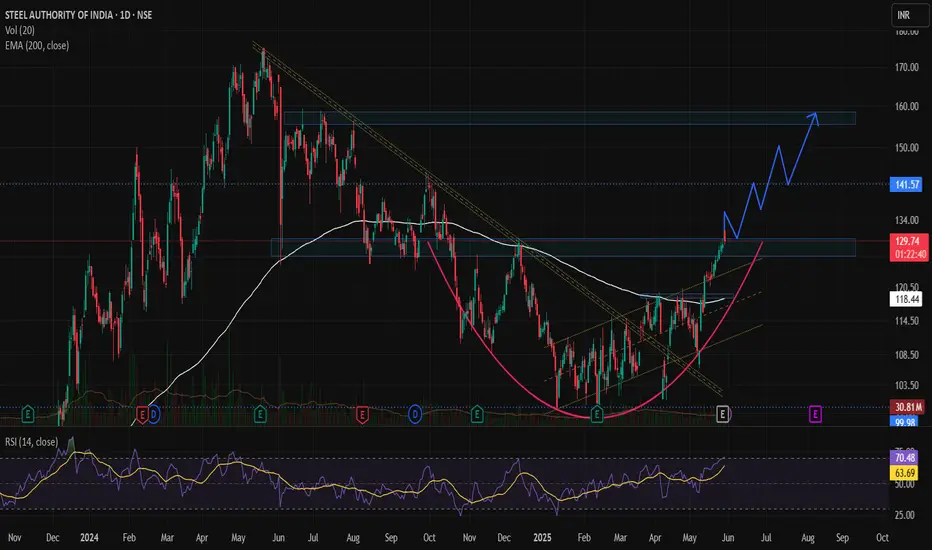
SAIL – Trend Reversal & Trade SetupA trend reversal appears to be taking shape in SAIL, indicating a potential shift from a downtrend to an uptrend. The stock has recently came out of a falling trendline and has closed above its 200-day EMA, placed at ₹117, signaling renewed strength and buyer interest.
🔄 Technical Outlook
- Breakout Zone: SAIL gave a technical breakout at ₹117, which aligns with its 200 EMA (Day), a widely tracked long-term moving average.
- Current Price Action: The stock is now trading at around ₹130, emerging from a rounding bottom pattern, which is a bullish continuation pattern indicating accumulation and base formation.
- Volume Analysis: Recent trading sessions have shown notable volume spikes, supporting the bullish breakout and trend reversal narrative.
- Fundamental Trigger: Q4 Results have been decent, providing a fundamental cushion to the technical setup. While not overly bullish, the results are good enough to support the ongoing trend reversal, especially if broader market sentiment remains stable.
📊 Support & Resistance Levels
- Crucial Support Zone: ₹127–₹130 — holding this zone is key for sustaining the bullish move.
- Key Breakout Zone: ₹127–₹130 — staying above this range will confirm the breakout and strengthen the upward move.
- Stop Loss: A protective stop-loss at ₹115, which lies just below the 200-day EMA, is advisable to manage downside risk.
🎯 Target Levels
First Target: ₹140
Second Target: ₹150
Final Target: ₹158
Time Frame: Expected to take 2–2.5 months to achieve the projected targets if momentum continues.
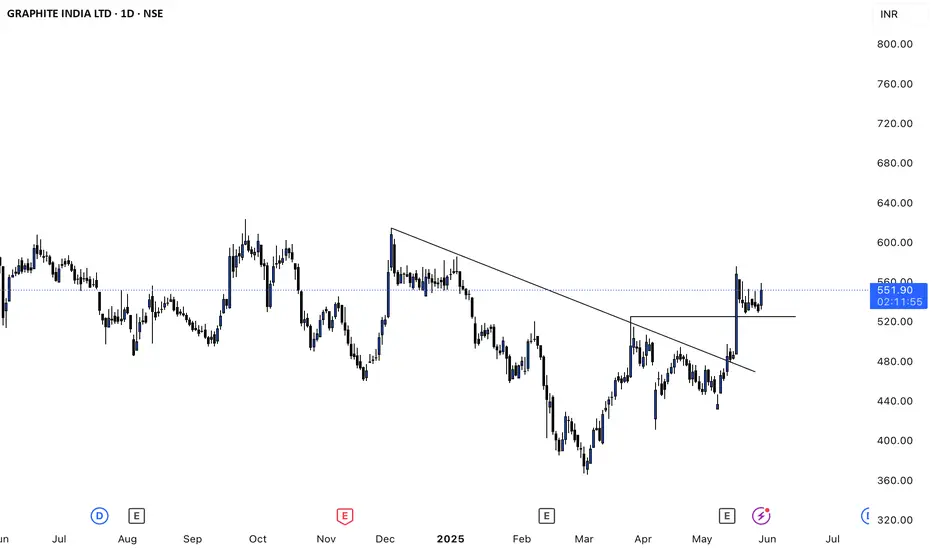
Graphite Price analysisGraphite India Ltd's share price is currently around ₹530.95 to ₹555.45 as of May 29, 2025. The stock has shown strong short-term momentum, gaining over 20% in the past month and more than 40% in the last three months. However, its one-year return is negative, down about 4–6%, underperforming the broader Sensex, though its five-year return remains impressive at over 190% .
Analyst sentiment is positive, with both covering analysts rating the stock as a "Strong Buy." Their average 12-month target price is ₹654, representing an upside of about 20–23% from current levels . The highest target is ₹718 and the lowest is ₹590 .
From a valuation perspective, Graphite India trades at a price-to-earnings (P/E) ratio of about 22–23x, which is significantly lower than its peer average (42x) and the broader Indian electrical industry average (nearly 40x). This suggests the stock is relatively undervalued compared to its sector . The estimated fair value per discounted cash flow models is around ₹421, so the current price is above fundamental fair value, but still below the fair P/E valuation of 49.8x .
Recent financials show volatility: revenue and net income have fluctuated quarter to quarter, with a notable recovery in Q1 FY25 after a loss in the previous quarter. Net profit margin also rebounded to 7.36% in the latest quarter .
Technically, the stock is experiencing mixed signals. Weekly indicators like MACD and Bollinger Bands suggest a mildly bullish trend, but monthly indicators remain sideways to mildly bearish. The daily trend is mildly bearish, reflecting some short-term caution despite strong recent gains .
In summary, Graphite India has recently rebounded sharply but remains below its 52-week high. It is seen as undervalued relative to peers, with analysts expecting further upside. However, technical and fundamental signals are mixed, so investors should watch for continued volatility and monitor quarterly performance for sustained recovery .
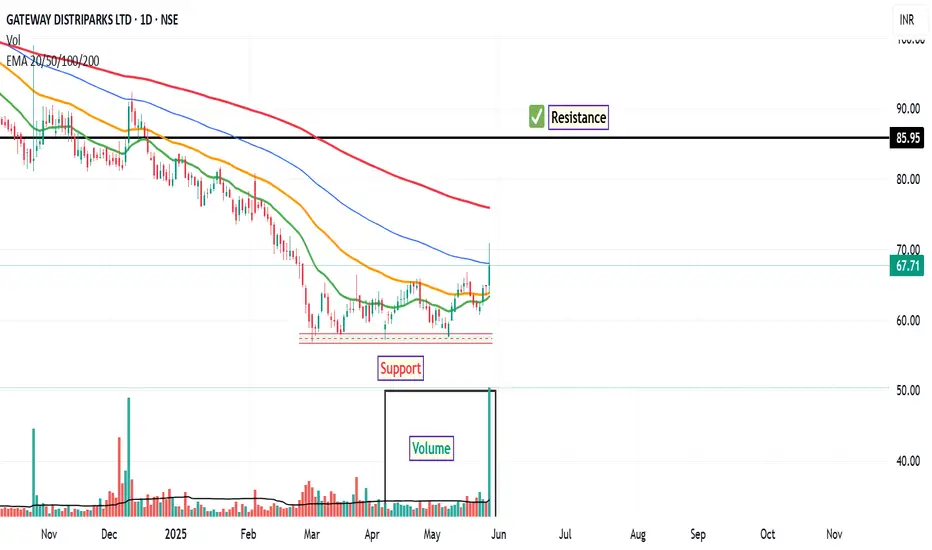
Gateway Distriparks Ltd: Technical CommentaryIn the latest trading session, Gateway Distriparks Ltd demonstrated notable technical strength. The stock successfully closed above both its 20D and 50D EMAs, indicating a potential shift in short- to medium-term momentum. Additionally, it managed to close above the 20-week EMA, which may suggest a broader trend alignment in favour of the bulls.
Volume analysis further supports this view, with a noticeable uptick in trading activity accompanying the price movement—often interpreted as a sign of institutional interest or increased market participation.
The RSI has crossed above the 65 level, a zone that is frequently associated with strong bullish momentum. This development may be interpreted by some market participants as a signal of continued buying interest.
From a price action perspective, the stock appears technically favorable in the range of ₹64, with a potential resistance zone near ₹85. A prudent risk management approach might involve monitoring for a close below ₹56, which could serve as a reference point for reevaluating the trade setup.
Disclaimer:
This analysis is intended solely for informational and educational purposes. It does not constitute investment advice or a recommendation to buy or sell any financial instrument. Market participants are strongly encouraged to conduct their own due diligence or consult with a certified financial advisor before making any investment decisions.