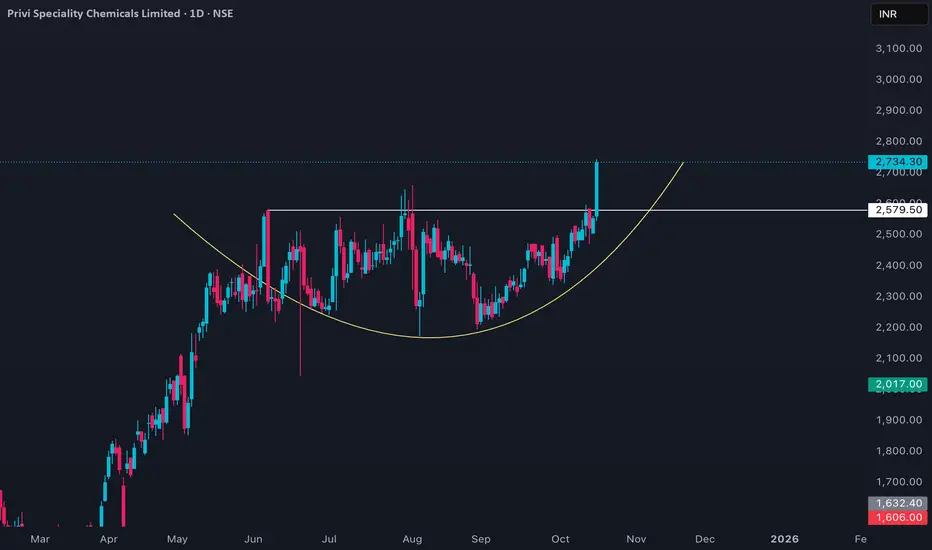
PRIVISCL Price actionPRIVISCL (Privi Speciality Chemicals Ltd) is currently trading with a price near ₹2,520–₹2,730, showing recent volatility with a slight downward bias. The stock touched a 52-week high at ₹2,660 in August 2025 and experienced a notable pullback from that level. On October 15, it closed at ₹2,539, after reaching a low of ₹2,505 during the session. Average daily volumes are moderate, and the deliverable percentage remains healthy, typically above 75%.
Short-term price action reflects a decline of about 8% over the past month and roughly 6% over the last week. However, the yearly performance remains strong, with a rise of 49% in the past 12 months, beating many industry peers. The company’s fundamentals show premium valuation levels with a trailing PE over 45, and the stock trades at nearly 10 times its book value. Market capitalization is around ₹9,600–₹10,700 crore, and debt remains moderate at a ~1:1 ratio. No promoter shares are pledged.
Earnings are solid: EPS has grown over 34% annually for the past three years, and EBIT margins have improved from 13% to 16% in recent quarters. Net income for the last quarter came in at ₹619 million, with revenue growth supported by positive operating trends. The company pays a small annual dividend, with the last payout at ₹5 per share, offering a modest yield.
Overall, PRIVISCL is fundamentally strong, but the recent pullback suggests short-term consolidation after a robust rally. Valuations are elevated, so price movement may remain volatile; long-term outlook is supported by growth in profitability and margins, with analysts maintaining high price targets above current levels.
Bullishsetup
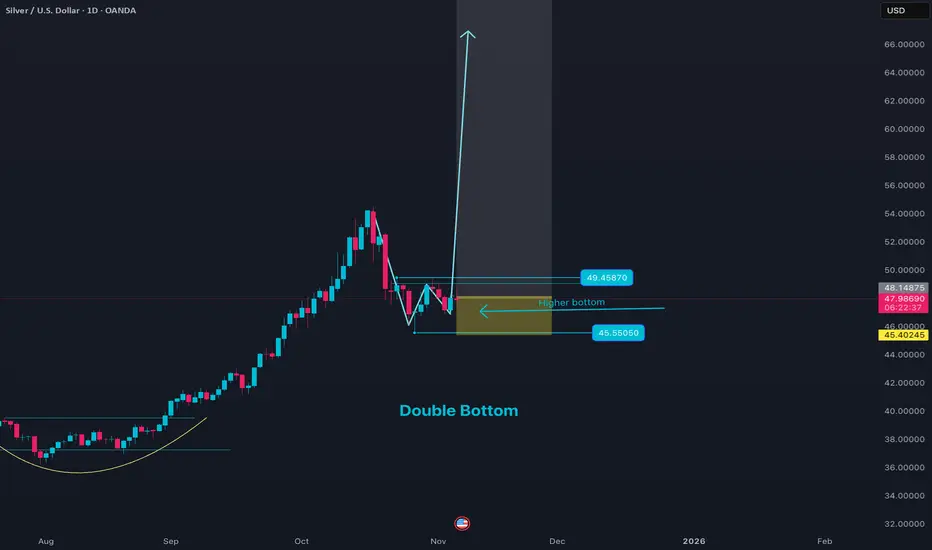
Silver Price Action set up with double bottomThe current price analysis for XAGUSD (Silver against US Dollar) in early November 2025 reveals a mixed but cautious outlook. Silver prices are moving within a corrective phase after exiting a bullish channel, trading approximately in the $47.50 range. Technical indicators such as moving averages currently suggest a bearish to neutral trend, with the price testing key resistance levels around $48.45.
Price momentum shows attempts to push higher, but resistance near $48.45 may lead to a price pullback or consolidation. If silver breaks above the critical resistance at $50.45, it could signal a renewed upward trend targeting levels around $52.35. Conversely, a failure to hold support near $46.75-47.00 may accelerate declines towards below $41.45, indicating a bearish phase.
Fundamentally, silver is influenced by the strength of the US dollar, industrial demand recovery (notably from solar energy and electronics sectors), and safe-haven buying amid global market uncertainty. The metal’s sensitivity to Federal Reserve policy and economic indicators continues to drive short-term volatility.
Traders should watch for sustained moves beyond the $48-$49 resistance or breakdown below $46.75 to gauge next directional trends. Overall, silver price dynamics suggest potential for both short-term rallies and corrections, dependent on macroeconomic cues and technical breakouts.
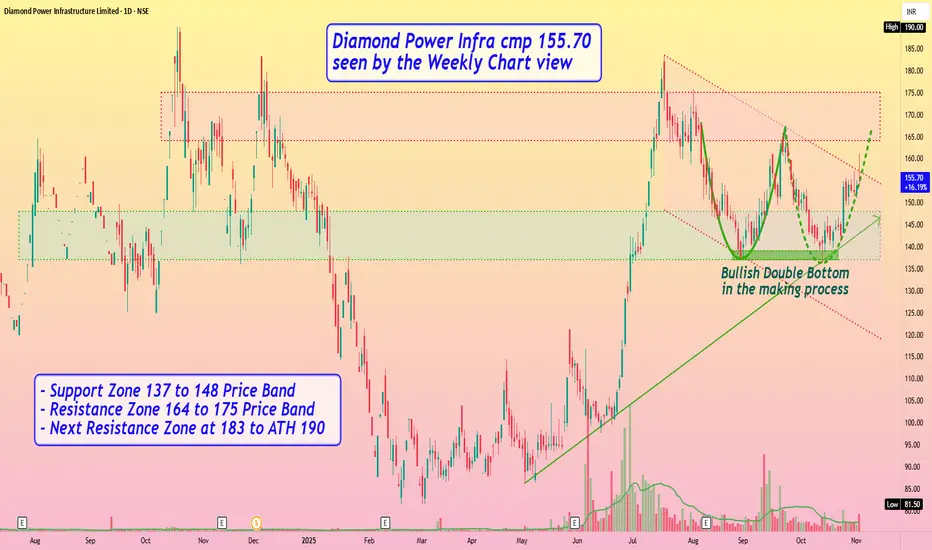
Diamond Power Infra cmp 155.70 seen by the Weekly Chart viewDiamond Power Infra cmp 155.70 seen by the Weekly Chart view
- Support Zone 137 to 148 Price Band
- Resistance Zone 164 to 175 Price Band
- Next Resistance Zone at 183 to ATH 190
- Bullish Double Bottom in the making process
- Rising Support Trendline seems well respected
- Volumes spiking regularly by close sync with avg traded qty
- Falling Price Channel Breakout seems to be in the making process
Bullish Fibonacci Retracement Setup📈 Bullish Fibonacci Retracement Setup
Intro
The chart illustrates a classic Bullish Fibonacci Retracement structure — highlighting key swing points, retracement levels, and potential continuation zones.
Price action shows a healthy pullback within a larger uptrend, suggesting accumulation before a possible breakout move.
⸻⸻⸻⸻⸻⸻⸻⸻⸻⸻⸻⸻⸻
🟩 Chart Overview
• Point A → Represents the Swing Low , marking the starting point of the current upward move.
• Point B → Denotes the Swing High , where price faced resistance before retracing.
⸻⸻⸻⸻⸻⸻⸻⸻⸻⸻⸻⸻⸻
📊 Key Fibonacci Levels
1️⃣ Validation Line (78.60%) — Entry is confirmed when any two consecutive candles close above this level, signaling a strong breakout and bullish continuation.
2️⃣ Minimum Retracement (61.80%) — This level has been achieved, and two candles have successfully closed below it, confirming a valid retracement phase within the Fibonacci structure.
3️⃣ Devalidation Line (38.20%) — If any two candles close below this level, the Fibonacci setup becomes invalid.
⸻⸻⸻⸻⸻⸻⸻⸻⸻⸻⸻⸻⸻
🎯 Trail Levels
Trail Levels →
• Stop-loss will trail two levels below the current active level.
• Each target level is confirmed only when two consecutive candles close above it successfully .
⸻⸻⸻⸻⸻⸻⸻⸻⸻⸻⸻⸻⸻
✅ Summary
• Price is retracing within a strong bullish trend.
• A close above the 78.6% Validation Line confirms continuation.
• Structure remains valid as long as price holds above the 38.2% Devalidation Line.
• Trail progressively with momentum as higher targets activate.
⸻⸻⸻⸻⸻⸻⸻⸻⸻⸻⸻⸻⸻
⚠️ Disclaimer:
📘 For educational purposes only.
🙅 Not SEBI registered.
❌ Not a buy/sell recommendation.
🧠 Purely a learning resource.
📊 Not Financial Advice.

Onmobile Global cmp 73.96 by Weekly Chart viewOnmobile Global cmp 73.96 by Weekly Chart view
- Support Zone 62 to 68 Price Band
- Resistance Zone 78 to 85 Price Band
- Bullish Rounding Bottom under Resistance Zone
- 1st Falling Resistance Trendline seems well sustained
- Next hurdles are Dotted Falling Resistance Trendline and Resistance Zone
- Volumes needed to provide fresh upside to give breakout above the Resistance
- Stock price trending well with positive technical indicators EMA, MACD, RSI, SAR, SuperTrend

PROTEAN Cup & Handle with double bottom reversal set upProtean eGov Technologies Ltd (PROTEAN) is trading around ₹865 as of early November 2025, with the stock having a year high of ₹1,535 and a low near ₹716. The stock has declined roughly 35% over the last 6 months and about 42% year-on-year from its peak. Valuation metrics show a price-to-earnings (P/E) ratio near 37 and a price-to-book (P/B) ratio around 3.45, indicating a relatively high valuation considering recent price declines.
The company has zero debt, which strengthens its financial stability, but revenue growth has been weak with a recent contraction and modest sales increase in some quarters. Profitability margins remain moderate, and earnings per share (EPS) stood at around ₹23.3. Dividend yield is low at about 1.16%.
Technically, the stock is trading below its 200-day moving average (~₹1,053) and close to the 50-day average (~₹879), suggesting some near-term weakness. Support may be near the recent lows of ₹716, with resistance close to ₹900–₹950. Overall, Protean presents a cautious medium-term outlook, with fundamental strengths balanced by valuation and growth concerns.

DIACABS - Mutliple confirmation set upDiamond Power Infrastructure Limited (DIACABS) is trading near ₹154 in early November 2025. The stock shows mixed signals with a short-term sell signal but a longer-term buy signal, indicating some near-term caution within a general positive trend. Resistance is expected around ₹169.6, and support near ₹127.9. Technical indicators point to bullish momentum as the price is above 25-day and 50-day moving averages, although short-term volatility has caused some pullbacks.
Financially, DIACABS has a market cap of about ₹7,628 crore and recently showed impressive quarterly revenue growth of over 200%, though profit margins remain modest near 5.7%. The debt level is significant (₹2,355 crore) compared to its cash reserves, which raises risk concerns for risk-averse investors. The stock has delivered extraordinary long-term returns (+879% over five years), but recent performance has been volatile with notable quarterly earnings growth fluctuations.
Overall, DIACABS is a high-potential but higher-risk mid-cap stock showing bullish technical signals for short to medium-term trading, with resistance near ₹170 and downside risk if it falls below ₹128.

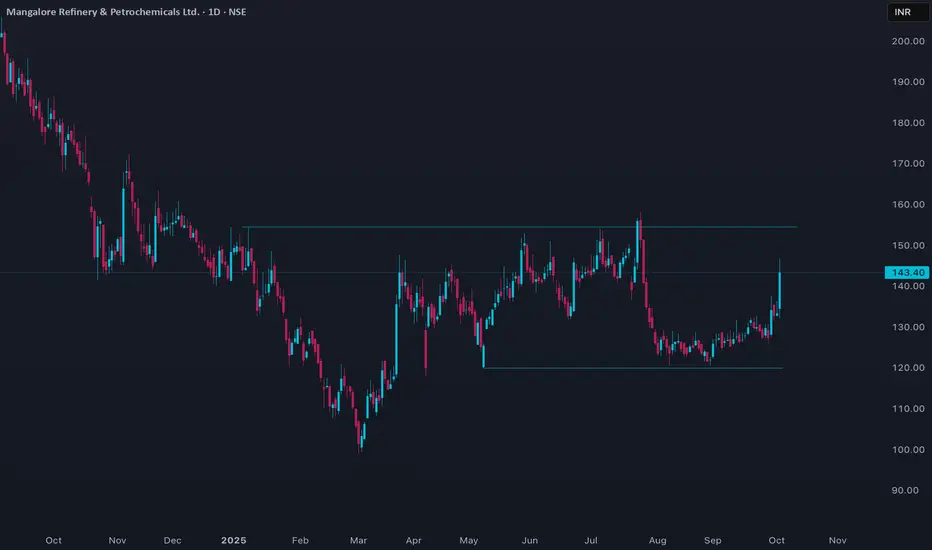
MRPL Price ActionMRPL (Mangalore Refinery and Petrochemicals Limited) has recently exhibited significant price movement influenced by fluctuations in global crude oil prices and domestic refining margins. The stock experienced increased volatility alongside broader market trends, with notable spikes following quarterly earnings announcements and sectoral news.
The price demonstrated a strong recovery trend from its recent lows, driven by improved capacity utilization, higher product realizations, and a stable demand outlook. MRPL faced resistance near key technical levels but witnessed buying interest on declines, indicating positive sentiment among traders.
Short-term momentum indicators suggest bullish bias as the stock maintains higher lows, while volumes remain relatively healthy. However, profit booking at higher levels and external macroeconomic factors could trigger consolidation phases. Overall, MRPL is being closely tracked due to its sensitivity to refinery margins and input costs, and any breakout above resistance could lead to further upside. Conversely, a sustained move below critical support zones might weaken the near-term outlook.
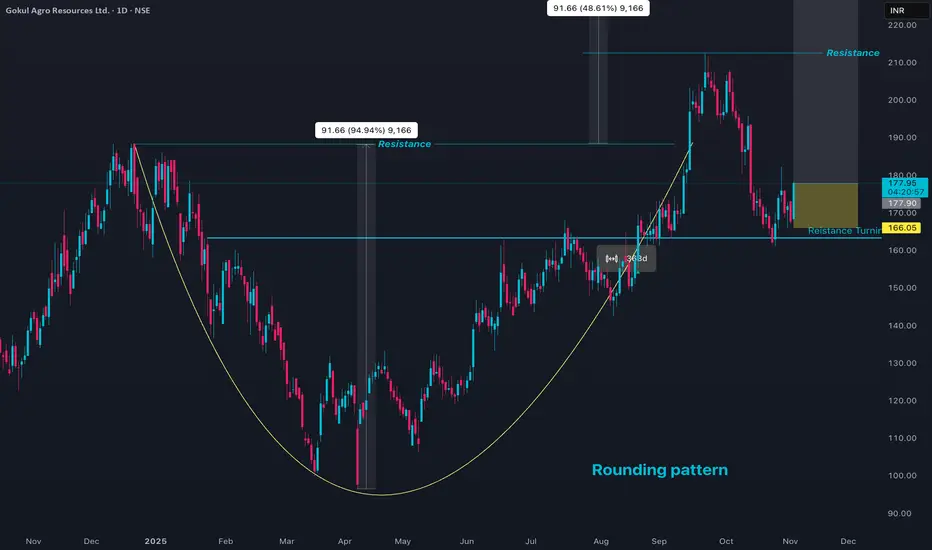
GOKULAGRO Price Action - Rounding patternGokul Agro Resources (GOKULAGRO) is trading around ₹168–₹171 as of early November 2025, down slightly from a recent 52-week high of ₹212.5. The stock has shown significant appreciation over the past 6 months (about +44%) and about +18.6% over the past year. The 52-week low is ₹96.55, indicating the stock is closer to its upper price range in the past year.
Key valuation metrics include a price-to-earnings (P/E) ratio near 19.1 and a price-to-book (P/B) ratio of about 4.9, suggesting the stock is moderately valued relative to its earnings and book value. The company has strong operating metrics with a return on capital employed (ROCE) above 34% and return on equity (ROE) around 27%, indicating efficient capital use and profitability.
The stock is moderately volatile with an average weekly price movement of about 6.3%, slightly above the industry average. Trading volumes are stable and supportive of price action. Recent technical analysis shows the stock trading above its short-term moving averages, with immediate support near ₹160–₹165 and resistance close to ₹175–₹180.
Overall, Gokul Agro Resources demonstrates solid fundamentals, attractive growth metrics, and stable price trends, making it a viable medium-term investment candidate, although caution is warranted if prices near resistance levels.
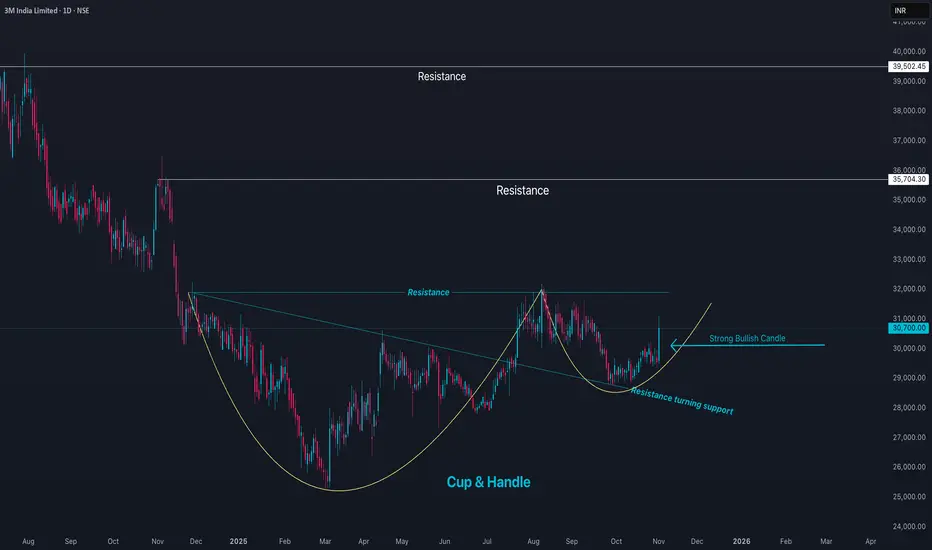
3MINDIA Price Action3M India Limited (3MINDIA) is currently trading around ₹30,865, marking a strong 4.4% rise in the latest session. The stock has a 52-week high near ₹37,133 and a low around ₹25,718, placing it closer to the upper end of its annual range. The market capitalization is approximately ₹33,300 crore.
3M India shows robust financial health with an earnings per share (EPS) of about ₹440 and a high price-to-earnings (P/E) ratio near 69, reflecting premium valuation driven by strong management, innovation, and brand dominance. The stock price recently traded above its 50-day (₹29,941) and 200-day (₹29,348) moving averages, confirming positive momentum.
Profit margins are solid, with an operating margin near 18.9% and net margin around 10.7%. Return on equity (ROE) is high at approximately 24%, and the company’s debt-equity ratio is very low (0.03), indicating a conservative capital structure. Dividend yield is modest at 1.85%. Volume trends indicate steady investor interest.
Technically, the stock is in an uptrend with nearest support at around ₹29,500 and resistance near the 52-week high zone around ₹37,000. Overall, 3M India maintains a strong market position, consistent earnings growth, and solid fundamentals, supporting a positive medium- to long-term outlook barring broader market disruptions.
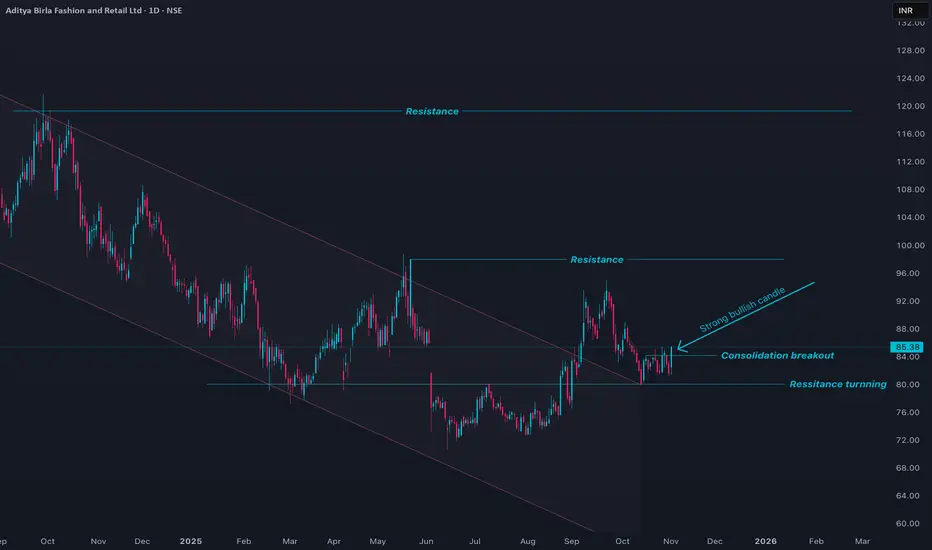
ABFRL Price ActionABFRL is currently trading near ₹85, reflecting a 4.5% gain in the latest session, but the stock remains deep in a correction from its 52-week high of ₹325. The year low is ₹70.55, so the recent rebound has been minor relative to the overall downtrend. Trading volumes are robust (7.8 million shares), but average volumes over the past three months exceed 9.5 million, indicating continued speculative interest and some exit activity by major holders.
Financials remain pressured: the company reports negative earnings per share (EPS 4.69) and a negative P/E ratio of .82, due to sustained losses in recent quarters. The stock trades below its 200-day moving average (4.7), underlining the long-term downtrend. Revenue contraction, negative compounded sales growth over 3 and 5 years, and declining promoter holdings further emphasize weak sentiment and a lack of fundamental support for an immediate turnaround. Return on equity (ROE) stays negative (0.9%).
Technically, ABFRL exhibits resistance at 00 and support in the 0–75 zone. The stock remains vulnerable to further corrections given its low profitability, high debt, and weak recovery signs, even as short-term volatility drives occasional rebounds. Caution is warranted for fresh positions, and any medium-term accumulation should be considered only with strict risk management and awareness of sector headwinds.
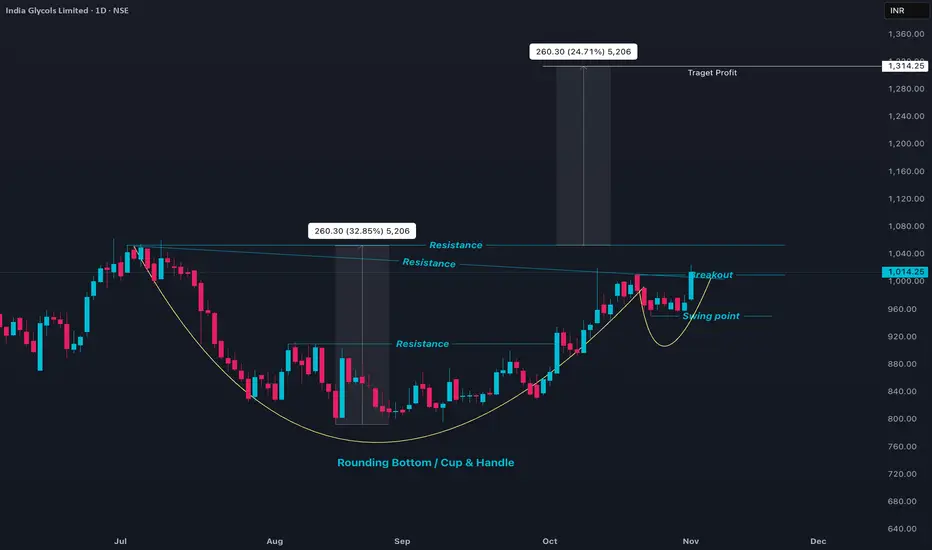
INDIAGLYCO - Cup & Handle PatternIndia Glycols (INDIAGLYCO) is currently trading around ₹1,014, showing significant strength with a recent 4.6% gain in the latest session. The stock has a 52-week high near ₹1,070 and a low near ₹503, indicating it is trading close to its annual high. The market capitalization is around ₹6,277 crore with solid average daily volume (~17,847 shares).
Valuation metrics indicate a P/E ratio of approximately 25.8, supported by strong earnings per share (EPS) of ₹39.35. The stock price is well above its 50-day (₹888) and 200-day (₹796) moving averages, showing strong short and long-term momentum. Volume trends reflect steady buying interest, confirming bullish sentiment.
Fundamentally, India Glycols has demonstrated robust financial performance with growth in revenue and profitability, making the current price attractive for medium to long-term investors. Technical indicators point to a continuation of the uptrend barring any major market corrections, with immediate support near ₹960 and resistance at ₹1,050–₹1,070.
Overall, India Glycols exhibits solid price momentum, healthy fundamentals, and strong trading volume, supporting its position as a structurally sound stock in the chemical and specialty chemicals sector.
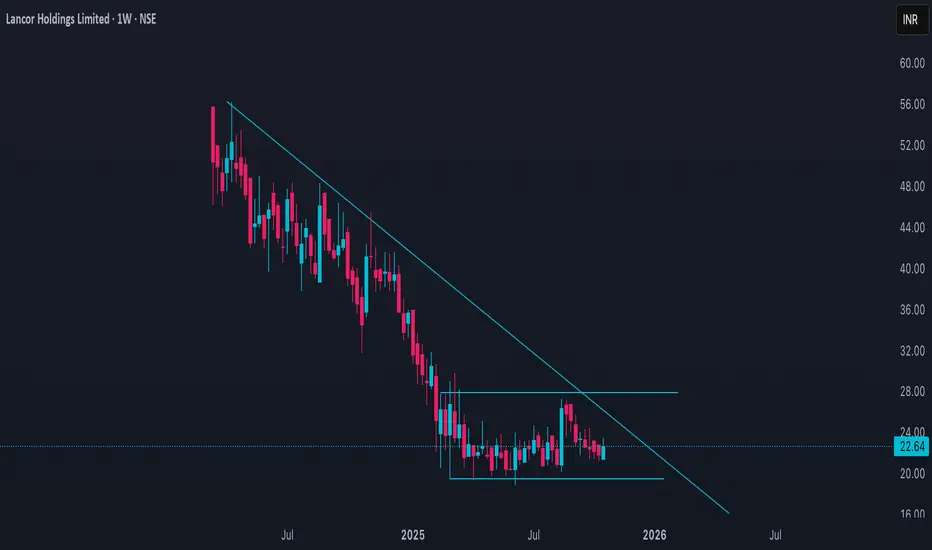
LANCORHOL Price ActionAs of **October 25, 2025**, **Lancor Holdings Limited (NSE: LANCORHOL)** closed at approximately **₹22.64**, marking a **4.6% gain** for the session after opening at ₹22.20. The stock traded between **₹21.68 and ₹23.44**, showing stable volume activity with around **1.07 lakh shares** traded. The company’s **market capitalization** stands near **₹166.5 crore**.
Fundamentally, the firm has a **P/E ratio of about 87.1**, which is relatively high compared to its sector, reflecting market expectations of future growth despite modest earnings. Its **EPS** is **₹0.26**, and the share trades below both the **50-day** (₹23.09) and **200-day moving averages** (₹23.75), suggesting mild short-term consolidation.
Technically, the stock is in a **sideways pattern** post its mid-year decline from a **52-week high of ₹45.90**. **Support** lies around **₹21.5–₹22**, while **resistance** is seen near **₹23.8–₹24.2**. A breakout above ₹24.5 may trigger a short-term uptick toward ₹26–₹27 zones, whereas sustained trade below ₹21.5 might invite a drift toward ₹20.
Lancor’s medium-term trend remains **neutral to slightly positive**, supported by stable project execution in real estate and manageable leverage. However, caution is warranted due to its thin profit margins and elevated valuation multiples, which suggest that the stock might consolidate before any substantial directional move.
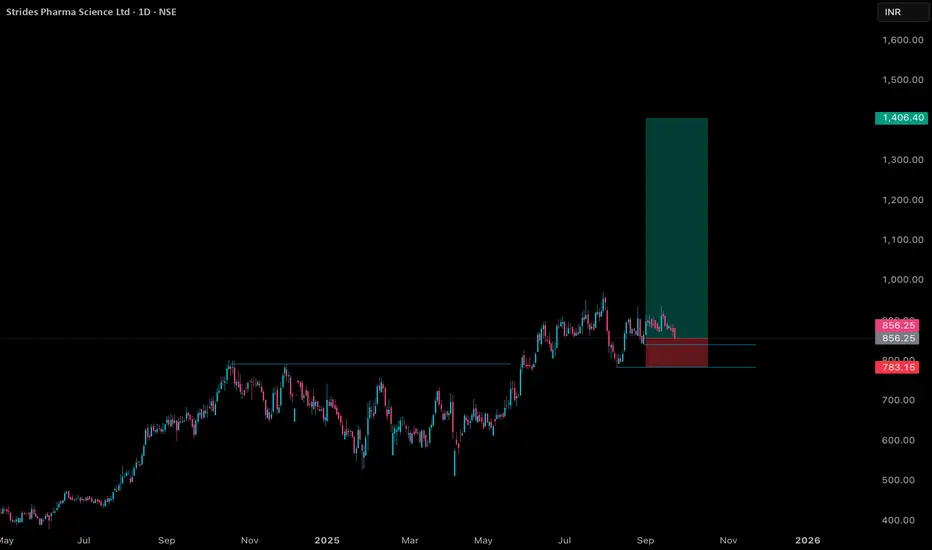
STAR Price ActionStrides Pharma Science Ltd (STAR) ended today at ₹869.3, closing near the upper half of its intraday range between ₹863.15 and ₹875.45. The stock displayed steady upward momentum throughout the session, supported by healthy trading volumes and buyers consistently stepping in closer to support zones.
### Technical Structure
- STAR trades above both its 20-day and 50-day moving averages, reaffirming short-term strength and a continued positive breakout structure.
- The daily chart features a sequence of higher lows, confirming bullish undertones and consistent accumulation by market participants.
- Momentum indicators such as RSI are hovering in the 58–62 range, signaling a healthy balance between momentum and overbought conditions, while the MACD line remains above the signal, adding to bullish conviction.
### Key Levels
- **Immediate Resistance:** ₹875; a close above this level may set the stock up for a push toward ₹900 and possibly ₹925 in the coming week.
- **Support Levels:** Strong buying support exists at ₹860. If breached, the next zone to watch is ₹845, which aligns with previous swing lows and potential moving average support.
### Volume and Sentiment
Trading activity was above the recent average, echoing the prevailing bullish sentiment and indicating that institutional and retail interest remains robust. A clear move with expanding volume above ₹875 would likely validate the next leg of the rally.
### Short-Term Outlook
As long as STAR maintains above ₹860, the trend remains firmly in favor of the bulls, and further gains can be expected on continued market strength. Short-term profit booking may occur near resistance, but overall sentiment and technicals point to strong underlying support for further appreciation.
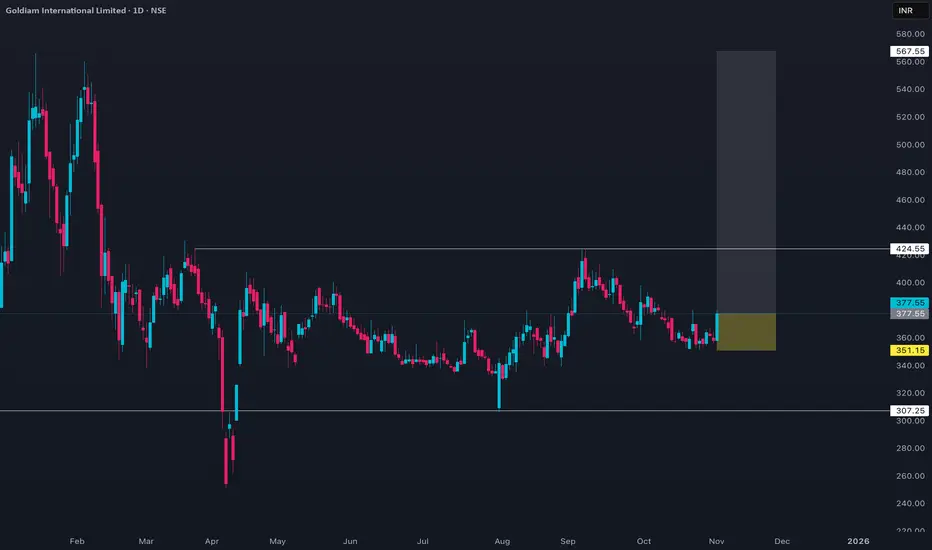
GOLDIAM Price ActionGOLDIAM is trading around ₹356, showing moderate stability after a volatile year marked by a 52-week high of ₹569 and a low of ₹251. The stock has corrected more than 35% from its recent peak but outperformed the Indian luxury sector and broad market over the past twelve months. Over the last week, GOLDIAM’s price has shown little change, indicating current consolidation, while the one-year return stands at about 4.2%—above industry and market averages.
Valuation ratios for GOLDIAM highlight a P/E of approximately 31–32 and a P/B of about 5.4, which are on the higher side, suggesting an overvalued status relative to its historical intrinsic value (recent estimates put fair value near ₹58). Market cap stands around ₹4,018 crore, and the dividend yield remains modest at 0.84%. The company maintains strong annual revenue growth (near 30% YoY recently) and nearly zero debt, with consistently healthy dividend payouts each year.
Technical views suggest the stock’s volatility hovers near 5%, consistent with the Indian market average, but the latest technical signals favor caution: momentum indicators and moving averages show a neutral to mild bearish undertone, with next major support around ₹340 and resistance near ₹375–₹390. Seasonal trends indicate that November returns are historically muted or negative for GOLDIAM, so cautious positioning may be justified in the immediate term.
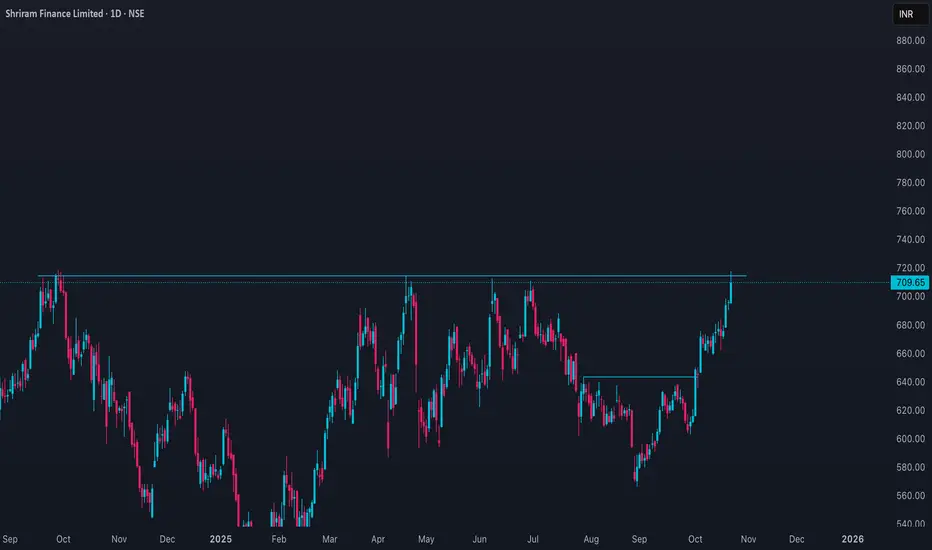
SHRIRAMFIN Price ActionAs of October 23, 2025, **Shriram Finance Ltd (NSE: SHRIRAMFIN)** closed approximately at **₹695.25**, showing sideways price action near its recent high. The stock traded within the range of ₹675 to ₹717.75 during the day, with a market capitalization of about **₹1.33 lakh crore**.
The company demonstrates sturdy financials with a trailing P/E ratio near **13.78**, an EPS of roughly **₹51.51**, and a book value of ₹278.52 per share, reflecting reasonable valuation metrics relative to the NBFC sector. Its dividend yield stands near **1.4%**.
From a technical perspective, Shriram Finance has been consolidating after strong rallies earlier this year. The stock holds key supports around ₹680–₹690 with resistance near ₹710–₹715. The Relative Strength Index (RSI) signals a neutral to mildly bullish momentum around 55–60, suggesting room for further upside while consolidating. A sustained rise above ₹715 could trigger renewed buying interest, targeting levels around ₹740–₹750. Conversely, a drop below ₹680 may signal short-term weakness.
Overall, Shriram Finance’s outlook remains **stable to bullish** supported by robust earnings, consistent operational performance, and attractive valuation compared to peers. Investors are advised to watch for volume confirmation on any breakout above resistance for momentum continuation.
ITCHOTELS Price ActionITCHOTELS is trading around ₹216, with the stock declining approximately 1.8% in the last week, 3.9% over the past month, and about 5.9% over the past three months, though it remains up 26% year-on-year. The stock’s 52-week high is ₹261.6 and the low is ₹155.1, so it is currently trading about 17% below its peak but well above its yearly low.
Valuation metrics show a high P/E ratio of 71 and a P/B of 4.2, indicating valuation concerns compared to sector averages, although profitability is strong with robust operating and net margins—PAT margin is above 18%. The stock’s performance has lagged the benchmark in recent weeks, despite healthy growth in net profit (up 44% year-on-year for the most recent quarter) and revenue rising 7.5% quarter-on-quarter.
Technically, the stock has underperformed due to weaker short-term sentiment, trading below its short and medium-term moving averages but above long-term averages. Delivery volume has increased, hinting at some accumulation after the recent fall. Given the moderate risk profile and strong long-term fundamentals, ITCHOTELS is showing profit-taking and near-term weakness within a longer-term uptrend, with support expected near ₹210–₹215 and resistance near ₹230–₹235.

TFCILTD Price pyramid set upAs of October 23, 2025, **Tourism Finance Corporation of India Ltd (TFCILTD)** closed around **₹71.20**, slipping nearly **3%** for the day after hitting an intraday high of **₹73.60** and a low near **₹69.40**. The stock has shown strong appreciation this year, gaining over **150%** in the past twelve months, but has entered a short-term consolidation phase following its recent high of ₹75.90.
The current **market capitalization** stands near **₹3,400 crore**, placing it in the small-cap segment. Its **P/E ratio** is about **7.5x**, with a **P/B ratio of 0.69**, indicating that the stock remains undervalued relative to its sector peers. Earnings per share (EPS) are approximately ₹9.46, and the **dividend yield** is around **0.8%**.
Technically, the stock is in a corrective phase after a strong rally since June 2025. It is trading around its 20-day moving average, which acts as immediate support near **₹70–₹71**, while resistance lies around **₹74–₹75**. The **RSI** has moderated toward neutral zones, and momentum indicators signal a pause in the uptrend. If the price holds above ₹70, it may consolidate before attempting another breakout; a decline below ₹69 could indicate short-term weakness toward ₹66–₹67.
The medium- to long-term outlook remains constructive given strong profitability, low valuations, and improving financials, though near-term traders may experience volatility as the stock digests recent gains.

ULTRACEMCO Price ActionUltraTech Cement (ULTRACEMCO) is trading around ₹11,940 to ₹11,950 as of the latest session, after seeing consolidation from its recent all-time high of ₹13,097 set in September 2025. The stock has declined about 1.5% this month and is down around 2.5% over three months, but it remains up by 7–8% over the last year. Price volatility has been low, with average weekly swings of only about 2%—well below sector averages—indicating chart stability for large-cap traders.
The recent quarterly results show revenue of approximately ₹817 billion and a net profit margin close to 9%, but the latest net profit dropped about 44% quarter-on-quarter to ₹12.3 billion, despite revenues still beating estimates. The trailing twelve months (TTM) P/E ratio is about 48, and the book value per share stands at roughly ₹2,400. Delivery volume remains healthy at close to 70%. Promoter holdings are stable at 59.23%. Yield is modest at 0.65%, reflecting the company’s low dividend payout compared to growth retention. Analyst sentiment is mixed to mildly positive, and consensus targets range widely (₹7,600–15,670).
Technically, the stock is currently 8% below its 52-week high. Long-term trend strength remains intact, though further correction is possible if broader sector weakness persists. Price action suggests accumulation near ₹11,900 could see support, while major resistance is up near recent highs.

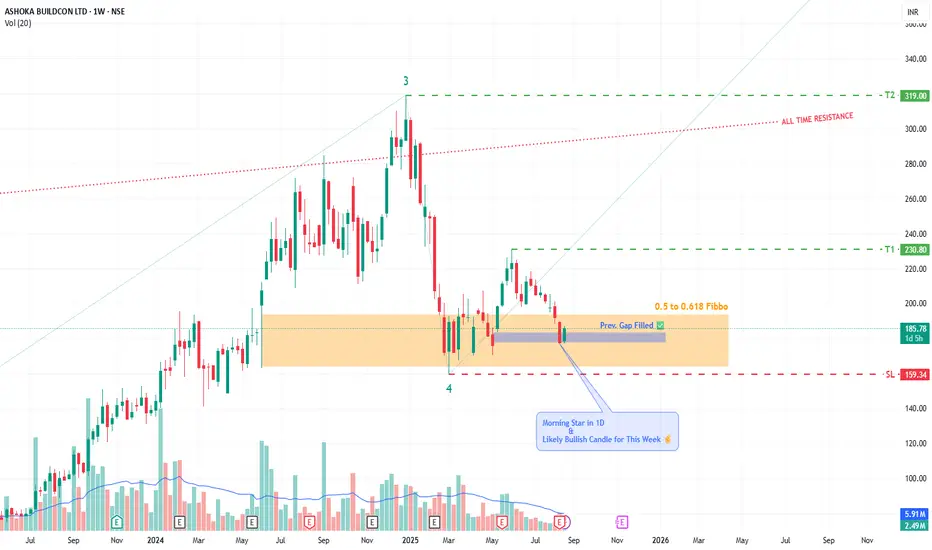
VIEW ON ASHOKA BUILDCON BY KRS CHARTSDate - 21st August 2025 / 10:35 AM
Why ASHOKA ?
1. All-time Bullish Stock technically making HHs & HLs.
2. Further, Price is already in Fibbo Golden Reversal Zone for quite a few times and showing bullish traits again.
3. I was eagerly waiting for to retrace down little bit for 1D previous gap-up needed to be filled it & it's Done!
4. 1D it is showing Morning Star Candle sticks Cluster s with more green Candles and this week likely to be closing with bullish candle stick.
5. Wave Theory wise we are in 4th Wave last upside 5th is loading.
All in All, this is good level to look ASHOKA as a good opportunity 👍✅
Targets and SL are Marked in Chart.
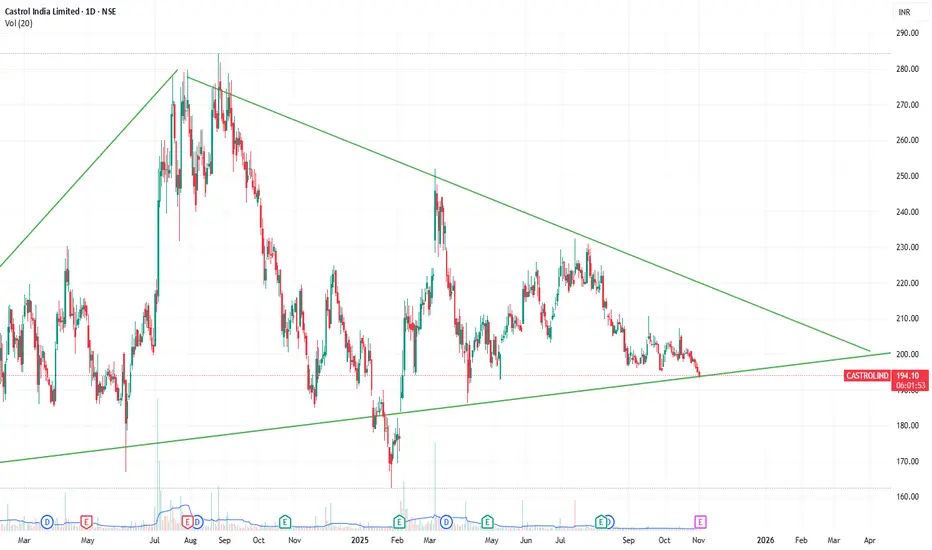
Study and Bullish on Result Tomorrow | Castrol India Ltd Castrol India is showing an interesting setup both fundamentally and technically ahead of its upcoming quarterly results on 4th November 2025.
🔹 Fundamental View:
The company has maintained strong performance over recent quarters —
Net Sales steadily growing from ₹1,293 Cr (Mar 2023) to ₹1,496 Cr (Jun 2025).
EBITDA and PAT margins holding firm around 22–23% and 16%, respectively.
Very low debt levels with negligible interest costs.
Overall, Castrol continues to deliver stable profitability and cash flows, a positive sign for long-term investors.
🔹 Technical View:
The stock is currently trading near a strong trendline support zone around ₹190–195, forming a large symmetrical triangle since early 2024.
Support: ₹190
Resistance: ₹210–225
Pattern: Symmetrical triangle tightening towards breakout zone
RSI near neutral–oversold zone (suggesting possible reversal)
🔹 My View:
The setup looks attractive for a potential bounce or breakout if the results come strong.
If ₹190 holds, we can expect a short-term move towards ₹210–₹230, and possibly ₹250+ on breakout confirmation.
Stop loss: ₹185
Conclusion:
Studying this setup closely — both fundamentals and technicals indicate strength.
I’m bullish on Castrol India for a result-based momentum move.
Let’s watch how the stock reacts post-results.
📝 Note:
This analysis is shared purely for educational and study purposes, not as financial advice.
Always do your own research or consult a qualified advisor before making any investment decisions.
INTELLECT Price ActionAs of **October 24, 2025**, **Intellect Design Arena Ltd (NSE: INTELLECT)** closed at **₹997.95**, gaining around **3.6%** from the previous close of ₹963.50. The stock opened at **₹965.00**, reached a **high of ₹1,008.00**, and a **low of ₹950.50**, supported by a trading volume of about **4.01 lakh shares**.
The company’s **market capitalization** stands around **₹13,760 crore**, with an **EPS of ₹25.05** and a **P/E ratio near 39.8**, suggesting a moderate premium valuation compared to the IT sector average. The **50-day moving average** is around ₹985, and the **200-day moving average** near ₹925, indicating a continued uptrend in both short-term and medium-term momentum.
From a technical perspective, the stock shows signs of strength after recent consolidation between ₹940 and ₹995. The **RSI level at ~60** supports sustained positive momentum without nearing the overbought zone. **Immediate support** lies near ₹970–₹975, while **resistance** is placed at ₹1,010–₹1,025. If the stock sustains above ₹1,010, it could aim for the next target range of ₹1,050–₹1,080.
In the broader outlook, **Intellect Design Arena** remains fundamentally strong with consistent revenue growth in digital banking and fintech solutions. Robust margins, recurring international contracts, and growing adoption of its AI-driven platforms reinforce a bullish medium-term trend, though investors should watch for consolidation near ₹970 as a potential accumulation zone.

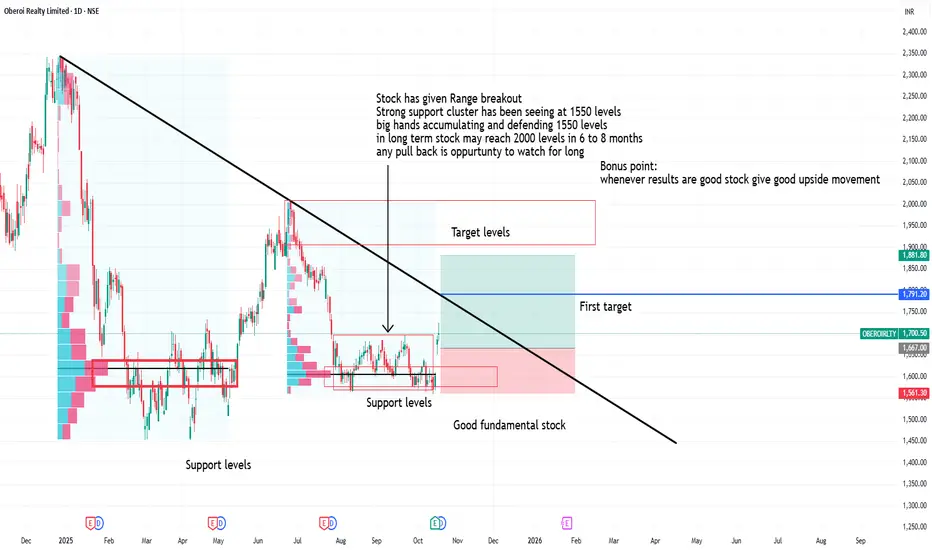
Oberoi reality range breakoutStock has given Range breakout
Strong support cluster has been seeing at 1550 levels
big hands accumulating and defending 1550 levels
in long term stock may reach 2000 levels in 6 to 8 months
any pull back is oppurtunty to watch for long