INTELLECT Price ActionAs of **October 24, 2025**, **Intellect Design Arena Ltd (NSE: INTELLECT)** closed at **₹997.95**, gaining around **3.6%** from the previous close of ₹963.50. The stock opened at **₹965.00**, reached a **high of ₹1,008.00**, and a **low of ₹950.50**, supported by a trading volume of about **4.01 lakh shares**.
The company’s **market capitalization** stands around **₹13,760 crore**, with an **EPS of ₹25.05** and a **P/E ratio near 39.8**, suggesting a moderate premium valuation compared to the IT sector average. The **50-day moving average** is around ₹985, and the **200-day moving average** near ₹925, indicating a continued uptrend in both short-term and medium-term momentum.
From a technical perspective, the stock shows signs of strength after recent consolidation between ₹940 and ₹995. The **RSI level at ~60** supports sustained positive momentum without nearing the overbought zone. **Immediate support** lies near ₹970–₹975, while **resistance** is placed at ₹1,010–₹1,025. If the stock sustains above ₹1,010, it could aim for the next target range of ₹1,050–₹1,080.
In the broader outlook, **Intellect Design Arena** remains fundamentally strong with consistent revenue growth in digital banking and fintech solutions. Robust margins, recurring international contracts, and growing adoption of its AI-driven platforms reinforce a bullish medium-term trend, though investors should watch for consolidation near ₹970 as a potential accumulation zone.
Bullishsetup

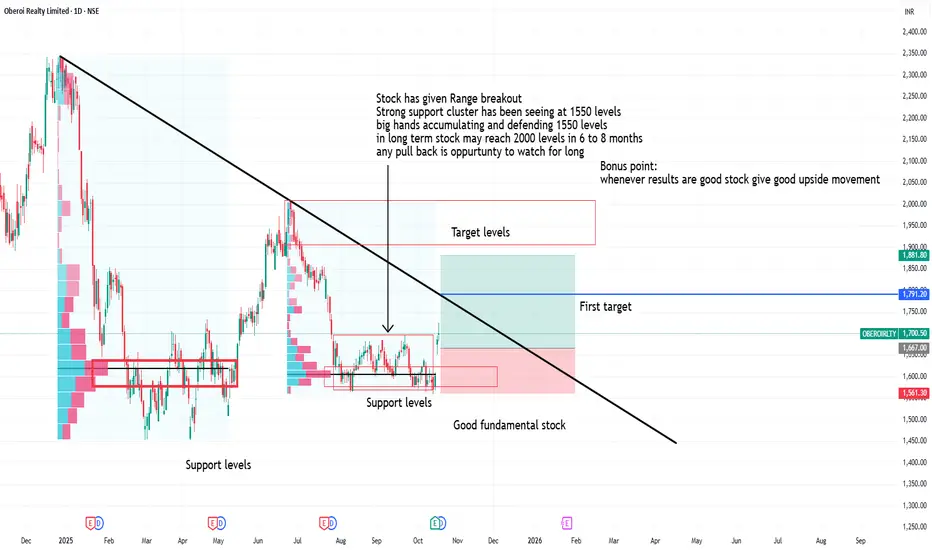
Oberoi reality range breakoutStock has given Range breakout
Strong support cluster has been seeing at 1550 levels
big hands accumulating and defending 1550 levels
in long term stock may reach 2000 levels in 6 to 8 months
any pull back is oppurtunty to watch for long
Indian Hotels Co. Ltd:NSE | swing trading setup | Study🧠 1. Chart Pattern Formation
You’ve drawn and highlighted three rounded bottoms (circled in blue). This resembles a Triple Bottom pattern, which is a bullish reversal formation after a downtrend or a long consolidation.
Support zone: Around ₹710–₹715 (black horizontal line).
Resistance trendline: Descending (green line) connecting lower highs since the major top near ₹900.
If the price breaks above this descending trendline convincingly with volume, it could confirm a trend reversal or at least a strong swing rally.
-----------
📈 2. Key Levels
Support: ₹710–₹715
Immediate Resistance: ₹760 (trendline resistance)
Breakout Target 1: ₹820 (approx. +9–10%)
Breakout Target 2: ₹870–₹900 (approx. +15–16%)
These match the vertical projections (blue measured moves) drawn on the chart.
⚠️ 5. Risks / Invalidations
If the stock falls below ₹710 with volume, the bullish setup fails.
Consolidation can continue if breakout lacks volume.
Broader market weakness (Nifty, hotel sector) could delay the move.
Pattern: Triple bottom with descending trendline
Bias: Bullish if breakout confirmed
Setup Type: Swing trade (2–6 weeks)
Targets: ₹820 / ₹880–₹900
Stop-loss: ₹710
⚠️ Note:
This is not a recommendation to buy or sell. The above analysis is for educational and technical study purposes only. Always do your own research and consider your risk tolerance before taking any trade.

BLACKBUCK Price ActionAs of October 22, 2025, **Zinka Logistics Solutions Ltd (BlackBuck Limited)** traded around **₹733.50** on the NSE and **₹733.35** on the BSE, registering a **6% daily gain** from previous levels near ₹690. The stock hit an intraday high of about **₹748** and a low of approximately **₹699**, marking a fresh 52-week high zone. Its **market capitalization** stands near **₹13,250 crore**, reflecting strong growth momentum in investor sentiment this week.
Zinka’s **52-week range** is between **₹248.35 and ₹748**, showing a substantial multi-fold rally over the past year. The company’s **P/E ratio** is currently around **36.5**, while **P/B stands near 10.7**. The **RSI** hovers close to 68, indicating high momentum but nearing overbought levels, and all key moving averages (20-, 50-, and 200-day) remain aligned positively — confirming a continued uptrend.
From a technical view, the **immediate support zone** is placed near ₹705–₹710, with major resistance around ₹750. A breakout above ₹750 could extend the rally toward ₹780–₹800, while holding above ₹700 keeps the short-term structure constructive.
On the fundamental front, the firm recently reported a **72% quarter-on-quarter growth in consolidated revenue** and a **17% increase in profit year-on-year** for Q1 FY2025–26, supported by stronger digital logistics volumes and reduced operating expenses.
Overall, Zinka Logistics (BlackBuck) remains **firmly bullish in the short term** with upward bias, though minor profit-booking may occur near ₹750–₹760 before the next leg of momentum.

EMA Ribbon - Trend Strength & Reversal insight🧭 1. Overview
The EMA Ribbon is a set of multiple Exponential Moving Averages (EMAs) layered together to visualize the trend strength, direction, and possible reversals.
It helps traders identify when the market is trending strongly or losing momentum.
In this chart,
• Yellow lines = Short-term EMAs (react quickly to price)
• White lines = Long-term EMAs (show overall market direction)
When used together, they form a ribbon-like structure that acts as both dynamic support and resistance.
⸻⸻⸻⸻⸻⸻⸻⸻⸻⸻⸻⸻
📊 2. EMA Ribbon on Chart
• When the ribbon expands, it shows trend strength increasing — momentum is strong.
• When the ribbon contracts (becomes narrow), momentum is cooling, often leading to consolidation or reversal.
• The slope and crossover behavior of short and long EMAs reveal bullish or bearish momentum.
⸻⸻⸻⸻⸻⸻⸻⸻⸻⸻⸻⸻
🟢 3. Bullish Momentum
When short-term EMAs (yellow) stay above the long-term EMAs (white):
• EMA ribbon slopes upward → confirms an ongoing uptrend.
• Ribbon acts as a dynamic support zone — price often bounces from it.
• Indicates strong buying pressure and trend continuation.
• The wider the ribbon, the stronger the bullish momentum.
⸻⸻⸻⸻⸻⸻⸻⸻⸻⸻⸻⸻
🔴 4. Bearish Momentum
When short-term EMAs (yellow) fall below long-term EMAs (white):
• EMA ribbon slopes downward → confirms a downtrend.
• Ribbon acts as a dynamic resistance zone — price struggles to break above it.
• Indicates strong selling pressure and bearish control.
• Ribbon expansion during a downtrend suggests momentum strength from sellers
⸻⸻⸻⸻⸻⸻⸻⸻⸻⸻⸻⸻
📘 5. Summary
✅ Bullish Phase: Short EMAs above long EMAs → strong uptrend & support zone.
❌ Bearish Phase: Short EMAs below long EMAs → strong downtrend & resistance zone.
⚙️ Neutral / Reversal Phase: EMAs narrow together → momentum cooling, await breakout.
The EMA Ribbon is not just a visual trend indicator — it’s a dynamic momentum tool that adapts with price, helping traders identify both trend continuation and early reversal signs.
____________________________________________________________
⚠️ Disclaimer
📘 For educational purposes only.
🙅 Not SEBI registered.
❌ Not a buy/sell recommendation.
🧠 Purely a learning resource.
📊 Not Financial Advice.

CARTRADE Price ActionTIme to pyramid
CarTrade Tech Limited’s stock has delivered a strong performance as of late August 2025, trading close to ₹824 after rallying more than 40% in the past three months and reaching a new 52-week high. The surge is largely attributed to robust quarterly results, improved profit margins, and expanding digital business operations, which have helped regain investor confidence.
CarTrade’s financials show healthy revenue growth, continuing profitability improvements, and solid cash reserves that allow for continued investment into technology and product innovation. The company operates with minimal debt, maintaining operational flexibility and a stable cost structure. Its price-to-earnings ratio, while now elevated, actively reflects anticipated future growth rather than merely past performance.
Technically, CarTrade is trading above major moving averages, signaling ongoing bullish momentum, and there’s evidence of heightened institutional interest. While the trend is positive, the stock may see intermittent profit-taking and short-term volatility before stabilizing at higher levels. Overall, CarTrade presents a strong growth profile backed by sound financial fundamentals, with momentum favoring further gains if execution remains solid.

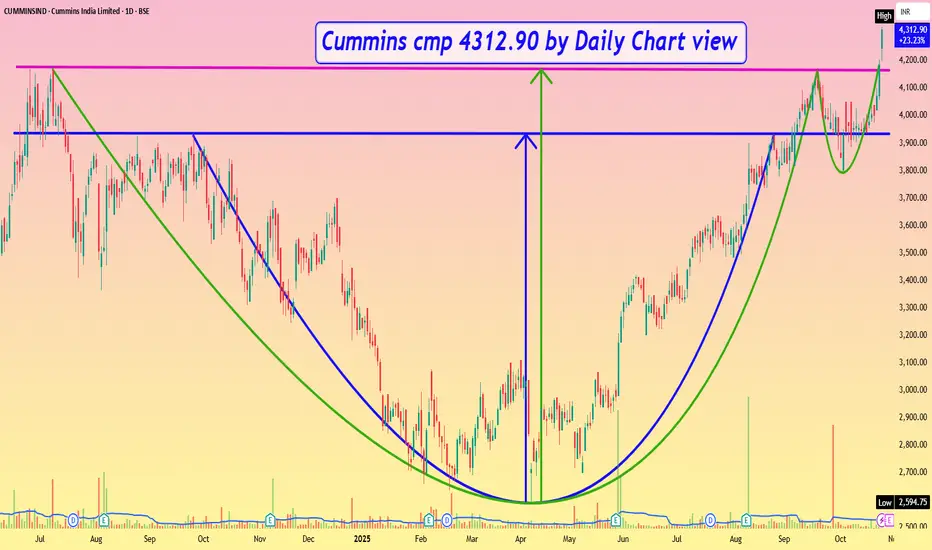
Cummins cmp 4312.90 by Daily Chart viewCummins cmp 4312.90 by Daily Chart view
- Support Zone 3900 to 4100 Price Band
- Only Resistance at ATH 4323.85 done today
- Very Strong Bullish Chart setup and Technical patterns made
- 1st Logical Target price level +/- 5250 by inner Rounding Bottom
- 2nd Logical Target price level +/- 5735 by broader Cup & Handle pattern
ECLERX another entry set upECLERX traded in a narrow range today, with the price displaying a consolidative pattern through most of the session. The stock opened flat and witnessed brief upward movements, but overall momentum remained muted as it hovered near key support levels. Intraday volatility was low, with buyers and sellers appearing evenly matched and no clear directional bias emerging.
Price action suggests market participants are awaiting fresh cues before taking definitive positions, with the stock holding above a short-term moving average. Technical indicators point to a neutral stance, as neither bullish nor bearish signals have dominated trade today. The immediate outlook remains sideways unless there is a decisive break above the session high or below the established support zone.

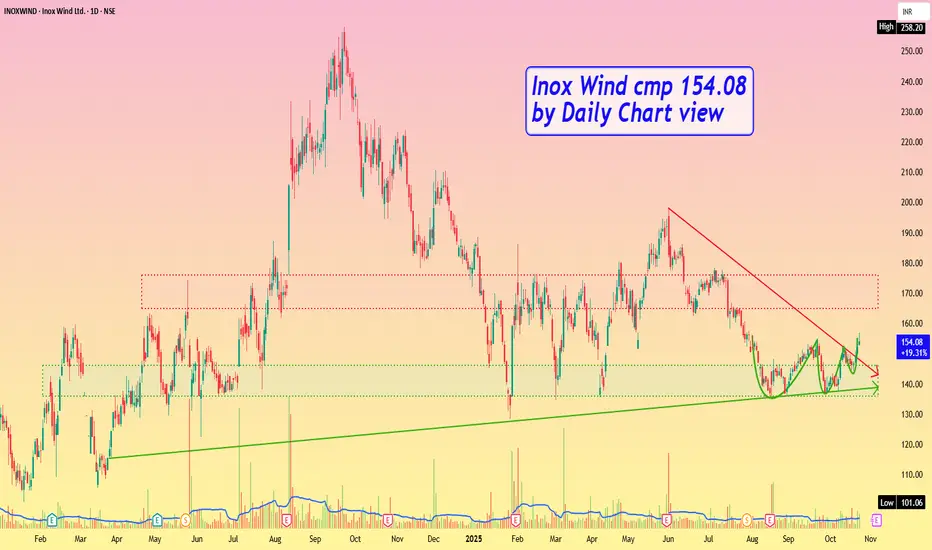
Inox Wind cmp 154.08 by Daily Chart viewInox Wind cmp 154.08 by Daily Chart view
- Support Zone 136 to 146 Price Band
- Resistance Zone 165 to 176 Price Band
- Volumes in good sync with avg traded quantity
- Falling Resistance Trendline Breakout seems sustained
- VCP pattern seems in making process by technical chart setup
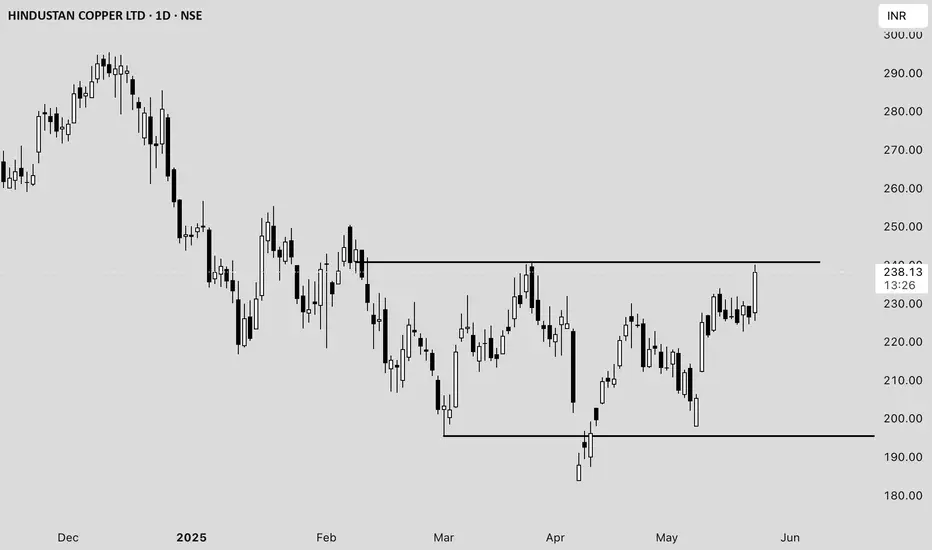
Hindustan Copper Ltd. (HINDCOPPER) Price Analysis **Date:*#### **Current Price and Intraday Movement**
- **Latest Price:** ₹237.98 (+5.09% / +₹11.52)
- **Day’s Range:** ₹225.50 – ₹240.10
- **Open:** ₹227.60
- **Previous Close:** ₹226.46
- **Volume:** 1.63 crore shares (well above average daily volume of 55.89 lakh)
#### **Technical Overview**
- **52-Week Range:** ₹183.82 – ₹381.90
- **50-Day Average:** ₹216.99
- **200-Day Average:** ₹260.58
- **Market Cap:** ₹23,013 crore
- **P/E Ratio:** 57.48
- **EPS:** ₹4.14
#### **Recent Performance and Trends**
- **Short-Term Trend:** The stock surged over 5% today, outperforming its sector and showing strong buying interest .
- **Volume Spike:** Today’s volume is nearly triple the average, indicating heightened trader participation .
- **Technical Position:** The stock is trading above its 50-day moving average but remains below the 200-day average, suggesting a recovery from recent lows but still under medium-term resistance .
- **Support/Resistance:** Immediate resistance is near ₹240–₹249 (upper circuit), with support at ₹225 and ₹216 (50-DMA) .
#### **Fundamental Snapshot**
- **Valuation:** High P/E ratio (57.48) signals expensive valuation relative to earnings .
- **Profitability:** EPS at ₹4.14; profit margins have been under pressure.
- **Industry Position:** Hindustan Copper is India’s primary copper producer, with exposure to global copper price trends and domestic infrastructure demand.
#### **Outlook**
- **Short-Term:** Strong momentum and volume could drive further upside if it breaks above ₹240, but overbought conditions may trigger profit booking near resistance.
- **Medium-Term:** Needs to sustain above the 200-DMA (~₹260) for a confirmed trend reversal.
- **Risks:** High valuation and recent volatility; global commodity price swings can impact earnings.
---
**Summary:**
Hindustan Copper is showing robust short-term momentum with strong volume and price gains, but faces resistance near ₹240–₹249. The stock remains fundamentally expensive, and investors should watch for sustained moves above the 200-DMA for a longer-term bullish signal .
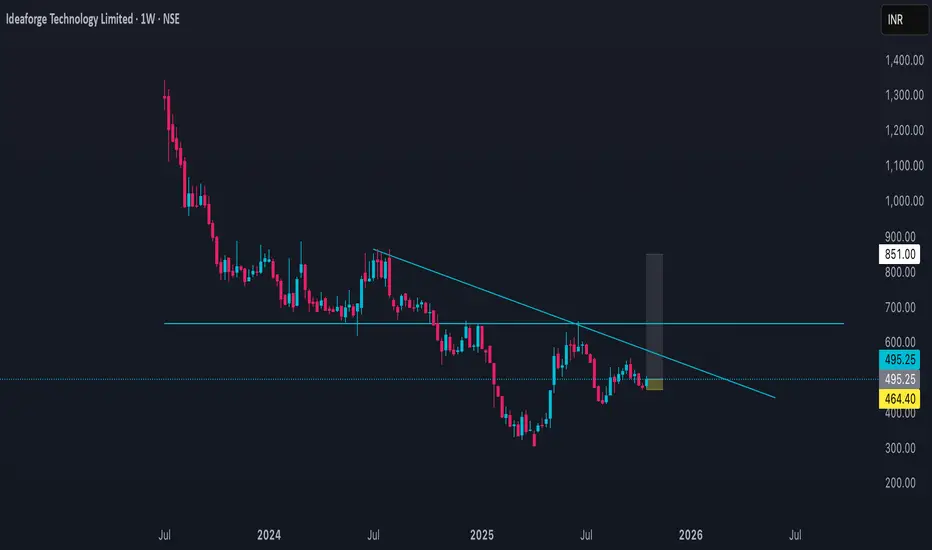
IDEAFORGE Price ActionAs of **October 24, 2025**, **ideaForge Technology Ltd (NSE: IDEAFORGE)** closed at **₹495.25**, gaining around **4.9%** on the day after trading between **₹473.40 and ₹503.00**. The session saw strong activity with over **13.2 lakh shares** traded, suggesting renewed investor interest before the upcoming quarterly results release later in the month.
The company has a **market capitalization** near **₹2,115 crore**. Its current **P/E ratio** is negative (around **–34**) due to losses in recent quarters, while the **P/B ratio** stands near **3.7**, reflecting modest valuation for a small-cap aerospace technology firm. The **book value per share** is around **₹131.5**, with a **52-week range** between **₹301 and ₹660.6**, indicating recovery from its April 2025 low.
From a technical perspective, IDEAFORGE shows early signs of rebound following a multi-month decline. The current price has moved above the **20-day moving average (₹485)** but still lags behind the **200-day average (₹525)**—pointing to medium-term consolidation. The **RSI near 56** shows balanced momentum, with potential upside if the price holds above ₹490. Key **support** levels lie at ₹475 and ₹460, while **resistance** stands near ₹505–₹515. A breakout above ₹515 could open short-term targets toward ₹540–₹550.
Overall, **ideaForge** maintains a **neutral to cautiously bullish** short-term outlook. Market expectations remain tied to its performance in defense drone orders and export growth, which will determine whether its recent recovery can sustain toward pre-2024 highs.
TATAINVEST Price ActionAs of **October 24, 2025**, **Tata Investment Corporation Ltd (NSE: TATAINVEST)** closed at **₹839.00**, marking a **1.45% gain** from the previous session’s ₹827.00. The stock traded between **₹821.00 and ₹849.00** during the session, with total trading volume around **4 million shares**. The company’s **market capitalization** stands close to **₹42,450 crore**, keeping it well within the mid-cap investment and financial services category.
The **52-week range** spans between **₹514.52 (low)** and **₹1,184.70 (high)**, indicating the stock is consolidating significantly below its yearly peak after a steep rally earlier in the year. The company currently trades at a **P/E ratio of around 130**, with an **EPS (TTM)** of **₹6.45**, suggesting an extended valuation driven by investor sentiment around Tata Group’s holding entities rather than direct earnings growth.
From a **technical viewpoint**, TATAINVEST shows stabilization above recent support zones. The **50-day moving average sits around ₹802**, and the **200-day average near ₹675**, confirming longer-term trend strength. The **RSI** remains near **58**, reflecting steady bullish momentum without entering extreme zones. Immediate **support** levels are around ₹820–₹825, while **resistance** lies near ₹850–₹860. A breakout above ₹860 could lead to the next target zone of ₹885–₹900.
In the broader context, the stock maintains a **positive medium-term outlook**, supported by strong group synergies, consistent dividend policy, and value unlocking potential within the Tata ecosystem. However, valuations remain on the higher side, and investors may expect moderate consolidation before renewed upside above ₹850.

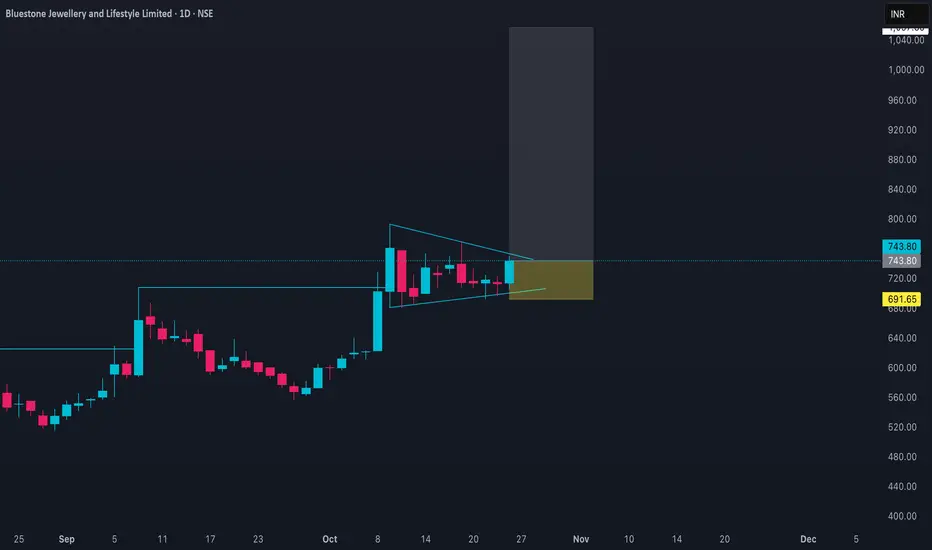
BLUESTONE Price ActionAs of **October 25, 2025**, **Bluestone Jewellery & Lifestyle Ltd (NSE: BLUESTONE)** closed at around **₹743.80**, reflecting a strong **4.4% daily gain** from the previous close of ₹712.60. The day’s range was **₹705.35–₹750.00**, with heavy trading volume around **16 lakh shares**, indicating strong investor participation.
The company’s **market capitalization** is approximately **₹11,255 crore**, placing it in the upper mid-cap segment of the gems and jewellery industry. Bluestone is currently **trading near the upper half of its 52-week range**, between ₹508.10 (low) and ₹793.00 (high). Despite operational progress, the firm’s **EPS (TTM)** stands at **–₹9.57**, leading to a **negative P/E ratio of –77.7**, while its **P/B ratio** is a steep **28.8**, suggesting rich valuations given the company’s retail expansion phase.
Technically, the trend remains **firmly bullish**, supported by continued higher highs and the stock’s position above both the **20-day (₹720)** and **50-day (₹690)** moving averages. Momentum indicators such as RSI, near **64**, point to sustained strength but with potential for short-term consolidation near ₹740–₹750. **Immediate support** is seen around ₹725, and **resistance** around ₹760–₹770. A decisive breakout above ₹770 could propel the next target zone towards ₹790–₹800, which coincides with its 52-week high.
Fundamentally, Bluestone’s short-term profitability remains under pressure due to scaling costs, but revenue momentum from its omni-channel expansion and brand recall continues to improve. The medium-term outlook stays **constructive**, with investors focusing on upcoming quarterly results for clarity on the path to profitability and sustained retail margin improvement.
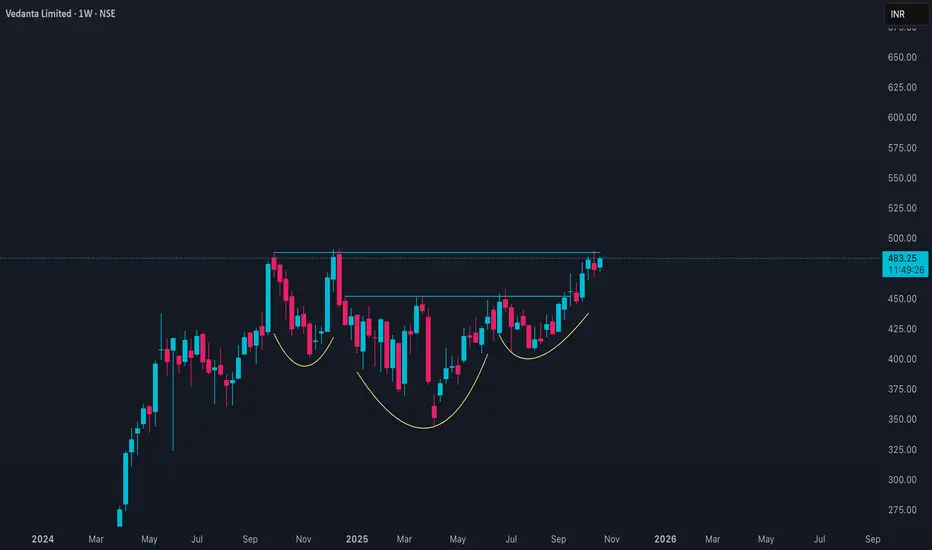
VEDL Price ActionAs of October 23, 2025, **Vedanta Limited (VEDL)** closed at around **₹483.25**, up approximately **1.6%** from the previous close near ₹475.65. The stock traded within a range of ₹474.65 to ₹484.85 during the day, reflecting sustained buying interest and moderate volatility.
Vedanta's market capitalization is about **₹1.89 trillion**, making it one of the largest diversified natural resources companies in India. Its earnings per share (EPS) stand at roughly **₹37.11**, with a price-to-earnings (P/E) ratio of around **13.0**, indicating an attractive valuation relative to some peers in the metals and mining sector.
Technically, Vedanta is in a mild uptrend, trading above both the 50-day (₹452.40) and 200-day (₹441.10) moving averages, which represent strong support levels. The Relative Strength Index (RSI) is near 60, indicating strength without being overbought.
Key support is positioned around ₹475, while resistance may be encountered near ₹490–₹495 levels. Overall, the medium-term outlook is positive, supported by stable commodity prices, cost control measures, and steady operational performance. Traders may look for a breakout above ₹490 to confirm further upside potential, while any dip closer to ₹470–₹475 may be viewed as a buying opportunity.
HCC Price ActionAs of October 23, 2025, **Hindustan Construction Company Limited (HCC)** closed at around **₹28.46**, up about **1.6%** from the previous session’s close near ₹28.01. The stock traded between a low of ₹28.12 and a high of ₹28.91 during the day. The company holds a market capitalization close to **₹5,180 crore** and is ranked 12th in its sector for market cap.
The stock's **P/E ratio** is roughly **30**, with an EPS of ₹0.95 and a book value of ₹4.98. The 50-day moving average is near ₹27.54, while the 200-day moving average is around ₹28.10, showing the price hovers close to long-term averages.
Fundamentally, HCC has reduced debt but continues to face challenges with low sales growth and a low interest coverage ratio. The promoter holding has reduced to approximately 16.7%, with a significant portion pledged. Despite some profits, the company is not currently paying dividends.
Technically, the stock remains in a consolidation phase after the recent uptrend. Support lies close to ₹27, with resistance near ₹29. A sustained move above ₹29 could lead to renewed momentum, while a drop below ₹27 might lead to further weakness.
Overall, the outlook is cautiously neutral to mildly positive, with debt reduction and consolidation underway but growth and profitability concerns persisting.

ONGC Price ActionAs of October 23, 2025, **ONGC (Oil and Natural Gas Corporation Limited)** closed at approximately **₹252.31**, up about **1.69%** from the previous close of ₹248.12. The stock traded within a day range of ₹249.08 to ₹253.24, indicating positive intraday momentum.
The company has a strong market capitalization of around **₹3.17 lakh crore**. The stock’s **P/E ratio** stands at about **8.8**, reflecting a relatively attractive valuation compared to other large-cap energy peers. Earnings per share (EPS) is approximately ₹28.66.
Technically, ONGC remains in an uptrend, trading above its 50-day moving average (~₹239) and 200-day moving average (~₹241), which serve as significant support levels. Momentum indicators such as RSI suggest the stock has room to move higher without being overbought.
Immediate resistance is around ₹255–₹258, while support is near the 50-day moving average. The medium-term outlook is bullish, supported by stable cash flows, rising crude oil prices, and improved operational efficiency. This makes ONGC a generally attractive stock for investors seeking exposure to the energy sector with a blend of growth and value.
BELRISE Price ActionAs of **October 23, 2025**, **Belrise Industries Ltd (NSE: BELRISE)** closed at **₹154.28**, gaining about **2.1%** from the previous session’s ₹151.08. The intraday range was **₹150.77–₹155.90**, reflecting active trading with high turnover volume exceeding **6.8 million shares**. The company’s **market capitalization** stands around **₹13,730 crore**, placing it in the mid-cap auto components segment.
Belrise’s **52-week range** is between **₹89.15 and ₹164.50**, showing a robust uptrend since June 2025. The stock currently trades above both its **50-day moving average (₹148.8)** and **200-day moving average (₹130.5)**, confirming continued medium-term strength. The current **P/E ratio** is approximately **34.75**, with an **EPS of ₹4.44** and a moderate **dividend yield** of about **0.27%**.
Technically, the structure remains bullish yet nearing a consolidation zone. The **RSI sits around 62**, suggesting healthy momentum but closing in on the overbought range. **Immediate support** levels are near ₹150 and ₹146, while **resistance** lies at ₹156–₹158. A breakout above ₹158 could open targets toward ₹164–₹168, while failure to hold ₹150 might trigger mild profit booking.
Fundamentally, the company maintains steady growth in profitability and has improved its debt profile post-IPO, driving stronger liquidity. With steady earnings, a leaner balance sheet, and diverse auto-component product demand, **Belrise Industries** holds a stable-to-bullish outlook for the remainder of 2025, particularly if sustained above the ₹148–₹150 support zone.
IIFLCAPS Re-entry set upAs of October 23, 2025, **IIFL Capital Services Ltd (NSE: IIFLCAPS)** closed at around **₹358.80**, reflecting a **gain of about 2.4%** over the previous session. The stock traded between a **low of ₹347.30** and a **high of ₹367.35**, showing healthy intraday volatility and above-average trading volume of around **9.4 lakh shares**.
Over the past six months, the stock has appreciated nearly **50%**, moving steadily upward from its April low of ₹180. Its **52-week range** spans **₹180 to ₹416.70**, indicating strong recovery momentum in 2025. The **market capitalization** stands near **₹10,850 crore**, and its **P/E ratio** is around **15.2**, suggesting reasonable valuation relative to its financial peers in the stockbroking and investment services segment.
From a technical viewpoint, IIFLCAPS is consolidating after a solid uptrend observed since mid-September. The stock price remains above key short-term averages such as the **20-day (₹340)** and **50-day (₹322)** moving averages, maintaining bullish alignment. The **RSI near 60** indicates steady momentum but leaves some room before entering overbought territory. **Immediate support** lies at ₹350 and deeper support around ₹338, while **resistance** is seen near ₹365–₹372. A close above ₹372 could open the next leg upward toward ₹390–₹400 levels.
Overall, IIFLCAPS maintains a **positive short-term outlook** backed by consistent buying interest and supportive fundamentals. Short corrections are likely to be absorbed as long as prices stay above ₹340, with medium-term sentiment favoring further upside.
IFBIND Price ActionAs of October 23, 2025, **IFB Industries Ltd (NSE: IFBIND)** was trading around **₹1,893**, showing a modest weekly gain of about 4% and up nearly 40% over the past three months. The stock has recently fluctuated between the **52-week high of ₹2,319.85** and **low of ₹1,060**, indicating strong recovery momentum after several quarters of underperformance.
The company’s **market capitalization** stands near **₹7,480 crore**, placing it in the small- to mid-cap category. The current **P/E ratio** ranges between **60 and 66**, while the **P/B ratio** is close to **8.9**, reflecting that the stock trades at a premium to its book value but roughly in line with other consumer durables peers like TTK Prestige and Voltas. Its **EPS (TTM)** is about **₹26.6**, with **no dividend** declared at present.
Technically, IFBIND maintains a bullish medium-term structure. It has broken out above its 200-day moving average, and the **RSI remains strong around 62–65**, suggesting continued upward momentum without being overbought. Key **support levels** are near **₹1,820–₹1,850**, and **resistance** lies around **₹1,940–₹1,960**. A breakout above ₹1,960 may propel the stock toward ₹2,050–₹2,100, while sustained trade below ₹1,820 could signal a brief pause or retracement.
Overall, the outlook for IFB Industries appears constructive, supported by solid sales growth in its home appliances and motor divisions, improving profitability, and strong cash flow metrics. Short-term consolidation aside, the medium-term bias stays positive as valuations normalize and operational growth remains consistent.

HONASA Price ActionAs of October 23, 2025, **Honasa Consumer Ltd (NSE: HONASA)**, the parent company of “Mamaearth,” closed at around **₹275**, down about **1.7%** from the previous session. The stock traded between **₹272 and ₹278** during the day, showing range-bound price action amid mild selling pressure.
The stock is currently valued at a **market capitalization of approximately ₹8,930 crore**, and it trades at a **P/E ratio of around 123** and a **P/B ratio of 7.7**, reflecting a premium valuation compared to many peers in the personal care segment. Over the past six months, the stock has gained nearly **17%**, while it remains about **36% below** its 52-week high of ₹426.85, indicating a stabilizing price after earlier volatility.
From a technical perspective, Honasa’s momentum remains neutral. Its **RSI is around 49**, signaling balanced market sentiment, while **CCI and MFI indicators** point toward slight downside bias. The price hovers near its **20-day and 50-day moving averages**, suggesting an ongoing consolidation. Immediate **support lies near ₹270–₹272**, with **resistance around ₹285–₹290**. A sustained close above ₹290 could initiate a short-term uptrend, whereas a drop below ₹270 might lead to weakness toward ₹260.
Despite short-term consolidation, the medium-term trend appears stable as the company continues to see revenue growth and brand diversification across its skincare, baby care, and haircare segments. Investors are watching closely for results-driven triggers or marketing expansion news that could decide its next directional move.

TFCILTD Price Action## TFCILTD – Price Analysis (August 2025)
### Price & Market Metrics
- **Current share price:** ₹297.75 (as of August 13, 2025; latest close).
- **Market capitalization:** Approx. ₹2,757crore.
- **52-week range:** ₹122.32 (low) – ₹303.50 (high); new high reached in early August.
- **All-time low:** ₹4.45 (Sep 2001).
- **All-time high:** ₹303.50 (July–August 2025).
- **Day’s range (Aug 13):** ₹282.60–₹303.50.
- **Volume:** 3,955,421 shares traded on Aug 13.
- **Beta:** 1.24, showing moderate volatility.
### Returns & Volatility
- 1-week gain: Around 8.25%.
- 1-month gain: Approximately 4%.
- 1-year return: Roughly 67%.
- Daily moves of 5-6%; volatility is moderate to high recently.
### Valuation
- **Price/Earnings (P/E) ratio:** 31.10–31.47 (much higher than sector average of ~11.4).
- **Price/Book (P/B) ratio:** 2.69–3.14.
- **Book Value Per Share:** ₹94.80–₹110.54.
- **Dividend yield:** About 1.01%; ex-dividend date August 14, 2025.
- **EPS (TTM):** ₹9.46–11.77.
- **Intrinsic value estimate (GF Value):** ₹152.95—current price trades at a 95% premium over this fair value estimate.
### Financial & Business Highlights
- Revenue (TTM): ₹1.58billion.
- Net profit (TTM): ₹1.09billion.
- Net profit margin: Approximately 69%.
- Debt/Equity Ratio: ~70.9% (moderate leverage).
- Gross margin: 99% (financial lending business).
### Technical & Sentiment Overview
- Stock made a new all-time high in early August.
- Trend is bullish, supported by heavy volumes.
- Dividend payout scheduled for September 20, 2025.
- Overall business cited as "average growth, high valuation" in recent analysis.
***
## Summary
TFCILTD is trading near record highs at ₹297.75, well above its estimated fair value and sector norms. The stock’s valuation metrics—particularly its P/E and P/B ratios—are elevated, reflecting strong price momentum and investor enthusiasm. Financial performance shows very high profit margins and reasonable growth, but the premium to intrinsic value signals potential overvaluation risks. Volatility and recent price swings are moderately high. Investors should weigh current optimism and momentum against valuation concerns and sector returns.

Bank of Maharashtra cmp 60.03 by Daily Chart viewBank of Maharashtra cmp 60.03 by Daily Chart view
- Support Zone 53.50 to 56.50 Price Band
- Resistance Zone 61.50 to 64.50 Price Band
- Bullish Head & Shoulders plus Rounding Bottoms around Support Zone
- Breakout from Falling Resistance Trendline and Rising Support Trendline maintained
- Volume are in close sync with avg traded quantity and spiking heavily over past few days
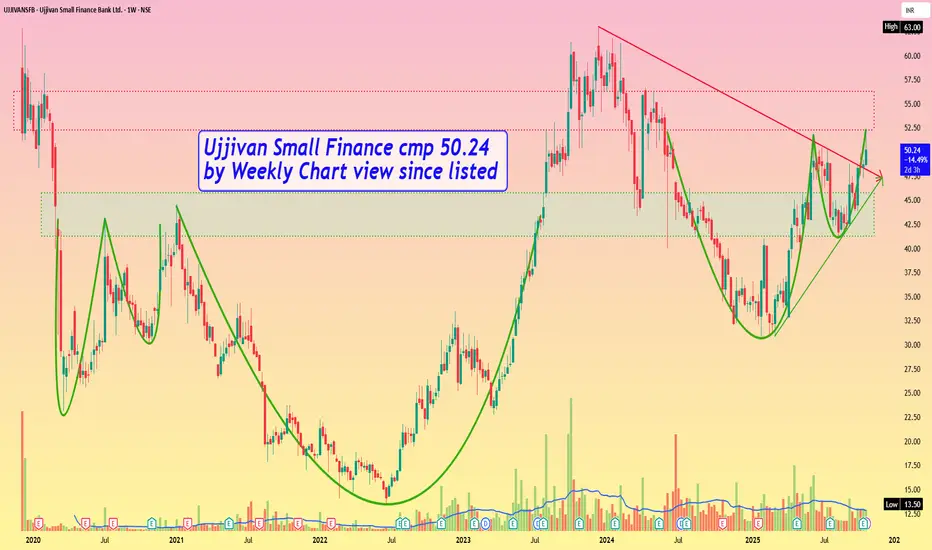
Ujjivan Small Finance cmp 50.24 by Weekly Chart view since listeUjjivan Small Finance cmp 50.24 by Weekly Chart view since listed
- Support Zone 41.25 to 45.75 Price Band
- Resistance Zone 52.25 to 56.25 Price Band
- Bullish Cup & Handle formed by Resistance Zone neckline
- Volumes spiking intermittently by a close sync with avg traded qty