MSTCLTD Price ActionMSTC Limited (MSTCLTD) is currently trading in the ₹511–₹544 range, having closed around ₹543 on October 16, 2025. The stock recently rebounded over 5% within two sessions after experiencing a multi-day decline. Typical intraday volatility fluctuates between 2% and 3%.
Short-term technical indicators are mixed, with daily moving averages showing mild bearishness, while weekly momentum indicators are turning slightly bullish. On a monthly basis, trend signals remain bearish and Bollinger Bands suggest mild negative pressure over broader timeframes. Key support is noted near ₹540, immediate resistance is around ₹548, and there is major volume support at approximately ₹540.5. If the price breaks below ₹518, it may invite further declines; conversely, moving above ₹548–₹551 could enable a rally toward ₹560 or higher.
Fundamentally, MSTC is a small-cap company with a market capitalization just under ₹3,850 crore. Latest financials show flat sales and subdued long-term growth, though multi-year returns have outperformed benchmark indices over three and five years. Current share price trades at a substantial premium to its estimated intrinsic value, resulting in a stretched valuation compared to historical averages. The company maintains consistent dividend payouts, with the latest declared at ₹4.5 per share in April 2025.
Overall, MSTCLTD is showing short-term optimism due to a price rebound, but technical setups and high valuations suggest caution. Sustained upward movement will depend on fundamental improvement and supportive broader market conditions.
Bullishsetup

BTC SWING PLAY LONGChart Overview and Data
• Asset: BITCOIN/TETHERUS PERPETUAL CONTRACT.
• Time Frame: The chart shows data up to "16 Oct" (likely the date the screenshot was taken). The primary candles visible span from approximately June to October of the current year, with the x-axis extending into 2026, suggesting a daily (1D) or weekly (WEEK) candlestick view, though the top-left corner indicates "1D - WEEK", which might mean the current view is Daily (1D) within a larger Weekly (WEEK) analysis context.
• Price: The current price is approximately $107,705.3, and the asset is down $3,007.6 (-2.72%) for the period shown.
• Trading Action: There are prominent SELL and BUY buttons at the top left, with current bid/ask prices of $107,691.3 (SELL) and $107,691.4 (BUY).
Technical Analysis Elements
Candlestick Pattern
• The chart uses candlesticks to represent price action over time.
• The recent price action (around August to October) shows a period of consolidation or a slight uptrend that has recently seen a significant drop, as indicated by the large red candlestick currently forming (the one far to the right).
Indicators and Lines
• Moving Averages: Several moving average lines (blue and purple, and possibly a thinner red line) are overlaid on the candlesticks, typically used to identify trend direction.
• Support and Resistance:
• Support Zones (Red Boxes/Lines): Several horizontal red lines and a large red-shaded area beneath the current price action indicate potential support levels where traders expect buying interest to emerge. Key price points marked by red lines are around $106,973, $103,204, $101,297, and the "Low" at $98,125.2. Further support is indicated by the lowest red line at $89,076.1.
• Resistance/Target Zone (Yellow/Green Box): A prominent yellow horizontal line at $126,220.2 (labeled "High") acts as a significant resistance level or a potential upside target. The large green-shaded area above the current price, extending up to $161,047.0, appears to represent a profit target or a long-term trading objective for a potential long position.
Trade Setup Indication
• The chart appears to be illustrating a potential short trade setup, or a breakdown scenario, given:
• The large red-shaded area below the current price, which could be a projected target zone for a short position.
• The significant price drop in the last candle, breaking below recent support.
• Small arrows and boxes near the consolidation area (around July/August) also suggest previous or ongoing trade indications.
Axis and Additional Information
• Y-Axis: Represents the price of BTCUSDT, ranging from approximately $84,800 up to $161,047.
• X-Axis: Represents time, spanning from approximately July to April 2026.
• Volume: A smaller chart pane at the bottom shows volume data, represented by red and green vertical bars, which helps gauge the strength behind price movements.

#CARRARO - Large Base BreakOut Script: CARRARO
Key highlights: 💡⚡
📈 VCP BreakOut in Daily Time Frame
📈 Volume spike during Breakout
📈 Large Base BreakOut
📈 MACD Bounce
📈 Can go for a swing trade
BUY ONLY ABOVE 514 DCB
⏱️ C.M.P 📑💰- 507
🟢 Target 🎯🏆 – 24%
⚠️ Stoploss ☠️🚫 – 12%
⚠️ Important: Market conditions are Okish, Position size 50% per Trade. Protect Capital Always
⚠️ Important: Always Exit the trade before any Event.
⚠️ Important: Always maintain your Risk:Reward Ratio as 1:2, with this RR, you only need a 33% win rate to Breakeven.
✅Like and follow to never miss a new idea!✅
Disclaimer: I am not SEBI Registered Advisor. My posts are purely for training and educational purposes.
Eat🍜 Sleep😴 TradingView📈 Repeat 🔁

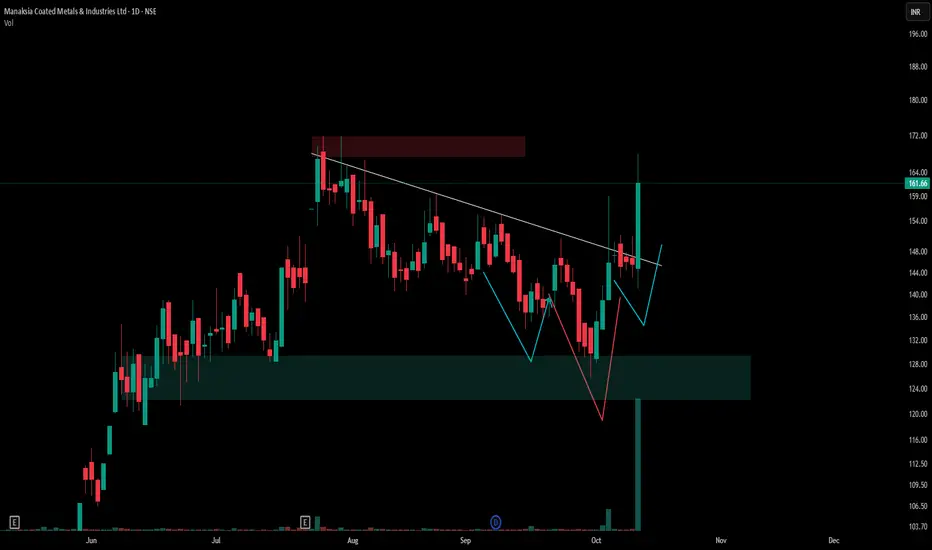
Observing Key Structural Patterns in Manaksia Coated MetalsThe daily chart of Manaksia Coated Metals & Industries Ltd (NSE) displays a confluence of notable technical formations. There is a clearly defined demand zone (highlighted in green) that has provided support for multiple sessions, as well as a supply area (marked at the upper region), signifying previous resistance.
A visually tight Volatility Contraction Pattern (VCP) is present, where price swings narrow progressively, indicating potential accumulation and increasing trader interest. The chart also reveals an inverted head and shoulders pattern, depicted using blue and red lines, which is often recognized as a classic reversal formation in technical analysis.
No attempt is made to forecast price movement; the Chart purely reflects observed market structure and patterns.
Disclaimer
This post is for educational and observational purposes only. It does not constitute financial advice or a trading recommendation. Always conduct your own research and consult a certified financial advisor before making investment decisions.
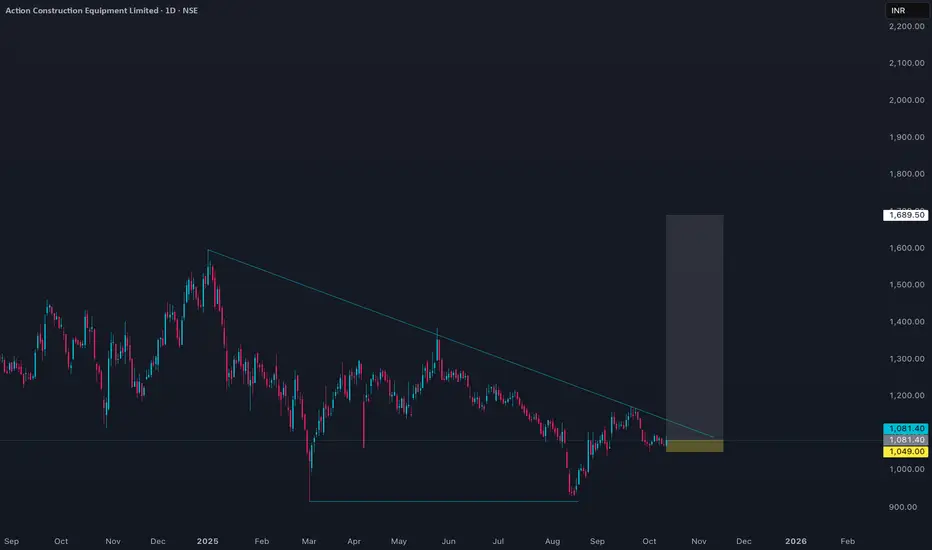
ACE Price Action with probable 18R trade set up- Current Price: Around ₹1,081 as of October 2025.
- Market Capitalization: Approximately ₹12,870 Crores.
- 52-week Range: The stock traded between ₹917 and ₹1,600 in the past year.
- PE Ratio: Roughly 31, indicating moderate to high valuation relative to earnings.
- EPS: Around ₹34.4 (TTM).
- Price-to-Book Ratio: About 8, suggesting a premium valuation relative to its book value.
- Dividend Yield: Low, approximately 0.19%.
- Revenue and Profit: Latest annual revenue near ₹3,245 Crores and net profit around ₹423 Crores.
- Price Trend: The stock has faced some downside pressure recently with a 19% decline over the last year but historical performance showing strong growth over 3-5 years.
- Volatility: The stock is moderately volatile, about 3.2 times more than the Nifty index.
- Sector: ACE operates in the heavy machinery and industrial equipment sector, showing good profitability and efficiency metrics with consistent earnings growth.
Overall, ACE trades at a premium valuation reflecting growth expectations but recent price corrections indicate some caution in the market. The company shows good fundamentals with strong earnings growth potential balanced against sector cyclicality and market volatility.
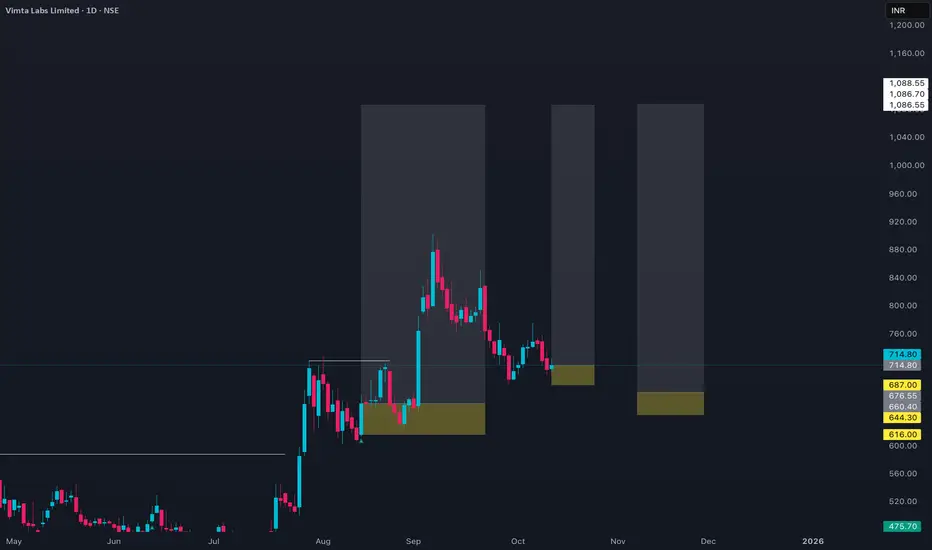
VIMTALABS: Probable pyramid entries
- Current Price: Around ₹715 as of early October 2025, with daily price fluctuations between approximately ₹700 and ₹723.
- 52-week Range: The stock has traded from a low near ₹270 to a high around ₹903, showing strong growth over the past year.
- Market Capitalization: About ₹3,180 Crores.
- Valuation: PE ratio stands near 45, indicating a moderately high valuation relative to earnings.
- Earnings: EPS is about ₹15.9.
- Moving Averages: The 50-day average price is roughly ₹719, and the 200-day average is near ₹545, indicating medium-term momentum in an uptrend.
- Dividend Yield: Very low at around 0.14%, consistent with growth-oriented companies.
- Volume: Recent trading volumes average about 60 lakh shares daily, indicating good liquidity.
- Price Trend: The stock has experienced some volatility but sustained gains overall, with occasional pullbacks and rebounds, reflecting investor confidence in the company’s niche testing and laboratory services sector.
- The stock price structure indicates a bullish phase supported by improving fundamentals and positive market sentiment.
Overall, Vimta Labs shows strong upward price momentum with a solid growth profile, trading at a premium that reflects optimism about its expanding testing services business.
HERITGFOOD Re-entry set upHeritage Foods Limited (HERITGFOOD)
- Current Price: Approximately ₹496 as of mid-October 2025, with a day range between ₹485.7 and ₹497.7.
- 52-week Range: The stock has traded between ₹355.55 (low) and ₹658 (high) in the past year.
- Market Capitalization: About ₹4,607 Crores.
- Valuation: PE ratio stands around 27, indicating moderate valuation given its dairy sector positioning.
- Earnings: EPS of about ₹18.34.
- Moving Averages: The 50-day average price is approximately ₹483, and the 200-day average is near ₹443, showing a recent upward trend with solid support.
- Dividend Yield: Roughly 0.5%, reflecting modest income for shareholders.
- Volume: Daily traded volumes average around 16,000 shares.
- Performance Trends: Over recent years, the company has grown sales significantly, with a healthy profit recovery and improving operating margins. The stock price has demonstrated a mid-term rising trend with potential upsides based on recent positive momentum.
- Market Sentiment: Moderate volatility with periodic volume increases correlating with price advances.
Overall, Heritage Foods exhibits stable financials with steady profitability and moderate valuation in the food processing sector, trading near its short-term highs with a cautiously optimistic outlook for further gains.

MAHSCOOTER Price ActionAs of August 29, 2025, Maharashtra Scooters Limited is trading around ₹15,722, having posted a gain of nearly 5.5% over the past month and 18.5% in three months. The stock has maintained a strong uptrend for over a year, nearly doubling from its 52-week low of ₹8,822 to a high of ₹16,315 during this period. Notably, its market capitalization is about ₹17,968 crore, ranking it highly in the holding company segment.
Technically, the price momentum is positive, trading close to resistance levels near ₹16,000. The short-term moving averages show mild volatility, but long-term signals remain bullish. Despite a very high price-to-earnings ratio above 73, investor interest is supported by consistent profitability, strong control over operating costs, and robust dividend payouts.
Financially, March quarter results reflect steady net sales growth with improved margins. The company continues to benefit from its stake in group entities and maintains a solid cash position with minimal debt. Although growth is modest, valuation remains expensive—a sign that further gains may be limited unless fundamentals accelerate or sector sentiment grows even more bullish. Risk levels are relatively low with support seen around ₹14,340, and the stock remains a hold for existing investors while aggressive new buying may need fresh earnings triggers.

ADANIPORTS Pice Action- The stock is trading around ₹1,438 as of mid-October 2025, with a day range from approximately ₹1,396 to ₹1,442.
- On a 52-week basis, the stock fluctuated between a low of about ₹995 and a high near ₹1,494, currently trading closer to its upper range.
- Market capitalization is around ₹3.1 lakh Crores, making it one of the largest port infrastructure companies in India.
- The PE ratio is about 27.5, reflecting a moderate valuation for a growing infrastructure sector leader.
- Book value per share is about ₹288, so the stock trades at approximately 5 times book value.
- Dividend yield is low, near 0.5%, consistent with reinvestment into growth.
- Recent quarterly results showed a 6.5% rise in net profit and a strong 31% increase in revenue year over year.
- The stock has demonstrated steady sales and profit growth over the past five years with roughly 23% CAGR in profits.
- Return on capital employed (ROCE) is approximately 13.8%, with return on equity (ROE) close to 18.8%, signaling efficient use of capital.
- The stock has shown volatility with daily price swings around 2%, reflecting sensitivity to macroeconomic factors and sector developments.
Overall, ADANIPORTS remains a strong performer in the infrastructure sector with solid fundamentals, consistent growth, and trading at a fair valuation reflecting its leadership in port and logistics services.

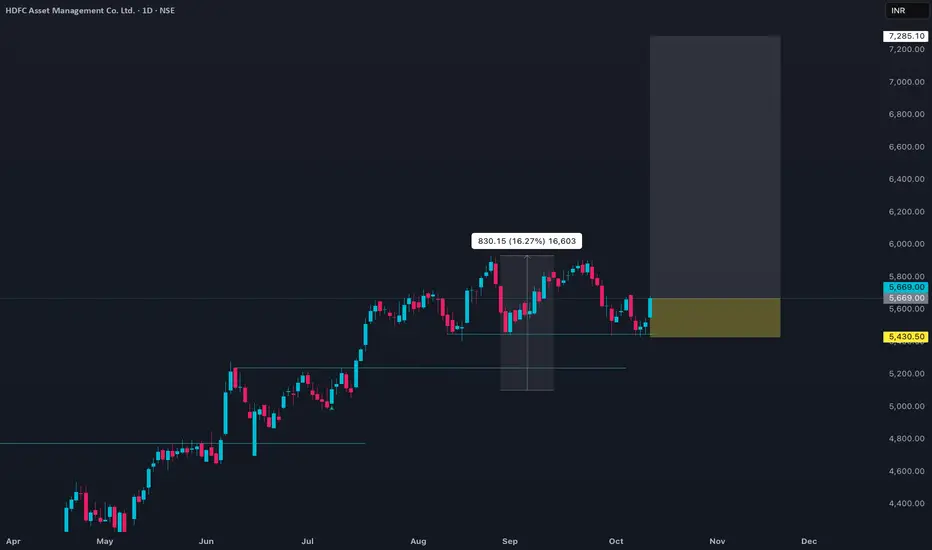
HDFCAMC Pyramid Price ActionHDFC Asset Management Company Ltd (HDFCAMC) is currently trading around ₹5,669. The stock has recently advanced nearly 2.7% in a single day, with session lows near ₹5,550 and highs close to ₹5,684. Its 52-week range sits between ₹3,525 and ₹5,926, putting the current price near the upper end of its yearly band.
The company’s market capitalization is approximately ₹1,21,300 Crores. Average daily volume is around 12,000 shares, indicating reasonable liquidity for a large-cap stock. The stock holds a trailing P/E ratio of about 47, based on an EPS of ₹121, which is above the broader market average but within the range for premium asset management firms. The dividend yield is around 1.6%. Both 50-day and 200-day averages are close to ₹5,662 and ₹4,717, respectively, illustrating solid medium-term momentum.
Price trends show steady upward bias in 2025, with periodic pullbacks being well-supported and followed by new highs, reflecting investor confidence in HDFC AMC’s market potential, earnings consistency, and recent management initiatives such as a bonus share issue.HDFC Asset Management Company Ltd (HDFCAMC) is currently trading near ₹5,669, showing a strong recent uptrend with prices moving between ₹5,550 and ₹5,684 during the latest session. The 52-week range stands at approximately ₹3,525 to ₹5,926, placing the stock close to its yearly highs.
The company’s market cap is about ₹1,21,000 Crores. Its P/E ratio is around 47 (EPS of ₹121), which reflects a premium over broader market averages but is typical for the asset management sector. Recent daily volumes show consistent interest, and the 50-day and 200-day averages are ₹5,662 and ₹4,717, respectively, confirming a steady upward trend. The dividend yield is close to 1.6%.
Overall price momentum in 2025 remains positive, supported by strong institutional confidence, a track record of earnings growth, and optimism around management initiatives like bonus share announcements.
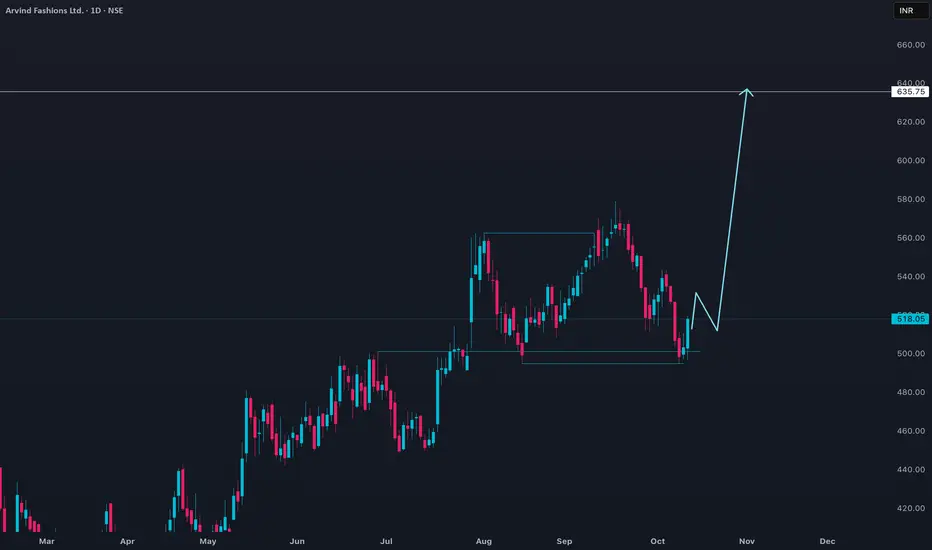
ARVINDFASN Price ActionArvind Fashions Ltd (ARVINDFASN) price analysis without references:
- Current Price: Around ₹518, with recent trading between ₹497 and ₹520 in mid-October 2025.
- Yearly Range: Approximately ₹320 low to ₹640 high.
- Market Capitalization: About ₹6,900 Crores.
- Price Movements: The stock has shown moderate volatility in recent weeks, oscillating mostly in the ₹500 to ₹540 range.
- Valuation: The P/E is negative due to recent losses, but on recovery trend; a dividend yield near 0.3%.
- Volume: Daily traded volumes average 2-4 lakh shares.
- Moving Averages: The 50-day moving average is near ₹531, and the 200-day moving average is about ₹470, indicating medium-term support.
- Business: Engaged in branded apparel retail with a portfolio of international brands; showing revenue roughly ₹4,700 Crores annually.
- Recent Price Direction: After a slow decline in September 2025, the stock has seen a small upward correction in early October backed by steady market interest.
Overall, Arvind Fashions is trading close to mid-range levels for the year, with potential for recovery but still reflecting some challenges in profitability pressure from the fashion retail sector. The stock price reflects cautious investor sentiment with room for further upside if turnaround efforts gain traction.
Fortis Healthcare’s share price analysisFortis Healthcare’s share price is currently around ₹667, reflecting strong momentum and significant outperformance over the past year, with a return of about 49%. The stock recently touched a 52-week high of ₹744.5 and a low of ₹406, indicating a broad trading range and robust investor interest
Analyst sentiment remains bullish, with most forecasts targeting a price range of ₹736 to ₹850 over the next 12 months, suggesting a potential upside of around 10–20% from current levels . Some projections are even more optimistic, with year-end 2025 targets as high as ₹933 if market conditions remain favorable . Technical indicators currently point to a bullish trend, supporting the positive outlook .
Fundamentally, Fortis Healthcare has reported strong financial results, including an 84% year-on-year jump in net profit for Q3 FY2024-25 and a 40% quarterly profit increase, underscoring operational momentum . The company trades at a price-to-earnings (PE) ratio of about 65, which is above the sector average, indicating that the stock is priced at a premium due to its growth prospects . The price-to-book (PB) ratio is 3.49, and the dividend yield is modest at 0.24% .
In summary, Fortis Healthcare is in a bullish phase, supported by strong earnings growth and positive analyst outlooks. While the stock is trading at a premium valuation, its growth trajectory and sector leadership continue to attract investor interest, with further upside likely if current trends persist

ADANIPOWER Price ActionAdani Power Ltd (ADANIPOWER) is currently trading near ₹154, having experienced a range between ₹148 and ₹156 in the last few sessions. The stock has been volatile, recovering quickly after a sharp correction at the end of September 2025, when it dropped from around ₹170 to ₹145 before stabilizing.
Trading volumes remain heavy, often exceeding 60 million shares on active days, reflecting strong investor interest and liquidity. The price quickly rebounded after the steep selloff in late September and early October, with daily swings of 2-5% being common. The recent momentum is slightly upward, though choppy, with brief profit-taking followed by renewed buying.
Overall, Adani Power shows short-term volatility within a broad uptrend established earlier in the year, featuring periods of sharp gains and corrections that align with sector and broader market sentiment shifts. The stock is actively traded and responsive to market news and institutional flows.

PGEL: Suggest Momentum ShiftPG Electroplast Ltd. (PGEL) has recently shown signs of emerging strength after a prolonged phase of consolidation. Over the last two trading sessions, the stock has demonstrated upward momentum, suggesting a possible attempt to break out of its range-bound structure. This observation is supported by several technical factors:
1. Moving Averages & Volume Dynamics
The stock has successfully closed above the 20-day EMA, indicating short-term bullish sentiment.
It is currently trading near the 50-day EMA, although it has not yet closed above this level. The recent price movement has been accompanied by increased trading volume, which may reflect growing market participation.
2. Change of Character (CHOCH)
The break above the 20-day EMA, despite the price not closing above the 50-day EMA, may signal a CHOCH. This is often interpreted by technical analysts as a potential shift in trend direction, particularly from bearish to neutral or bullish.
3. RSI Momentum
The RSI has moved above the 60 level, suggesting strengthening momentum. This level is typically viewed as a transition zone between neutral and bullish conditions.
4. MACD Signal
A bullish crossover on the MACD indicator has occurred on the daily timeframe. This crossover may indicate a potential shift in momentum, especially when supported by price structure and volume.
Breakout Confirmation Level:
A sustained close above ₹597 could be interpreted as a breakout from the consolidation zone. If this level is cleared with volume support, the next potential resistance may lie near ₹712 , based on historical price action. The lower boundary of the recent consolidation zone, around ₹494 , may act as a support level. This area could be monitored for potential retests or invalidation of the breakout attempt.
Disclaimer: This analysis is intended for educational and informational purposes only. It does not constitute investment advice or a recommendation to buy, sell, or hold any financial instrument. Market participants are encouraged to conduct their own research and consult with a licensed financial advisor before making any investment decisions.

FLAIR Price Action- Current Price: About ₹315 as of early October 2025.
- Price Range: 52-week low roughly ₹195 and high around ₹357.
- Market Cap: Approximately ₹3,300 Crores.
- P/E Ratio: Around 27-28, indicating moderate valuation relative to earnings.
- Recent Trend: The stock has been fluctuating in the ₹300-320 range in recent weeks with some volatility shown in daily price changes.
- Moving Averages: The 50-day and 200-day moving averages align near the ₹310-320 levels, indicating a sideways to slight downtrend intraday in early October.
- Financial Performance: Annual revenue close to ₹970 Crores, with profits around ₹114 Crores and promoter holding near 79%.
- The stock has shown some recovery from the lows earlier in 2025 but remains below its 52-week high.
- Trading volume shows moderate liquidity, with typical daily volumes in the tens of thousands range.
Overall, Flair Writing is moderately valued, with recent price consolidation and moderate volatility as it trades below its recent highs, supported by steady financials.

TARIL Price ActionHere is the price and fundamental analysis summary for Transformers & Rectifiers (India) Ltd (TARIL) without references:
- Current Price: Around ₹491.35 as of October 2025.
- Price Range: 52-week range is approximately ₹356 low to ₹649 high.
- Market Capitalization: About ₹14,748 Crores.
- P/E Ratio: Around 56-60, indicating relatively high valuation.
- EPS: About ₹8.06 to ₹8.71 (TTM).
- Dividend Yield: Very low, about 0.04%.
- Price averages: 50-day average ~ ₹507, 200-day average ~ ₹494.
- Revenue and Profit Growth: Strong profit growth of over 250% CAGR in last 5 years; sales and operating profit margins improving, with recent operating profit margin around 16-17%.
- Return Ratios: ROCE ~28%, ROE ~23%.
- Working Capital Efficiency: Debtor days reduced significantly, improving cash cycles.
- Stock trades at about 11.8 times book value (book value approximately ₹37).
- Quarterly trends show improving profitability and sales year-over-year.
- Peer comparison: Valuation and profitability metrics compare reasonably with peers in electrical equipment sector.
The stock price has been on an uptrend with strong fundamentals and growth metrics indicating positive medium-term potential but trades at a high valuation reflecting investor optimism and strong earnings growth.

KELLTONTEC Price ActionKellton Tech Solutions Ltd (KELLTONTEC) is currently trading around ₹23.9, showing a slight recovery with a 0.84% gain in the latest session. The stock has seen a decline of roughly 21% over the past year, with a 52-week low of ₹19 and a high of ₹35.5. Market capitalization is approximately ₹1,168 crore.
Technically, the stock trades below its 50-day and 200-day moving averages, signaling short-term weakness, but the recent bounce suggests some accumulation near support levels. Resistance is noted near ₹26–27, with support around ₹23. Volume levels remain decent, showing moderate participation, while indicators like RSI hover near neutral zones.
Fundamentally, Kellton Tech reported earnings per share (EPS) around ₹1.68, and the price-to-earnings (P/E) ratio stands near 14, reflecting a reasonable valuation compared to peers in IT-enabled services. The price-to-book ratio is about 2.18, and dividend yield remains negligible. Overall, earnings growth has been steady but subdued, with moderate margins and manageable debt.
In summary, while the stock shows signs of tentative recovery, a sustained breakout above ₹26 is needed to confirm upward momentum. Investors should watch support near ₹23 to manage downside risk. The longer-term outlook depends on consistent earnings improvement and broader sector momentum.

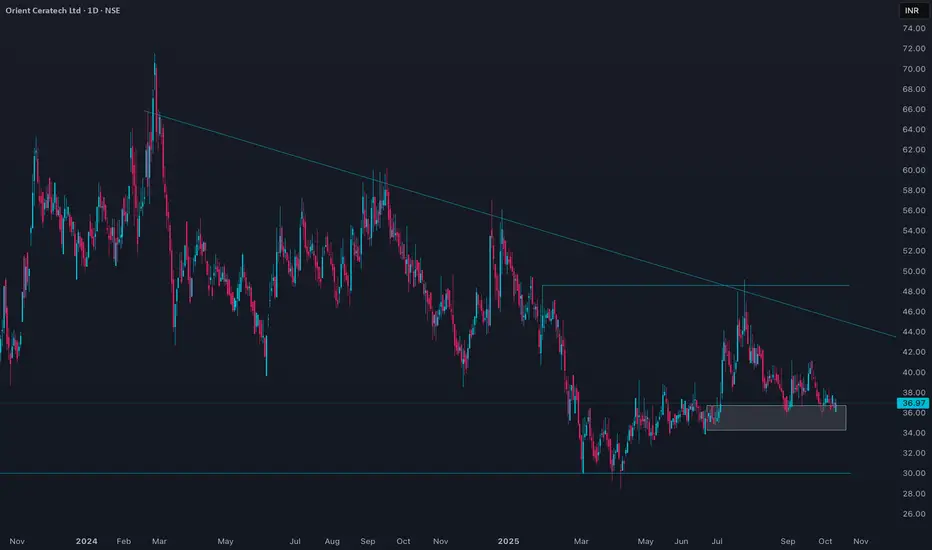
ORIENTCER Price ActionOrient Ceratech Ltd is currently trading at ₹37, showing a slight uptick in the latest session. The stock has an annual range between ₹28.93 (year low) and ₹57.4 (year high). Volumes in recent sessions have been below average, reflecting subdued market participation. The market capitalization stands close to ₹442 crore.
Technically, the stock is consolidating, with the price hovering just below both the 50-day and 200-day moving averages, indicating a weak trend in the medium term. Recent intraday movement ranged from ₹36.8 to ₹38.2, and resistance is visible around ₹38–₹41, while support lies near the ₹36 zone and more strongly at the yearly low.
On the fundamentals front, Orient Ceratech reported modest profit growth with a trailing twelve-month EPS of ₹0.95 and a P/E ratio near 39, which is above its historical average but below the sector average. The book value per share stands around ₹23 and the price-to-book is about 1.6. Dividend yield is modest at 0.68%, and the balance sheet shows moderate leverage. While revenue has grown slightly year-over-year, profitability remains a concern with recent margin pressures.
In summary, the stock remains in a consolidation phase with a mildly negative bias until a strong reversal or breakout above resistance emerges. Both technicals and fundamentals suggest a cautious stance for new entries, with high valuations and weak earnings trends requiring close monitoring.
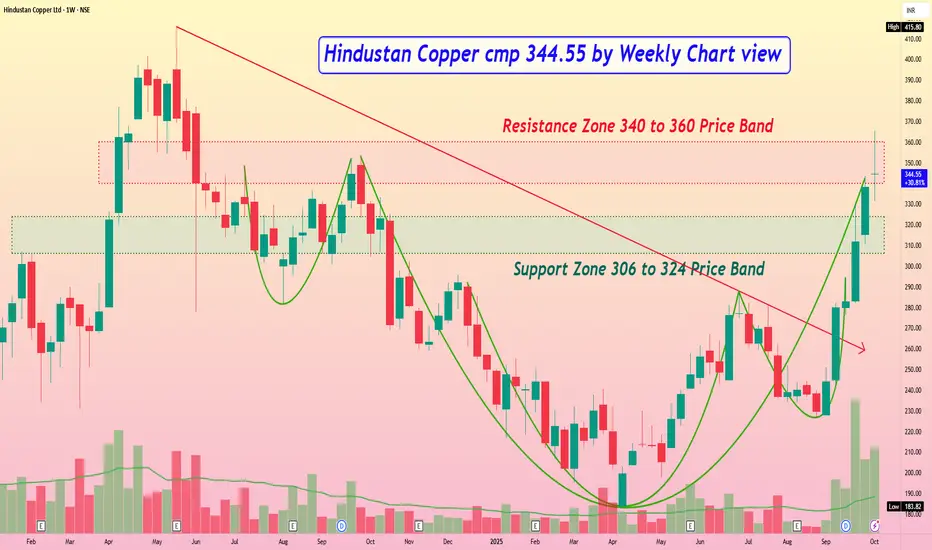
Hindustan Copper cmp 344.55 by Weekly Chart viewHindustan Copper cmp 344.55 by Weekly Chart view
- Support Zone 306 to 324 Price Band
- Resistance Zone 325 to 337 Price Band
- Falling Resistance Trendline Breakout is well sustained
- Bullish Rounding Bottom formed by Resistance Zone neckline
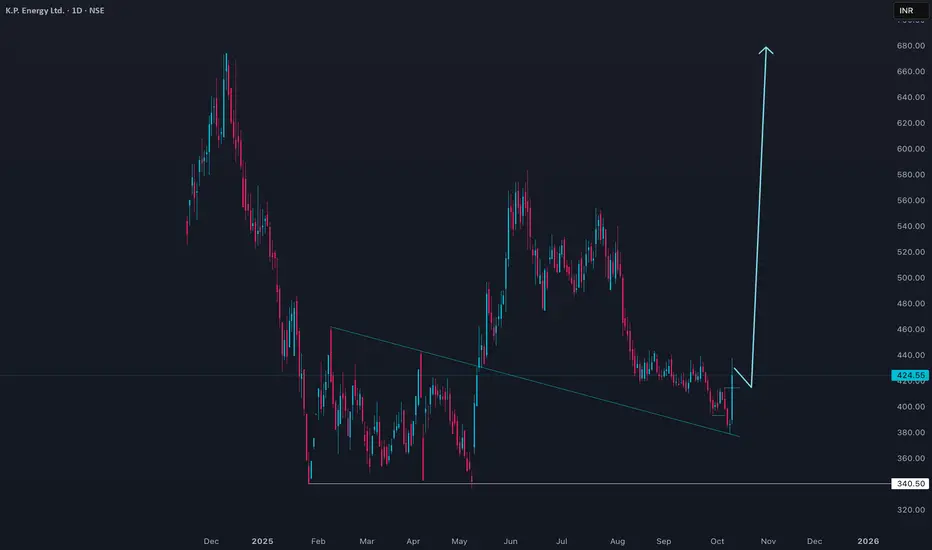
KPEL Price ActionK.P. Energy Ltd (KPEL) is currently trading around ₹424, rebounding sharply with a rise of almost 10% in the last session. The price remains well below the 52-week high of ₹675 but is comfortably above the year's low at ₹336. Recent sessions saw increased volatility, with an intraday range from ₹386 to ₹438 and strong trading volumes, pointing to heightened trader activity.
The stock is in the middle of a broad upward trend but has underperformed on a year-to-date basis, falling more than 21% compared to modest market gains. Short-term technicals are mixed: while the long-term average remains bullish, the stock faces immediate resistance near ₹528 and finds support just above ₹420. Momentum indicators such as MACD show lingering positive signals, but trading below the short-term average keeps the outlook cautious for aggressive entry.
KPEL’s financial fundamentals are robust, highlighted by strong growth in both net sales and profits. The company’s price-to-earnings (P/E) ratio is about 23, and the price-to-book (P/B) stands near 11.8—both somewhat elevated but aligning with industry standards for growth-oriented firms. Debt levels are well-controlled, and operational margins have improved, adding confidence to the long-term narrative. Despite high valuations, continued top-line and bottom-line delivery sustains market interest, with a positive outlook for future growth if sector conditions remain favorable.
For traders, key levels to monitor are resistance at ₹528 and support at ₹420. As long as the price remains above the lower band, upward momentum is supported, though breaking below could invite short-term selling pressure. Long-term investors may consider accumulating during any dips, relying on the company’s strong operating performance and sector prospects.
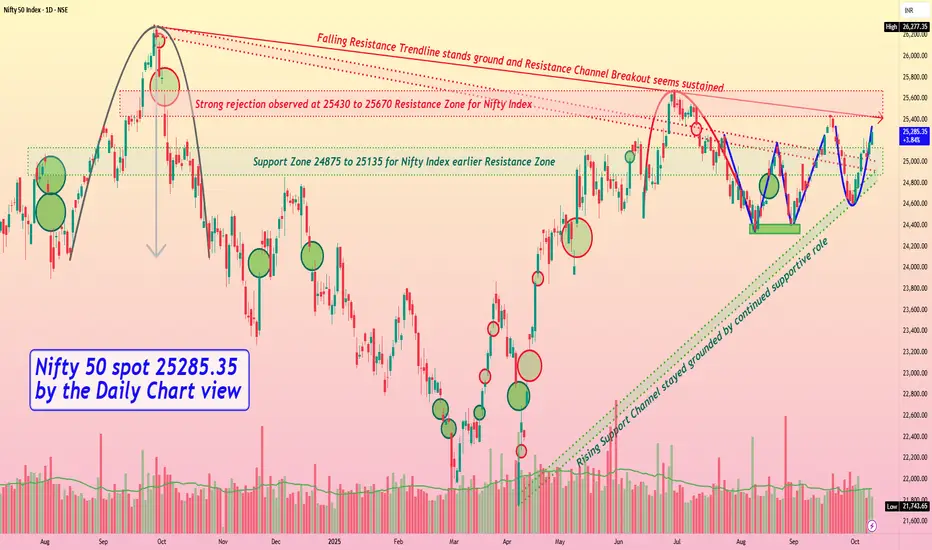
Nifty 50 spot 25285.35 by the Daily Chart view - Weekly updateNifty 50 spot 25285.35 by the Daily Chart view - Weekly update
- Support Zone 24875 to 25135 for Nifty Index earlier Resistance Zone
- Rising Support Channel stayed grounded by continued supportive role
- Strong rejection observed at 25430 to 25670 Resistance Zone for Nifty Index
- Falling Resistance Trendline stands ground and Resistance Channel Breakout seems sustained
- Bullish Technical patterns of "W" Double Bottom followed by Rounding Bottom formed around Support Zone
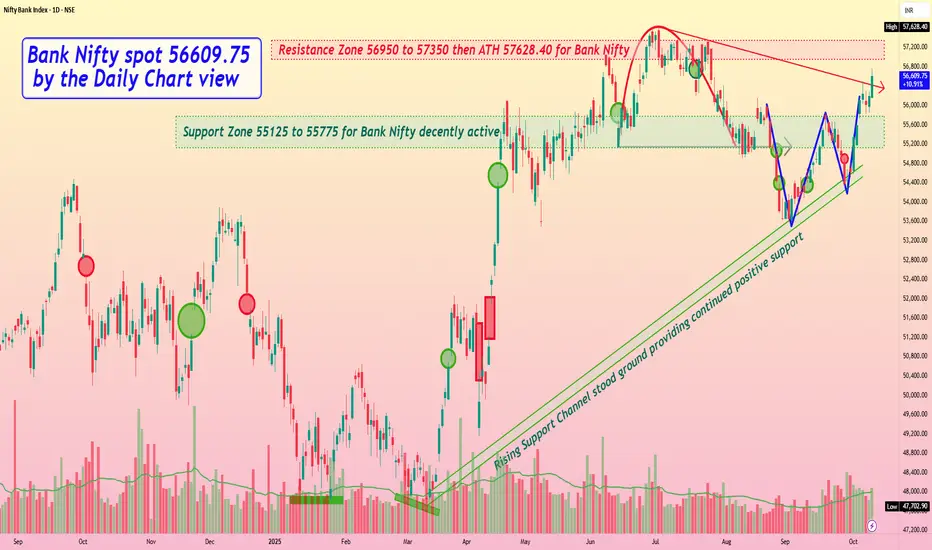
Bank Nifty spot 56609.75 by the Daily Chart view - Weekly updateBank Nifty spot 56609.75 by the Daily Chart view - Weekly update
- Support Zone 55125 to 55775 for Bank Nifty decently active
- Resistance Zone 56950 to 57350 then ATH 57628.40 for Bank Nifty
- Falling Resistance Trendline Breakout seems in the making for uptrend
- Rising Support Channel stood ground and provided steady positive support
- Bullish Rising W pattern done and well sustained by current trending momentum
- Support Zone tested and tested over the past full week, indicating probable positive trend
ETHFIUSDT - BULLS ARE NOT DONE YET?Symbol - ETHFIUSDT
ETHFIUSDT is undergoing a corrective phase after updating its local high at 1.938 The breakout above the 1.677 zone appears to be an attempt to initiate a distribution phase following an extended period of consolidation. The key question now is whether the bulls can sustain control above this area.
Bitcoin is also in correction mode following a false breakout of its resistance level. In this context, the broader cryptocurrency market is experiencing a temporary decline. Nevertheless, the prevailing trend remains bullish, supported by a favorable fundamental outlook. Once the current correction concludes, market growth may resume.
On the daily timeframe, ETHFIUSDT is attempting to transition into a distribution phase after approximately five to six months of consolidation. The overall trend remains upward, and following the breakout of resistance, a corrective movement toward the liquidity zone at 1.677 is developing. A false breakdown, accompanied by a shift in market imbalance and subsequent consolidation above 1.678, could stimulate renewed buyer interest - potentially leading to further price appreciation.
Resistance levels: 1.898, 1.938
Support levels: 1.677, 1.534
The chart highlights two critical support zones - 1.677 and 1.534, Sustained bullish activity above the 1.677 level may result in a rebound and continued upward movement, confirming the ongoing distribution phase. Conversely, failure to maintain this level could prompt a retest of the zone at 1.534, where a liquidity sweep may subsequently trigger a new wave of buying pressure.
