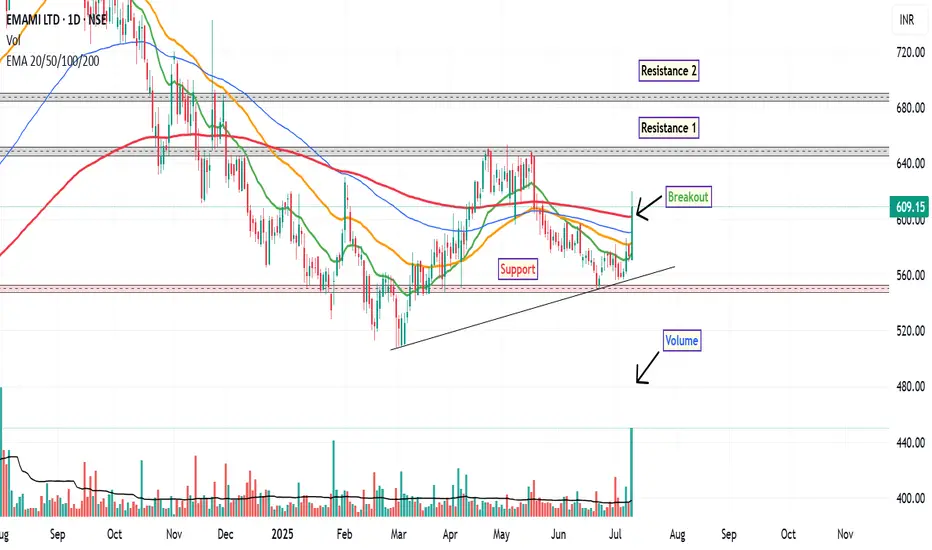
EMAMI: Technical Outlook UpdateFollowing a prolonged downtrend that began in September 2024, EMAMI Ltd. has recently exhibited signs of a potential short-term trend reversal on the daily chart. The stock has demonstrated a notable uptick in momentum, marked by several key technical developments.
The stock has decisively moved above its 200-day EMA, a level often regarded as a long-term trend indicator. This breakout was accompanied by a significant increase in trading volume—approximately 5 times the average volume of the 50-day moving average, suggesting heightened market participation. The RSI has crossed above the 60 level, indicating strengthening bullish momentum, though it is approaching the overbought zone.
A bullish crossover in the MACD was observed, further supporting the case for near-term strength.
Around ₹600, where the stock is currently consolidating post-breakout. First resistance near ₹650, Second resistance around ₹690. A technical stop-loss could be considered below ₹548, aligning with recent swing lows and support levels.
Disclaimer: This analysis is intended solely for educational and informational purposes. It does not constitute investment advice or a recommendation to buy or sell any financial instrument. Market participants are encouraged to conduct their own research or consult with a qualified financial advisor before making any trading decisions.
Bullishsetup
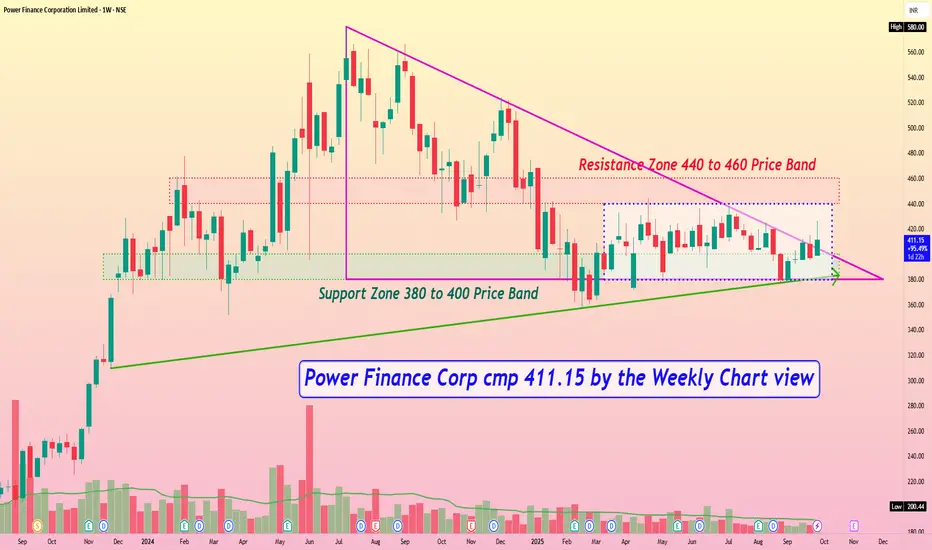
Power Finance Corp cmp 411.15 by the Weekly Chart viewPower Finance Corp cmp 411.15 by the Weekly Chart view
- Support Zone 380 to 400 Price Band
- Resistance Zone 440 to 460 Price Band
- Price traversing within Descending Triangle pattern after ATH
- Rising Support Trendline well respected by touch points since close to 2 years
- Price seen majorly trending inside Darvas Box since Mar 2025 in a range of 380 to 440
- Volumes in close sync with avg traded qty on Daily Chart and in steady stream by Weekly Chart
MEDANTA Price ActionMedanta (Global Health Ltd) is currently trading in the ₹1,300–₹1,335 range, having shown a notable run-up over the past six months, but with increased volatility in recent weeks. The stock reached a recent high near ₹1,393 and a low around ₹935 during the past year.
Fundamentally, Medanta continues to deliver robust revenue growth: annual revenues for FY25 rose to ₹3,692 crore, up approximately 13% from the previous year. Operating profitability remains strong, with margins in the 23% range and net profits exceeding ₹480 crore for the latest fiscal year. However, the most recent quarter saw a profitability dip due to a non-recurring expense, reflecting some variability in the bottom line.
On valuation, Medanta trades at a high price-to-earnings (P/E) ratio of more than 73 and a price-to-book (P/B) above 11, both of which are elevated compared to sector averages. This premium reflects market optimism about its growth prospects but also limits the scope for immediate, significant upside. The company has a modest dividend yield and consistently generates healthy cash flows, contributing to financial strength.
The outlook from analysts remains moderately positive: one-year price targets are clustered around ₹1,300–₹1,500, with the company expected to benefit from long-term sector growth and its strong operating metrics. Near-term, the share price may consolidate after recent gains, with moves likely guided by the next round of earnings and overall market sentiment. Medanta’s key strengths are scale, profitability, and discipline, but its premium valuation requires steady execution and increasing returns to justify further appreciation.

LORDSCHLO Price ActionLords Chloro Alkali Limited (LORDSCHLO) traded positively today, closing at 176.5 after an upward move of 2.77% for the session. The stock opened at 173.45, reached a high of 178.0, and dropped to a low of 169.05 during the day. Trading volume was below average, with about 13,620 shares traded, indicating moderate investor activity.
Price action was characterized by a firm bullish undertone, as the stock built on its gains and held well above both its 50-day and 200-day averages, reflecting underlying strength amidst broader market uncertainty. Support was established just below 170, while resistance near 178 capped further advances. With an EPS of 5.52 and PE around 32, momentum appears strong, and the stock is consolidating above key moving averages, suggesting potential for further upside if buying continues.

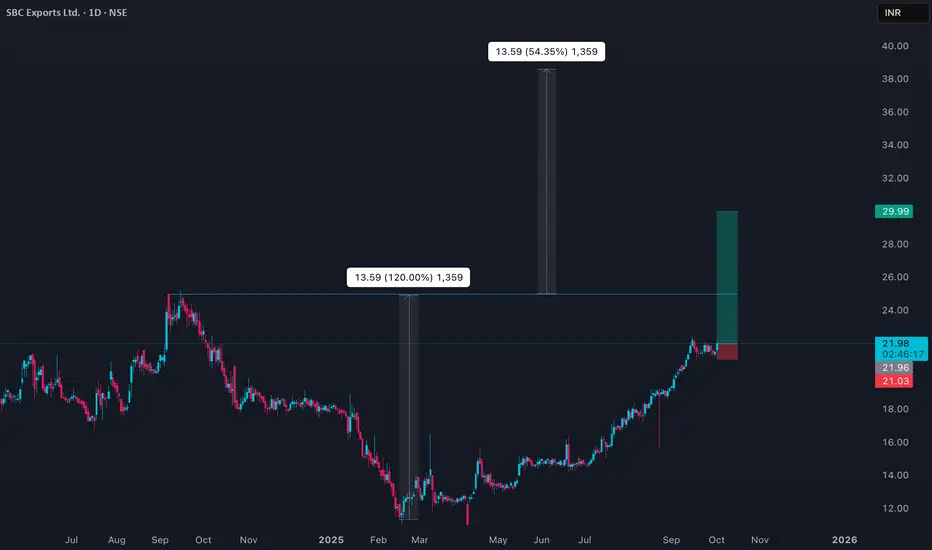
SBC Bullish price actionSBC Exports traded at 21.54 today, showing limited volatility and maintaining a generally sideways movement. The price opened near 21.40 and moved within a narrow range between 21.16 and 21.61, with no aggressive buying or selling pressure evident for most of the session. Trading volumes remained moderate, and the close slightly favored the bulls as the stock ended near the day’s high.
Price action throughout the day was driven mainly by consolidation, following a steady pattern observed in recent days. Technical momentum indicators remained neutral, while support zones around 21.16 held well against minor intraday pullbacks. The prevailing market tone remains cautious, with traders looking for breakout signals above current resistance or below key support levels for directional clarity in the days ahead.
OLAELEC Price ActionOlectra Greentech Ltd (OLAELEC) posted a strong performance today, trading around ₹1,390 with a notable upward move. The stock has been on a bullish trajectory over the past week, rebounding from its recent support near ₹1,350. Short-term moving averages indicate continued positive momentum, with the price well above both the 20- and 50-day averages.
Technical indicators like RSI suggest mild overbought conditions, confirming robust buying interest but also signaling potential consolidation if the stock fails to hold above its current highs. The immediate resistance zone lies near ₹1,420, while strong support is seen at ₹1,350. A sustained breakout above resistance could propel the stock towards ₹1,500 in the coming sessions, whereas a slip below support may lead to a short-term pullback.
Overall, OLAELEC is showing solid relative strength, buoyed by expectations of new contracts and strong demand in the electric vehicle bus segment. Market sentiment remains positive, but traders should be wary of profit booking near resistance. The short-term outlook stays bullish as long as the price holds above its key support levels.

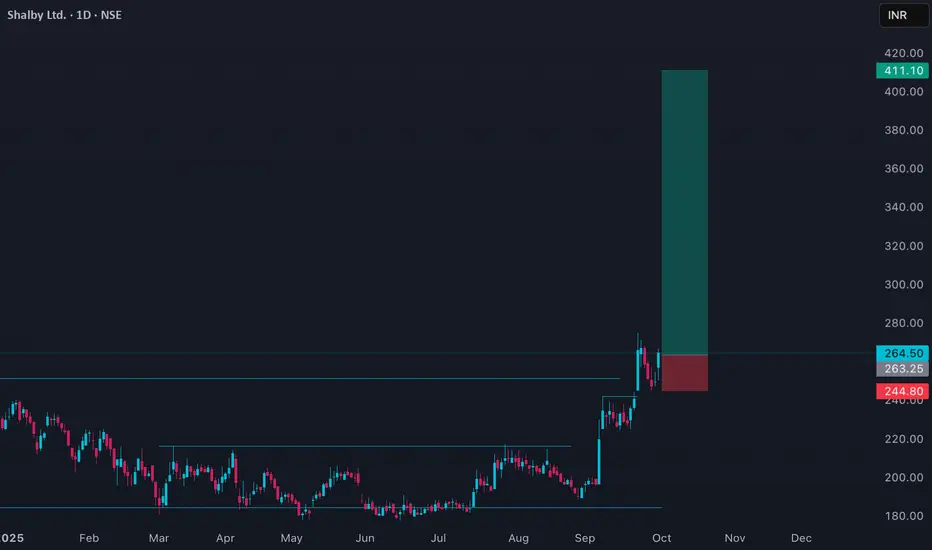
SHALBY Price ActionShalby Limited (SHALBY) is currently in a strong uptrend, closing today at ₹264.85 with a gain of about 6.64%. The stock has traded between ₹250.05 and ₹266.60, showing high momentum and robust volume, indicating strong buying interest.
Price action reveals that SHALBY is trading well above both its 50-day average (~₹214.55) and 200-day average (~₹205.60), confirming the bullish trend. The stock is nearing its 52-week high of ₹282.30, which represents a critical resistance level to watch. Immediate support levels are around ₹250, providing a cushion against potential short-term corrections.
Technical indicators suggest the stock is in an overbought zone, so while the momentum is positive, some consolidation or profit-taking may occur near resistance. Overall, the price action signals continued strength and bullish sentiment, with potential for further upside if the stock breaks above the 52-week high on strong volume.
JKPAPER Price ActionJK Paper Limited (JKPAPER) closed today at ₹385.50, up 3.34% from the previous close of ₹373.05. The stock traded between ₹372.60 and ₹392.95, showing solid buying momentum and trading above its 50-day average of about ₹374, and 200-day average near ₹359.
Technically, JKPAPER is in a moderate uptrend with positive momentum, supported by strong volume and close above short-term averages. The stock faces near-term resistance around ₹395, with strong support around ₹370. Momentum indicators suggest continued bullish bias but overbought conditions could lead to temporary consolidations.
Fundamentally, JK Paper benefits from steady demand in the paper and packaging sector along with improving operational efficiency. The company reported stable revenue growth and improving margins recently, supporting positive sentiment. The medium-term outlook looks constructive if the stock sustains above support and breaks resistance decisively.

BANKINDIA Pyramid set upBank of India (BANKINDIA) closed today at ₹123.35, up 3.79% from the previous close of ₹118.85. The stock traded in a range between ₹118.90 and ₹123.85 on strong volume, showing renewed buying interest. It is trading above its 50-day moving average (~₹114.67) and 200-day moving average (~₹110.67), indicating bullish momentum.
Technically, the stock is in an uptrend with immediate support at ₹119 and resistance around ₹130, the recent 52-week high. Momentum indicators like RSI suggest moderate strength, with room to move higher before overbought conditions. The price action is supported by a solid market cap and improving financials, aligning with positive sentiment in the banking sector.
Overall, Bank of India shows a robust short to medium-term outlook, with potential for further gains if it sustains above current support and builds upon buying momentum. Watch for any breakouts above ₹130 for acceleration, or a dip below ₹119 that may trigger some consolidation.

SINDHUTRAD Price ActionSindhu Trade Links Ltd (SINDHUTRAD) closed today at ₹28.25, registering a gain of 4.4%. The stock traded between ₹26.62 and ₹29.38 during the session, with an opening at ₹27.40. Trading volume was strong, showing 6.2 million shares exchanged, above its average daily volume.
SINDHUTRAD is currently in an upward trajectory, outperforming its 50-day and 200-day averages, which stand at ₹26.29 and ₹22.36 respectively. The price is still some distance below its 52-week high of ₹39.29 but has rebounded significantly from a low of ₹13.00 this year. Technically, momentum is positive and short-term bullish, supported by higher trading turnover and sentiment.
On the valuation front, the current price-to-earnings ratio is 235.4, indicating aggressive pricing and high expectations for future growth, but it is also a warning for possible volatility if earnings do not improve. Market capitalization stands at ₹4,356 crore.
Immediate support is observed near ₹26, while resistance is at ₹29.50, today’s high. Sustained moves above resistance could trigger further upside, while a reversal below support may lead to consolidation or profit booking. Overall, the trend remains favorable, with upward bias, as long as price holds above key support zones.

NATIONALUM Price ActionNational Aluminium Company Ltd (NATIONALUM) closed today at ₹213.87. The stock rallied strongly, rising nearly 5% during the session and trading in a range between ₹204.20 and ₹215.40. Today’s large volume signals solid investor participation and bullish momentum, while the price sits near the upper end of the daily band.
Technically, NATIONALUM remains in a clear short-term uptrend, outperforming its sector with recent moving average crossovers strengthening the bullish case. The key support is now located near ₹204, which was today’s low, and resistance lies at ₹224—the stock’s upper circuit limit. Momentum indicators are in positive territory, reflecting strong buying interest, but short-term traders should be aware that overbought readings could invite some consolidation or profit booking.
On the fundamental side, the company’s financials show robust quarterly revenue and profit growth, with strong operating margins and minimal debt. As a major aluminum producer, NATIONALUM benefits from stable commodity prices and high export demand. Overall sentiment is upbeat, suggesting potential for further gains if market conditions remain supportive and the company sustains its operational efficiency.

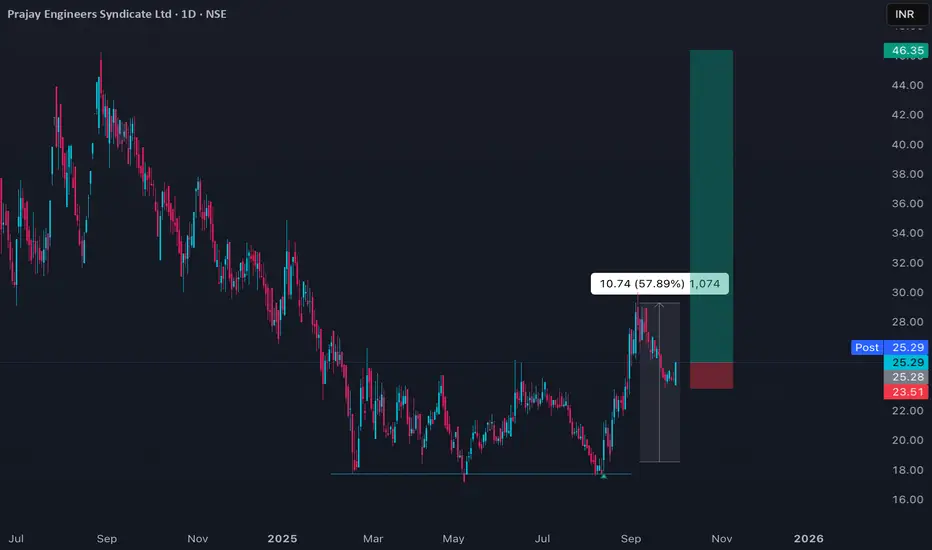
PRAENG Pyramid Set upPrajay Engineers Syndicate Ltd (PRAENG) traded mildly positive today, with prices fluctuating within a narrow range around ₹20. The stock continues its recovery from recent lows, showing incremental gains over the past few sessions. Short-term technical indicators suggest the price is trading above its 20-day moving average, signaling some regained bullish momentum, but the overall trend remains sideways.
Momentum signals such as RSI are moderately positioned, indicating neither strong buying nor oversold conditions. Volume is stable but not exceptionally high, which points to limited participation and tempered volatility. Support for PRAENG is near ₹18, reflecting the base built over the last month; resistance appears at ₹22, where previous rallies have stalled.
Fundamentally, the company has delivered modest improvement in sales and managed to reduce operational losses recently, but overall business and industry headwinds persist. The medium-term outlook stays neutral, with further upside possible if the stock can close above the ₹22 resistance zone on higher volume. Conversely, a drop below support may trigger another leg down in price.
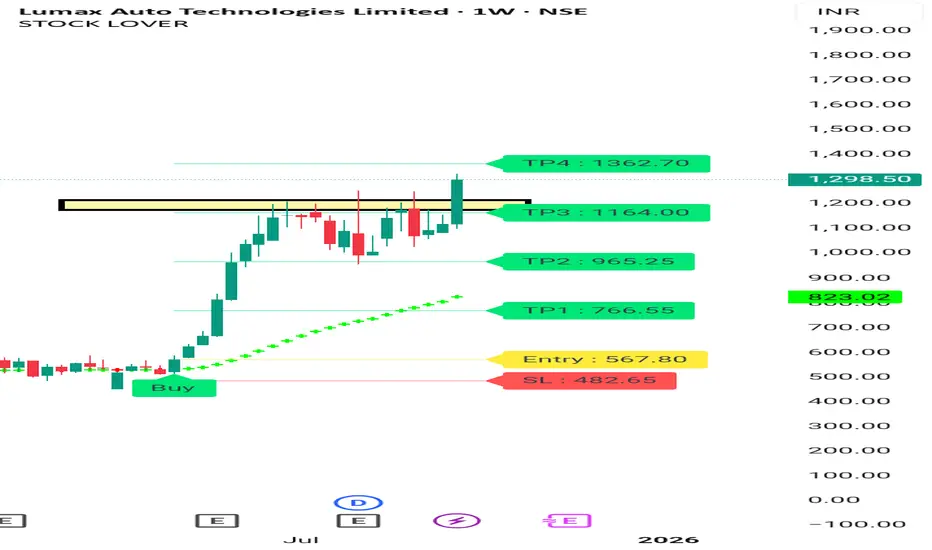
Lumax Tech Breakout On Weekly Chart Full auto Ancillary Sector is on. Breakout. Lumax Tech also Give Breakout.
It's good bet for Medium to long term with a StopLoss.
Tgt 1500 -1800
Keep SL of 10%
Consult your financial advisor before making any position.
For more information visit my profile on Tradingview.
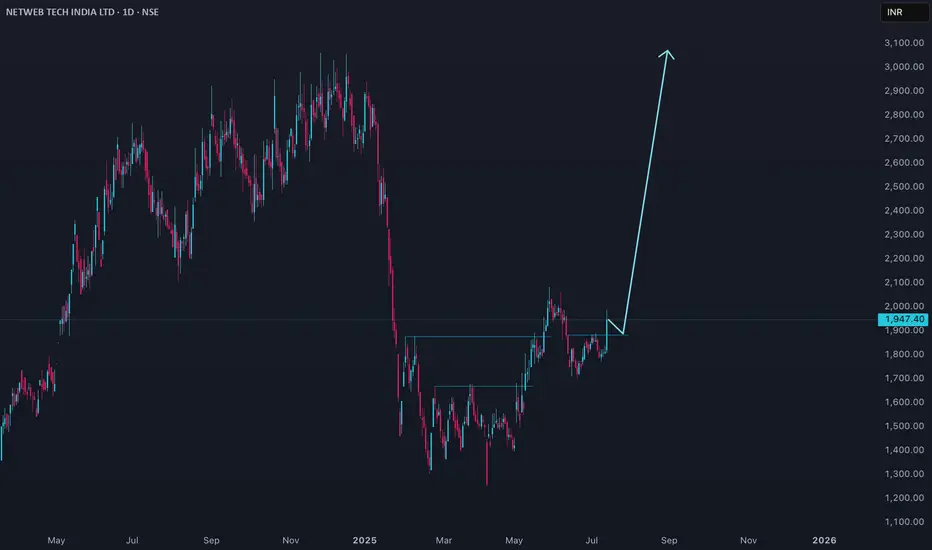
NETWEB Price actionNetweb Technologies (NETWEB) is trading at ₹1,947.40 as of July 11, 2025. The stock has shown a strong short-term recovery, up about 7.4% in the last session and nearly 6.8% over the past week, but it remains down by over 25% in the past six months. The 52-week high is ₹3,060 and the low is ₹1,251.55.
Valuation-wise, NETWEB is trading at a high price-to-earnings ratio (around 90–96) and a price-to-book ratio near 20, indicating a premium valuation. The company’s market capitalization is approximately ₹11,000 crore. Promoter holding has slightly decreased in the recent quarter.
For the near term, technical targets suggest resistance around ₹2,000–2,040 and support in the ₹1,750–1,850 range. Analyst forecasts for the next year place price targets between ₹1,824 and ₹2,805.
Fundamentally, the company is considered overvalued at current levels, despite strong recent profit growth. The stock’s premium valuation and recent volatility suggest caution for new investors, with further upside dependent on continued earnings momentum and broader market sentiment.
TTKHLTCARE Price ActionTTK Healthcare Ltd closed at ₹1,190 today, with a marginal decline of 0.03%. The stock traded in a tight intraday range between ₹1,189 and ₹1,205, showing sideways movement with modest trading volumes. Current price trends suggest consolidation after recent declines, as the stock has retreated significantly from its 52-week high of ₹1,770 but remains above its yearly low of ₹1,101.
Technically, TTK Healthcare is hovering around its 50-day average but well below its 200-day moving average, signaling caution in the medium term. Momentum indicators remain neutral, with no decisive bullish or bearish signals emerging. Support is visible near ₹1,180, while resistance stands at ₹1,205; any sustained breakout or breakdown beyond these levels could direct the next move.
Fundamentally, the company maintains a price-to-earnings ratio of about 26.65 and an EPS of ₹44.65. Dividend yield is moderate. Overall, TTK Healthcare is consolidating near lower price bands, and short-term direction will depend on movements beyond its current range, with traders watching for fresh volume or breakout signals.

JINDALPOLY Price ActionJindal Poly Films Ltd closed today at ₹595.45, slipping slightly from the previous session. The stock traded in a tight intraday range between ₹588.05 and ₹597.80, showing muted price action after a recent attempt at a short-term rebound. Volumes remained below the 20-day average, indicating cautious sentiment and potential lack of follow-through by buyers.
Technically, the stock remains below its 200-day moving average, highlighting medium-term weakness, but it has managed to hold above its 50-day average, which provides some hope for short-term recovery. The company’s 52-week high is ₹1,150, while the 52-week low is ₹505.55—a sign of significant past volatility and correction. Book value per share is considerably higher than current price, contributing to a low price-to-book ratio near 0.62, and the price-to-earnings ratio remains negative due to recent losses.
Momentum indicators are neutral with no clear trend reversal signal. Despite a mild recovery in recent weeks, medium- and long-term returns remain negative. The company announced a final dividend of ₹5.9 per share, resulting in a 1% dividend yield in line with the industry average, but forward earnings outlook remains constrained and free cash flows are a concern.
Overall, Jindal Poly Films is currently in a consolidation phase after a long downtrend, displaying a defensive and range-bound character. Sustained trading above ₹600–₹610 could improve bullish prospects, while a breakdown below ₹588 may lead to renewed weakness. Investors should monitor volume and price action within this narrow range for early signals of the next directional move.

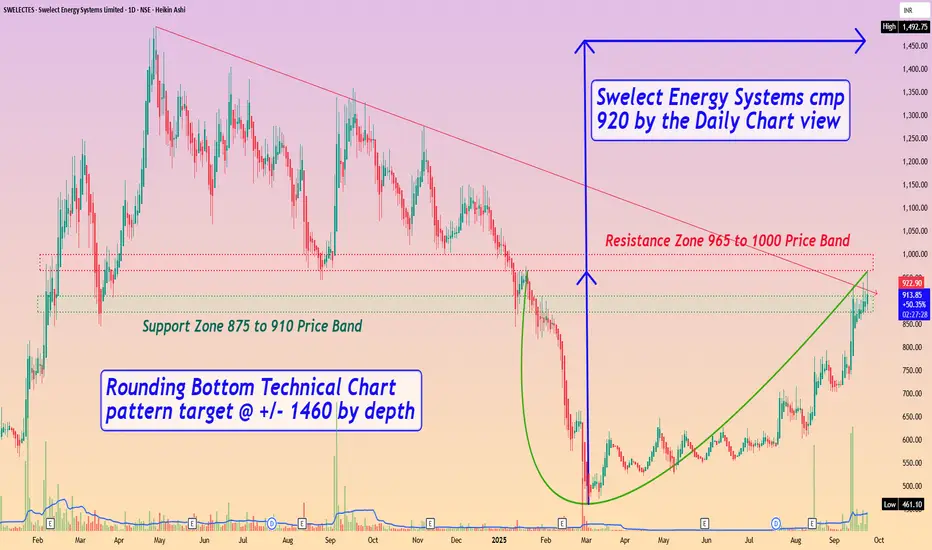
Swelect Energy Systems cmp 920 by the Daily Chart viewSwelect Energy Systems cmp 920 by the Daily Chart view
- Support Zone 875 to 910 Price Band
- Resistance Zone 965 to 1000 Price Band
- Rounding Bottom Technical Chart pattern target @ +/- 1460 by depth
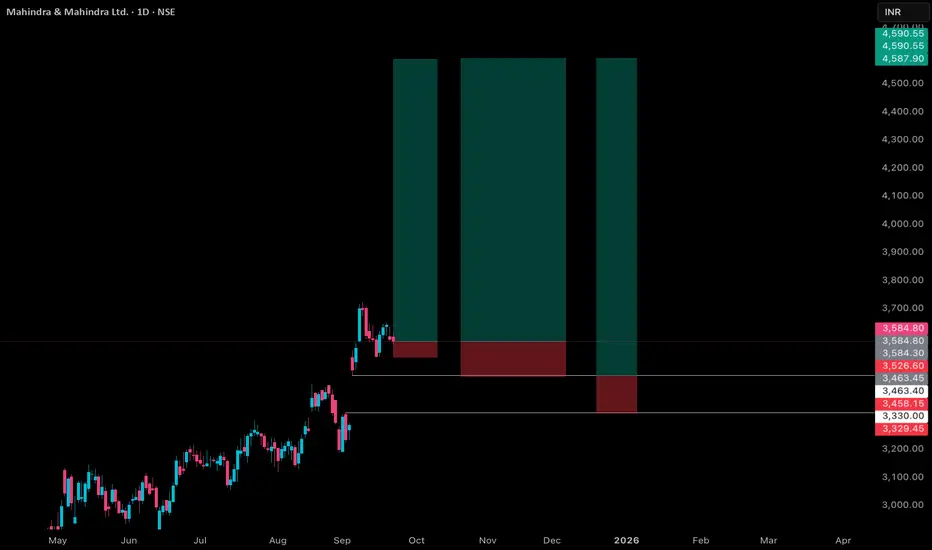
Mahindra & Mahindra Price ActionMahindra & Mahindra (M&M) closed today at ₹3,584.8, showing a slight decline of about 0.2% from the previous close. The stock traded in a range between ₹3,569 and ₹3,616 during the session, indicating sideways movement with moderate volatility. Despite the minor pullback, M&M remains well above its 50-day and 200-day moving averages, supporting its medium-term upward trend.
The stock exhibits strong fundamentals with an EPS of ₹122.13 and a price-to-earnings ratio near 29.35, reflecting reasonable valuation relative to its earnings. Return on capital employed (ROCE) stands around 13.9%, and the company has a consistent track record of delivering sales and profit growth at healthy compounded annual rates over recent years.
Key support levels to watch are ₹3,550 and ₹3,500, while resistance lies near the recent session high at ₹3,616 and extends toward the 52-week high vicinity near ₹3,724. Momentum indicators show mild consolidation, suggesting that a break above resistance could lead to renewed buying interest.
Overall, M&M is in a stable position with a constructive outlook, balancing between short-term consolidation and medium- to long-term targets driven by robust business performance and diversified presence across automotive and industrial segments.
VSTTILLERS Price Action Multiple set upVST Tillers Tractors Ltd closed today at ₹5,186, slipping slightly by approximately 0.86%. The stock traded between an intraday low of ₹5,146 and a high of ₹5,272, reflecting minor profit booking after recent robust gains. The company remains fundamentally strong, operating with zero debt for the last five years and consistently offering a dividend payout.
Technically, VST Tillers holds above its 50-day and 200-day moving averages, maintaining its uptrend on the daily chart. The price-earnings ratio is approximately 39, and return on capital employed stands healthy. Support is clustered around ₹5,146, with the next key zone near ₹5,100; resistance is seen at ₹5,272 with the all-time high at ₹5,548. In terms of market cap growth and volume, investor interest remains elevated, supporting its overall upward trajectory.
In summary, VST Tillers is showing strong medium-term structure with bullish bias. Pullbacks have attracted buyers and, barring a decisive fall below ₹5,100, the stock is well positioned for further appreciation towards its 52-week high region.

SYRMA Price ActionSyrma SGS Technology Ltd closed at ₹816.25 today, down 1.39% with a loss of ₹11.5 from the previous session. The stock opened at ₹834.80 and traded within a range of ₹811.95 to ₹836.95, reflecting a mildly bearish session after demand failed to sustain above recent highs. Despite the pullback, Syrma SGS remains in a firm uptrend on longer time frames, still trading well above its 50-day and 200-day averages.
The price action signals some profit booking near resistance zones close to ₹837, while immediate support now lies at ₹812 and secondary support at ₹800. With the recent rally, momentum indicators are cooling but not oversold, suggesting a potential for pause or minor consolidation before the next directional move. With a price-to-earnings ratio near 72.5, Syrma trades at a premium on growth expectations, and market cap continues to expand, standing around ₹14,544 crore.
Overall, the technical posture remains bullish in the medium term, though short-term traders should watch for stabilization near support zones and a decisive close above ₹837 for renewed upside momentum.

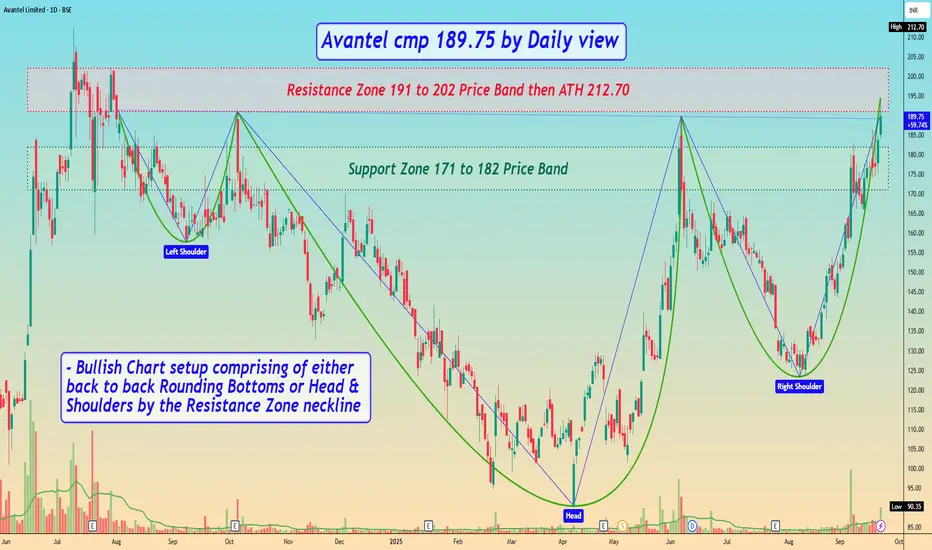
Avantel cmp 189.75 by Daily viewAvantel cmp 189.75 by Daily view
- Support Zone 171 to 182 Price Band
- Resistance Zone 191 to 202 Price Band then ATH 212.70
- Volumes are in close sync with the average traded quantity over past few days
- Bullish Chart setup comprising of either back to back Rounding Bottoms or Head & Shoulders by the Resistance Zone neckline
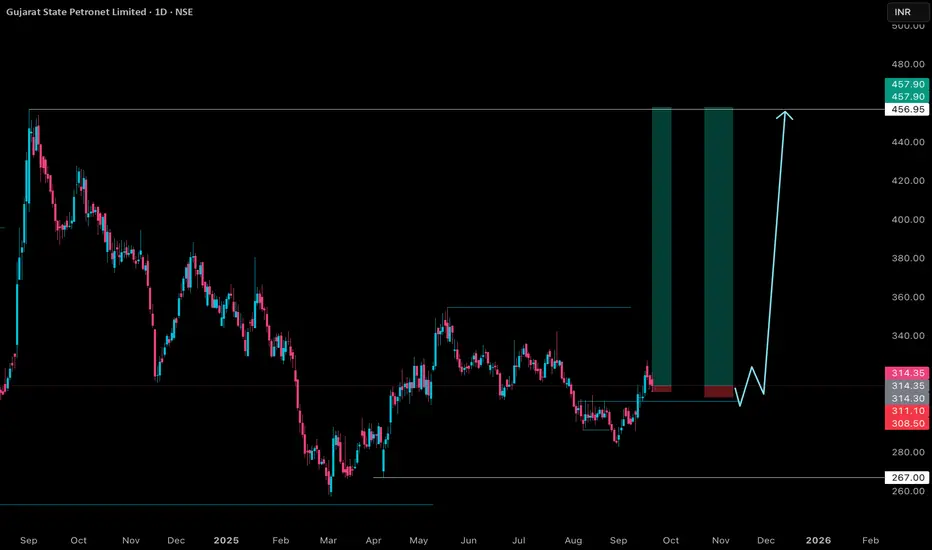
GSPL Price Action, muliple trade set upGSPL (Gujarat State Petronet Ltd) traded firm today, closing near ₹387 and maintaining a robust uptrend. The stock established an intraday range between ₹379 and ₹392, with active buying visible on dips. Technical structure continues to favor the bulls, as GSPL remains well above its short-term moving averages and consistently sets higher lows on the daily chart.
Momentum indicators are positive but not overbought, pointing to continued strength with scope for moderate upside. Immediate resistance is placed at ₹395, and a breakout above this level could target the ₹410–₹420 range. Support levels are found at ₹380 and ₹372; a fall below these may prompt short-term profit booking, but trend reversal signals remain absent for now.
Overall, GSPL’s price action and technicals highlight sustained bullish sentiment, with pullbacks finding buyers and volume trends supporting further gains as long as it holds above key support zones.
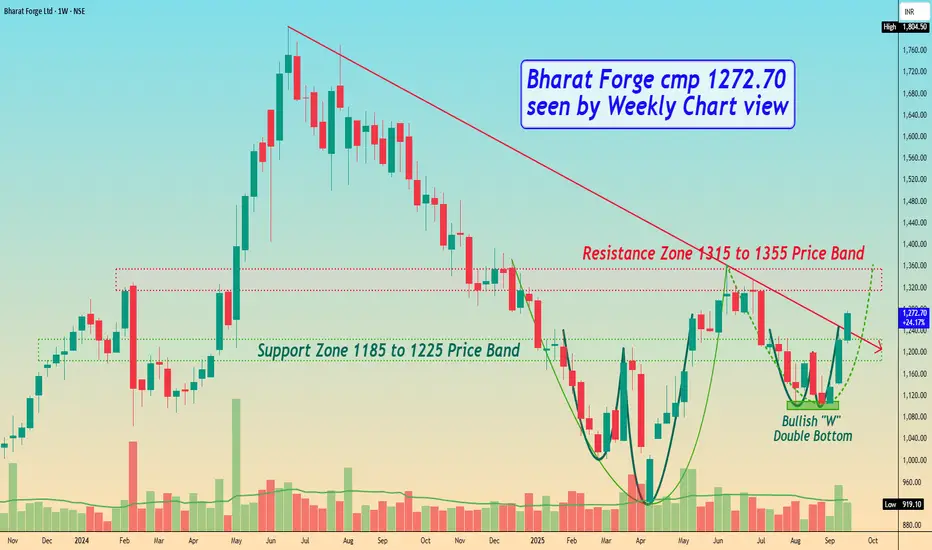
Bharat Forge cmp 1272.70 seen by Weekly Chart viewBharat Forge cmp 1272.70 seen by Weekly Chart view
- Support Zone 1185 to 1225 Price Band
- Resistance Zone 1315 to 1355 Price Band
- Bullish "W" Double Bottom formed below Support Zone
- Falling Resistance Trendline Breakout sustained on Daily Chart
- Volumes seen improving and spiking above average traded quantity
- Support Zone tested retested on Daily Chart, earlier been Resistance Zone