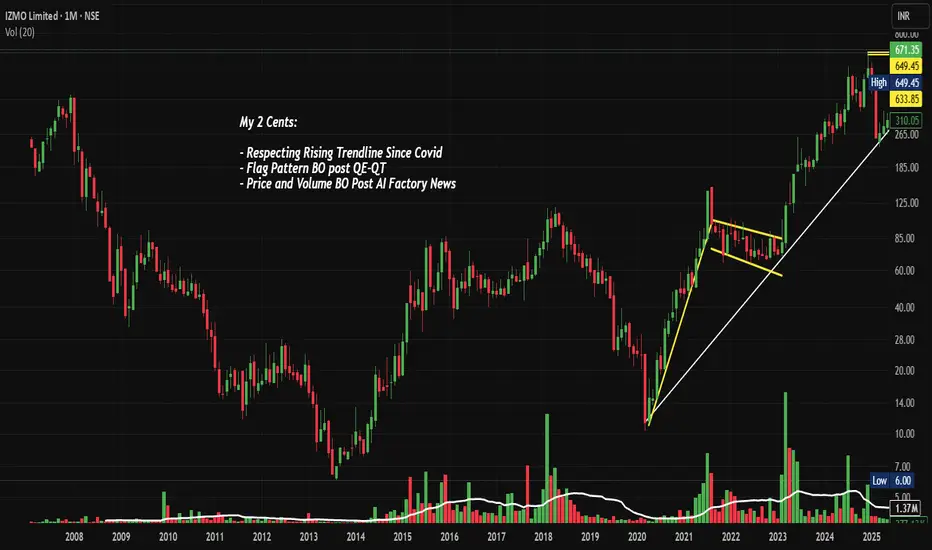
IZMO: From ₹6 to ₹671 - What's Next? Chart of the MonthNSE:IZMO Why This ₹671 Unknown Indian AI Factory Stock Could Be the Next Multibagger in 2025? Let's analyze in the "Chart of the Month"
As per the Latest SEBI Mandate, this isn't a Trading/Investment RECOMMENDATION nor for Educational Purposes; it is just for Informational purposes only. The chart data used is 3 Months old, as Showing Live Chart Data is not allowed according to the New SEBI Mandate.
Disclaimer: "I am not a SEBI REGISTERED RESEARCH ANALYST AND INVESTMENT ADVISER."
This analysis is intended solely for informational purposes and should not be interpreted as financial advice. It is advisable to consult a qualified financial advisor or conduct thorough research before making investment decisions.
Price Action:
- Current Price: ₹671.35 (as of Aug 31, 2025)
- 52-Week Range: ₹230.00 - ₹738.40
- Stock has demonstrated exceptional momentum with 11,000%+ returns since COVID lows
- Currently trading near all-time highs with strong volume confirmation
Volume Spread Analysis:
- Volume spike evident during recent breakout phases
- 13.5M volume this month, showing active institutional participation
- Volume pattern confirms genuine breakout above resistance zones
- Higher volume on up days indicates accumulation by smart money
Key Technical Levels:
Support Levels:
- Primary Support: ₹633.85 (previous resistance turned support)
- Secondary Support: ₹580-590 zone (trend line confluence)
- Critical Support: ₹520-540 (major demand zone)
Resistance Levels:
- Immediate Resistance: ₹738.40 (all-time high)
- Secondary Resistance: ₹800-850 (psychological levels)
- Extended Target: ₹950-1000 (measured move projection)
Base Formation:
- Multi-year base formation from 2020-2022 (₹20-80 range)
- Clean breakout above ₹100 marked the beginning of the current uptrend
- Stage 2 markup phase with consistently higher highs and higher lows
Technical Patterns Identified:
- Cup and Handle pattern completed on a monthly timeframe
- Ascending triangle breakout above ₹600
- Bull flag consolidation pattern near current levels
- Rising wedge formation within broader uptrend (caution signal)
Sectoral and Fundamental Backdrop:
Company Overview:
- NSE:IZMO is a global leader in automotive interactive marketing solutions, providing hi-tech automotive e-retailing solutions across North America, Europe, and Asia
- Founded by Dinanath Soni and Sanjay Vedprakash Soni in 1995, headquartered in Bangalore
Recent Catalysts:
- The company recently launched its Automotive AI Factory, a breakthrough innovation hub to accelerate AI adoption across the automotive industry
- The AI Factory can deliver enterprise-grade AI capabilities at 70-80% lower cost than Western markets
- The hub will deliver customized AI models that optimize pricing and operations while enhancing customer engagement
Financial Metrics:
- Market Cap: ₹1,000 Crores (up 64.5% in 1 year)
- Revenue: ₹234 Crores, Profit: ₹49 Crores
- Trading at 2.78 times book value and 19.6x P/E
- Promoter holding: 34.95%
Sectoral Trends:
- The automotive industry is increasingly adopting AI-driven solutions
- Digital transformation in automotive retail is accelerating post-COVID
- Growing demand for interactive marketing solutions globally
- India emerging as a cost-effective hub for AI and tech services
Key Risks:
- Recent Q1FY26 results showed a -5.52% QoQ revenue decline and -12.9% QoQ net profit decrease
- Concentration risk in the automotive sector
- Currency fluctuation risk due to international operations
Bullish Factors:
- Revolutionary AI Factory launch provides new growth avenue
- Strong technical breakout with volume confirmation
- Global leadership position in niche automotive marketing space
- Cost advantage in AI solutions delivery
- Multi-year base breakout suggesting sustainable uptrend
Risk Factors:
- Recent quarterly performance decline
- Elevated valuation levels
- Potential for profit-taking near all-time highs
- Sector-specific risks and economic sensitivity
Full Coverage on my Newsletter this Week
Keep in the Watchlist and DOYR.
NO RECO. For Buy/Sell.
📌Thank you for exploring my idea! I hope you found it valuable.
🙏FOLLOW for more
👍BOOST if you found it useful.
✍️COMMENT below with your views.
Meanwhile, check out my other stock ideas on the right side until this trade is activated. I would love your feedback.
As per the Latest SEBI Mandate, this isn't a Trading/Investment RECOMMENDATION nor for Educational Purposes, it is just for Informational purposes only. The chart data used is 3 Months old, as Showing Live Chart Data is not allowed according to the New SEBI Mandate.
Disclaimer: "I am not a SEBI REGISTERED RESEARCH ANALYST AND INVESTMENT ADVISER."
This analysis is intended solely for informational purposes and should not be interpreted as financial advice. It is advisable to consult a qualified financial advisor or conduct thorough research before making investment decisions.
Bullish Trend Line
Cupid Price ActionCupid Limited’s stock is trading around ₹158 as of early August 2025, having recently hit new record highs above ₹162. The share price surged over 45% in the past month and is up more than 100% year-to-date, significantly outperforming both its FMCG peers and the broader market. Volatility is high: daily moves of 5–6% are common, and intraday swings have reached as much as 8%. The stock is trading well above all major moving averages, reflecting strong buying momentum.
Long-term performance is outstanding: over 1,300% returns in three years and more than 2,100% across ten years. That said, short-term technical signals show that Cupid is “overbought” (very high RSI) and potentially due for a corrective pullback, though robust momentum could drive further gains. The high PE ratio near 104 and price/book around 21 indicate a rich valuation versus historic averages and sector norms.
Market capitalization is about ₹4,240 crore. Despite being expensive on most valuation models, the company is seen as fundamentally strong: steady operational performance, minimal debt, and no significant pledged shares. The company’s next earnings announcement is due August 8, and recent market behavior suggests results can drive significant further volatility.
Compared to other FMCG names, Cupid’s returns are exceptionally strong while most large and mid-cap sector players (like HUL, Dabur, and Colgate) have posted declines over the past year. Liquidity has increased with heavy volume spikes during rallies, supporting the uptrend.
In summary, Cupid is a high-momentum, high-volatility small-cap outperformer exhibiting extraordinary multi-year returns. The stock trades at elevated valuations and, while short-term corrections may occur, its leadership in the sector and technical strength continue to attract aggressive buyers.

MEDANTA Price ActionMedanta (Global Health Ltd) is currently trading in the ₹1,300–₹1,335 range, having shown a notable run-up over the past six months, but with increased volatility in recent weeks. The stock reached a recent high near ₹1,393 and a low around ₹935 during the past year.
Fundamentally, Medanta continues to deliver robust revenue growth: annual revenues for FY25 rose to ₹3,692 crore, up approximately 13% from the previous year. Operating profitability remains strong, with margins in the 23% range and net profits exceeding ₹480 crore for the latest fiscal year. However, the most recent quarter saw a profitability dip due to a non-recurring expense, reflecting some variability in the bottom line.
On valuation, Medanta trades at a high price-to-earnings (P/E) ratio of more than 73 and a price-to-book (P/B) above 11, both of which are elevated compared to sector averages. This premium reflects market optimism about its growth prospects but also limits the scope for immediate, significant upside. The company has a modest dividend yield and consistently generates healthy cash flows, contributing to financial strength.
The outlook from analysts remains moderately positive: one-year price targets are clustered around ₹1,300–₹1,500, with the company expected to benefit from long-term sector growth and its strong operating metrics. Near-term, the share price may consolidate after recent gains, with moves likely guided by the next round of earnings and overall market sentiment. Medanta’s key strengths are scale, profitability, and discipline, but its premium valuation requires steady execution and increasing returns to justify further appreciation.

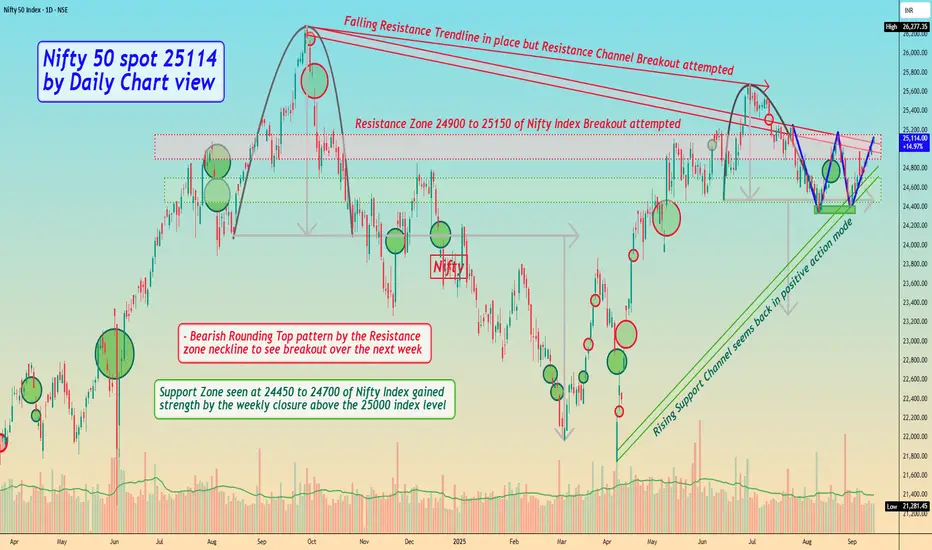
Nifty 50 spot 25114 by Daily Chart view - Weekly UpdateNifty 50 spot 25114 by Daily Chart view - Weekly Update
- Rising Support Channel seems back in positive action mode
- Resistance Zone 24900 to 25150 of Nifty Index Breakout attempted
- Falling Resistance Trendline in place but Resistance Channel Breakout attempted
- Bearish Rounding Top pattern by the Resistance zone neckline to see breakout over the next week
- Bullish "W" with Double Bottom formed below Support Zone, seems instrumental for uptrend momentum
- Support Zone seen at 24450 to 24700 of Nifty Index gained strength by the weekly closure above the 25000 index level
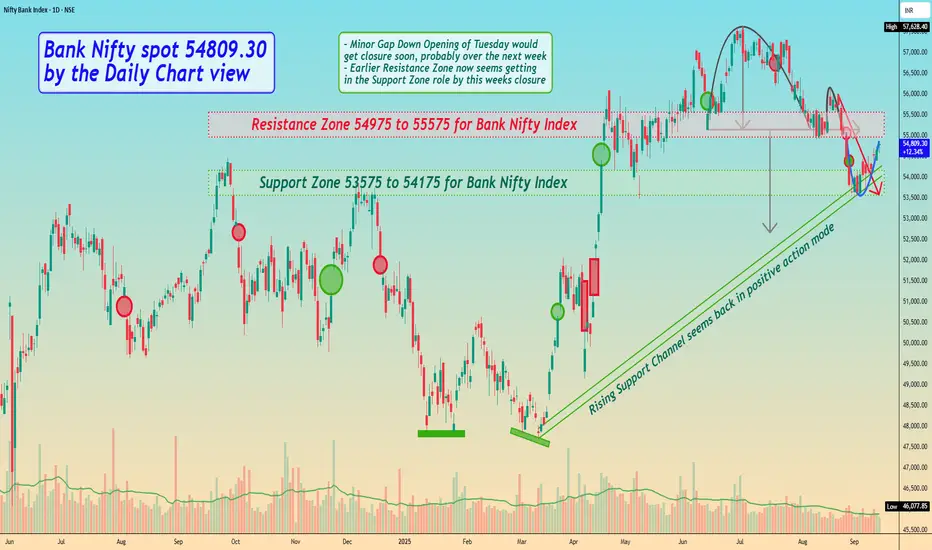
Bank Nifty spot 54809.30 by Daily Chart view - Weekly UpdateBank Nifty spot 54809.30 by Daily Chart view - Weekly Update
- Support Zone 53575 to 54175 for Bank Nifty Index
- Rising Support Channel seems back in positive action mode
- Resistance Zone 54975 to 55575 of Bank Nifty Index may act as a strong barrier to cross
- Minor Gap Down Opening of Tuesday would get closure soon, probably over the next week
- Earlier Resistance Zone now seems like getting in the Support Zone role by this weeks closure
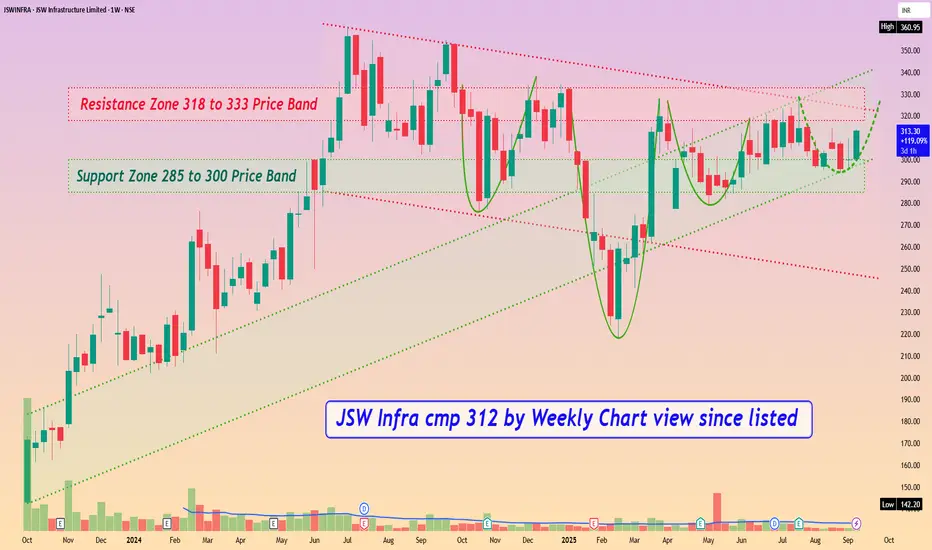
JSW Infra cmp 312 by Weekly Chart view since listedJSW Infra cmp 312 by Weekly Chart view since listed
- Support Zone 285 to 300 Price Band
- Resistance Zone 318 to 333 Price Band
- Bullish Rounding Bottoms repeated under the Resistance Zone neckline
- Stock making Higher High Lower High pattern within up-trending price channel momentum
- Stock traversing within Rising Support + Price Channel and attempting Falling Resistance + Price Channel Breakout
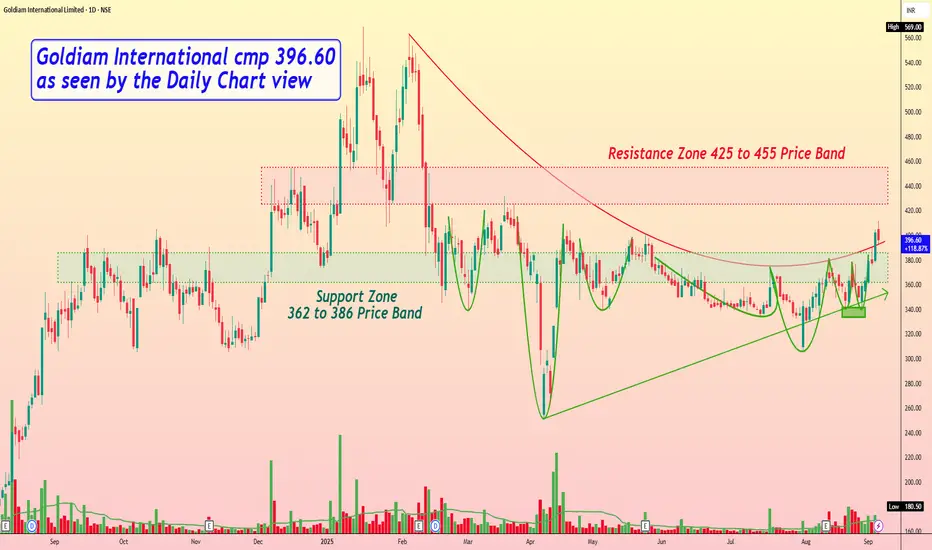
Goldiam International cmp 396.60 as seen by the Daily Chart viewGoldiam International cmp 396.60 as seen by the Daily Chart view
- Support Zone 362 to 386 Price Band
- Resistance Zone 425 to 455 Price Band
- Bullish "W" with Double Bottom formed at 340 price level
- Breakout attempted from Curved Falling Resistance Trendline
- Price momentum has well respected the Rising Support Trendline
- Volumes spiking above avg traded quantity over the past few weeks
- Multiple Bullish Rounding Bottoms formed around Support Zone neckline
- Majority of common Technical Indicator BB, EMA, MACD, RSI trending positively
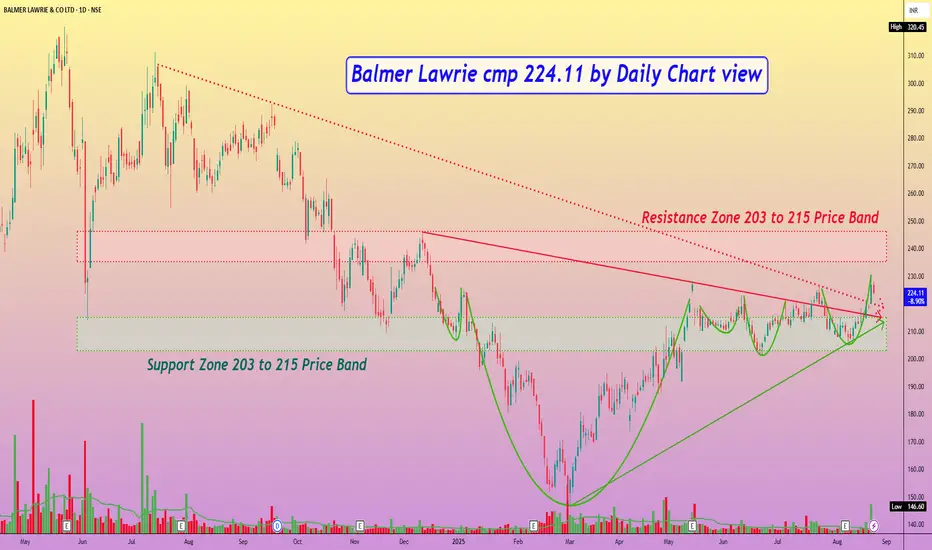
Balmer Lawrie cmp 224.11 by Daily Chart viewBalmer Lawrie cmp 224.11 by Daily Chart view
- Support Zone 203 to 215 Price Band
- Resistance Zone 203 to 215 Price Band
- Multiple Bullish Rounding Bottoms around Support Zone
- Both Falling Resistance Trendlines Breakout seems sustained
- Heavy Volumes surge on Friday post close sync with avg traded qty
- Upwards Price momentum has well respected the Rising Support Trendline
- [ b]*Inside Bar made on Friday closure, indicates observing caution either a Breakout or Breakdown*
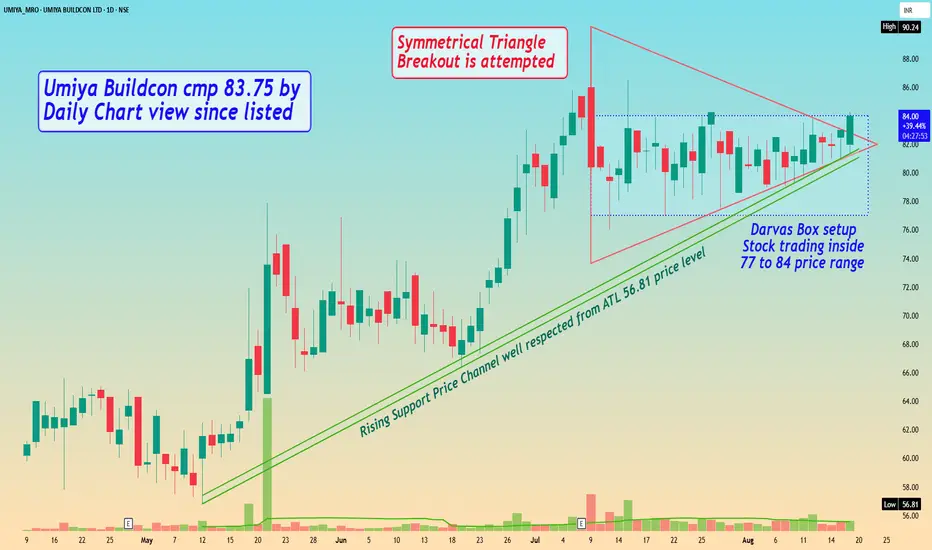
Umiya Buildcon cmp 83.75 by Daily Chart view since listedUmiya Buildcon cmp 83.75 by Daily Chart view since listed
- Support Zone 79 to 81 Price Band
- Resistance Zone 85 to 87 then ATH 90.24
- Symmetrical Triangle Breakout is attempted
- Volumes are in close sync with average traded quantity
- Darvas Box setup Stock trading inside 77 to 84 price range
- Rising Support Price Channel well respected from ATL 56.81 price level
ITDCEM Price Action## ITD Cementation India Limited (ITDCEM) Price Analysis (August 2025)
### Price & Market Metrics
- **Current share price:** Around ₹793 (NSE, August 13, 2025).
- **Market capitalization:** Approximately ₹13,622 crore.
- **52-week range:** ₹467 (low) to ₹944 (high).
- **Day's trading range:** ₹762–₹804.
- **Recent price change:** Up about 4.5% on the day.
- **Average volumes:** About 762,000 shares traded daily in recent periods.
### Returns & Volatility
- The stock has seen a strong rebound from lows around ₹467 in the past year to near ₹793 currently.
- Price movements recently show moderate volatility within a range of about 5% intraday.
- The 52-week high near ₹944 was achieved recently in July 2025.
### Valuation Metrics
- Price/Earnings (P/E) ratio: Approximately 33.3, which is moderately high.
- Earnings per share (EPS): ₹23.83.
- Dividend yield is low at around 0.25%.
- The stock currently trades above its 50-day average price (~₹812) and significantly above its 200-day average (~₹612), indicating recent bullish momentum.
### Financial & Business Highlights
- ITD Cementation is in the infrastructure sector, focusing on construction and civil engineering.
- The company is supported by a solid order book and infrastructure demand growth.
- Market sentiment has been positive with institutional investor meetings scheduled mid-August 2025.
### Technical Sentiment
- The stock price has recently pulled back slightly from highs but remains strong overall.
- Moving averages suggest upward momentum.
- Volume patterns indicate active trading and buyer interest.
***
### Summary
ITDCEM is trading near its upper range for the year, with a current price around ₹793 and a strong market capitalization above ₹13,000 crore. The valuation is moderately high with a P/E above 30 and EPS near ₹24. Recent price momentum is positive supported by infrastructure sector tailwinds and investor interest. While the stock has experienced some volatility, the technical indicators point to sustained buying at current levels. Dividend yield remains low, consistent with growth-oriented infrastructure companies. Investors should consider valuation moderately stretched but justified by growth prospects and market position. Caution is advised for short-term price swings given past volatility.

Gopal Snacks Ltd Price ActionGopal Snacks Ltd’s share price is around ₹359.5 as of August 3, 2025. Over the past year, the stock has shown only a modest increase (up about 1%), with greater strength seen in the last six months (up 7%). The 52-week range is broad, with a high near ₹520 and a low around ₹253, indicating significant volatility. Average daily trade volumes have also risen, supporting liquidity.
The company’s financial performance for FY25 shows total revenue at approximately ₹1,474 crore, a slight rise over FY24. However, net profit slumped sharply to ₹19 crore in FY25 from ₹100 crore a year earlier, with the operating profit margin declining to about 5.3% (from nearly 10%). EPS stands at ₹1.52 for the most recent year. Key ratios—P/E around 82.7 and P/B near 11—point to a premium valuation, especially considering the weak recent profit growth.
Operationally, Gopal Snacks has faced challenges, including a significant quarterly loss attributed to rising costs and a one-off fire incident, which hurt margins and caused a 12% revenue drop that quarter. As a result, compounded profit growth is negative for the trailing twelve months, and return on equity dropped to 14% (from nearly 27% over the previous three years).
Promoter holding remains high (over 81%), but the stock is classified as high-risk, with volatility more than three times that of the broader Nifty index. Despite a positive dividend payout ratio (now around 66%), overall yield remains modest at less than 0.3%.
In summary, Gopal Snacks Ltd is a small-cap FMCG stock trading markedly below its 52-week highs, reflecting weak earnings momentum after a challenging year. Stronger long-term fundamentals and established market presence support the stock, but recent headwinds—including falling margins, higher volatility, and rich valuations—call for investor caution if seeking near-term upside.

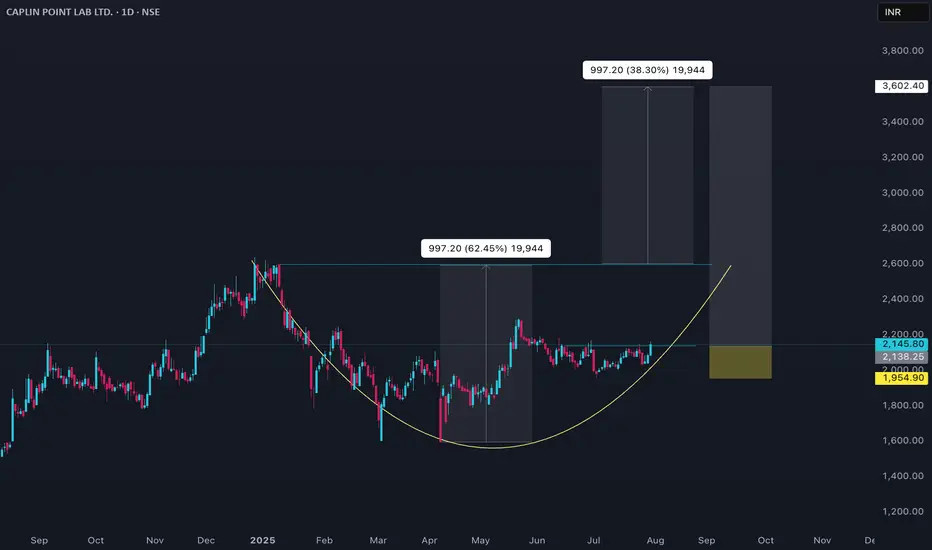
CAPLIPOINT Price ActionAs of July 31, 2025, Caplin Point Laboratories Ltd (CAPLIPOINT) is trading near ₹2,085, showing a mixed but steady performance with some recent price fluctuations around this level. The stock briefly touched intraday highs around ₹2,095 and lows near ₹2,030, maintaining support in the ₹2,030–₹2,055 range. Market capitalization stands broadly near ₹15,590 crore.
Caplin Point benefits from solid fundamentals in the pharmaceutical sector, supported by consistent revenue growth and operational efficiencies. The price-to-earnings ratio sits around 29, while the price-to-book ratio is approximately 5.5, indicating premium valuation relative to book but in line with sector expectations. Dividend yield is low at about 0.15%, reflecting the company’s focus on growth over payout.
Technically, the stock tends to hover above its medium-term moving averages like the 50-day and 200-day SMAs, showing cautious bullish momentum, although near-term volatility remains. Trading volumes are moderate, and the relative strength index is near mid-range levels, suggesting balanced momentum without overbought or oversold extremes.
Overall, Caplin Point Laboratories currently reflects steady fundamentals with a valuation premium typical of its pharma peer group, supported by stable trading ranges and positive medium-term technical signals. The near-term outlook remains cautiously optimistic, with key support near ₹2,030 and potential resistance around ₹2,100–₹2,120.
NIACL Price ActionAs of July 30, 2025, New India Assurance Company Ltd (NIACL) stock closed near ₹204, showing a strong recovery with a sharp rally of around 17% in a single day fueled by robust Q1 earnings and positive market sentiment. The stock bounced back from earlier volatility and support levels near ₹170, with technicals indicating bullish momentum supported by moving average crossovers.
NIACL’s recent financial performance has been impressive with an 80% surge in net profit year-on-year and a 13% growth in gross written premiums, reflecting strong industry position and operational gains. Its market capitalization stands near ₹33,676 crore with a price-to-earnings ratio around 32 and a price-to-book ratio about 1.2, suggesting valuation in line with sector averages but on the higher side.
While the stock has faced some volatility and a one-year decline near 27%, it has gained nearly 19% over the past three months, driven by improved underwriting efficiency and investment income stability. Analysts remain cautiously optimistic about its near-term upside potential, assuming continued operational improvements and support at key price levels.
In summary, NIACL currently presents a turnaround profile with renewed earnings strength, improving fundamentals, and constructive technical signals, making it an interesting candidate for medium-term investors willing to tolerate some volatility.

Paras Defence Price ActionParas Defence and Space Technologies is currently trading near ₹1,630, having delivered a substantial rally over the past year and outperformed many of its peers in the defence sector. The stock has risen more than 100% from its 52-week low and is trading close to its all-time high, reflecting strong investor confidence and robust momentum. Year-to-date, the stock is up over 60%, though it has shown some short-term volatility with a recent pullback of about 9% in just two days, suggesting a phase of consolidation or correction after its sharp rally.
Fundamentally, the company has demonstrated impressive growth, with recent quarterly results showing revenue up nearly 36% year-on-year and net profit more than doubling. Its return on equity is healthy, and the business remains largely debt-free, which supports its financial stability. The company is also preparing for its first-ever stock split, with a record date set for July 4, 2025. This move is expected to enhance liquidity and attract more retail investors.
Despite these positives, Paras Defence is trading at a high price-to-earnings ratio, indicating that the stock is priced for strong future growth and leaving little room for disappointment. Analyst sentiment is generally positive for the long term, but there is near-term caution due to the recent run-up in price and some signs of weakening momentum. Technical analysts point to key support levels around ₹1,500–₹1,570, with a need for the stock to reclaim ₹1,630 for renewed bullishness.
Overall, Paras Defence is benefiting from strong sector tailwinds, government investment in defence, and its own technological capabilities. While the long-term outlook remains promising, investors should be mindful of the elevated valuation and the potential for further short-term corrections as the stock digests its recent gains.

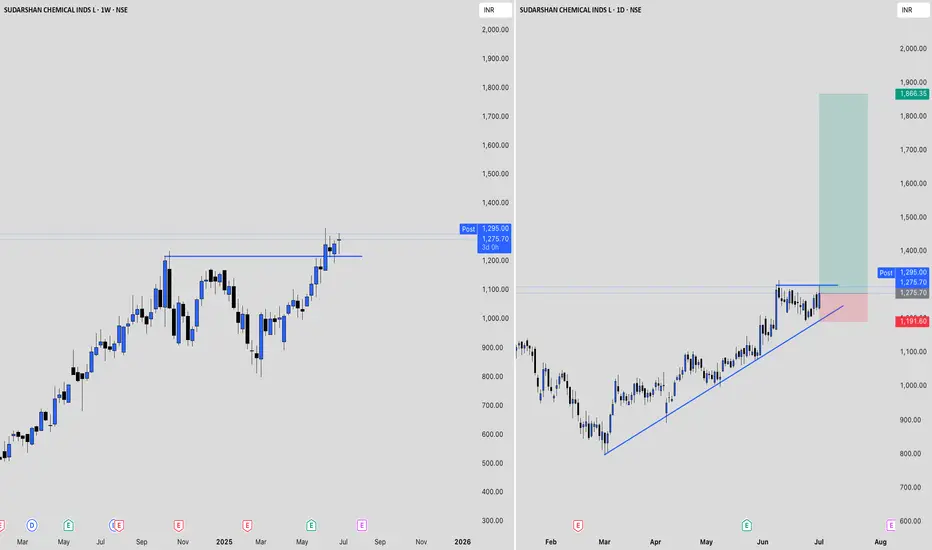
Sudarshan Price ActionSudarshan Chemical Industries is currently trading around ₹1,256, having gained nearly 5% in the past week and over 6% in the last month. The stock has delivered a strong 10% return over six months and nearly 40% over the past year, reflecting robust momentum. Its 52-week high is ₹1,315, while the low stands at ₹796, placing the current price close to its yearly peak.
Valuation-wise, Sudarshan Chemical trades at a high price-to-earnings ratio above 80 and a price-to-book ratio above 8, signaling that the stock is richly valued compared to sector norms. Despite the premium valuation, the company has attracted positive sentiment, with most analysts maintaining a buy or hold stance, though the average target price is slightly below current levels, suggesting limited near-term upside.
Financially, the company has shown steady revenue growth and improved profitability in recent quarters, with net profit margins expanding from previous periods. However, promoter holding has decreased recently, and the company’s sales growth over the past year has been modest. The stock’s low beta indicates relatively lower volatility compared to the broader market.
In summary, Sudarshan Chemical Industries is exhibiting strong price momentum and positive investor sentiment but is trading at expensive valuations. While its recent financial performance has improved, the high valuation and reduced promoter holding may warrant caution for new investors.
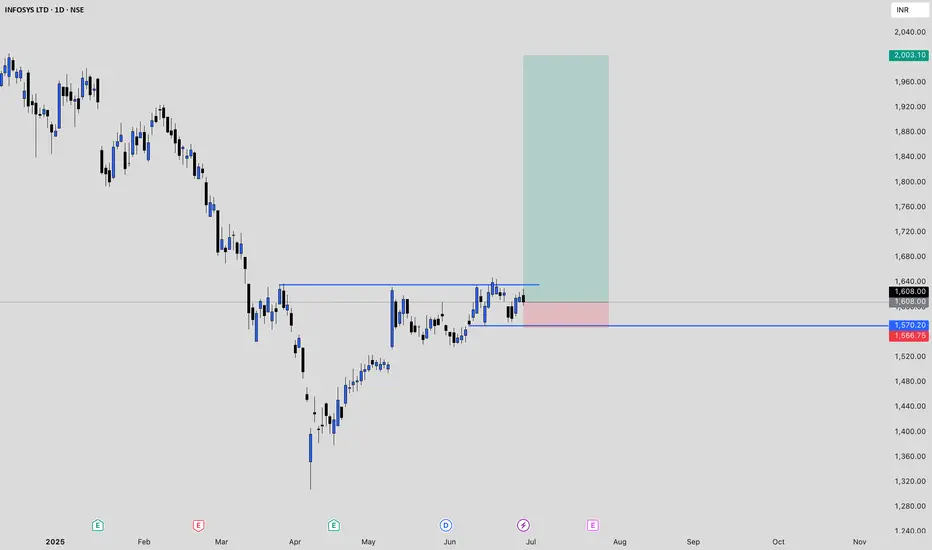
Infy Price actionInfosys (INFY) is currently trading around ₹1,608, with recent fluctuations between ₹1,606 and ₹1,629. Over the past year, the stock has delivered modest gains, slightly underperforming broader market indices and the IT sector. Financially, Infosys remains robust, maintaining strong revenues, healthy profit margins, and a debt-free balance sheet. The company continues to reward shareholders with consistent dividends, including a recent payout of ₹22 per share.
Looking ahead, growth expectations for Infosys are muted. The company has projected revenue growth of just 0–3% for the upcoming fiscal year, citing macroeconomic uncertainties and cautious client spending in its key markets. This represents one of the lowest growth forecasts for Infosys in over a decade and reflects broader industry headwinds, including delayed client decision-making and a focus on cost optimization.
Analyst sentiment is generally positive but cautious, with most maintaining a buy or hold rating. Price forecasts for the next year range from ₹1,667 to ₹1,945, indicating limited upside from current levels. Technical analysis shows immediate support near ₹1,579 and resistance around ₹1,633, suggesting the stock is likely to remain range-bound in the near term.
In summary, Infosys is financially sound and offers stable dividends, but near-term growth is expected to be subdued due to global economic challenges and restrained client budgets. The stock is more attractive for investors seeking stability and income rather than aggressive capital appreciation at this stage.
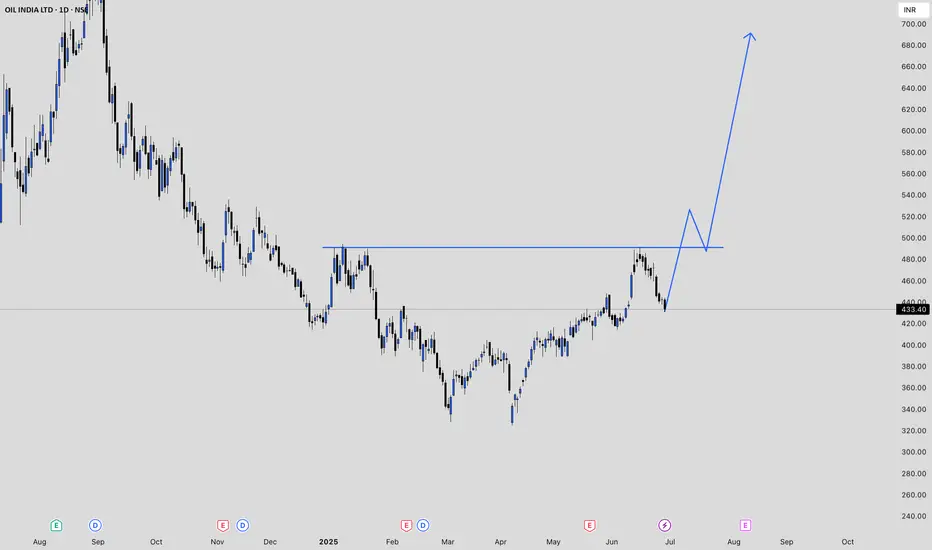
OIL Price ActionOil India Limited is currently trading at ₹433.40 as of June 27, 2025. The stock has seen a notable decline over the past week, falling by nearly 7%. Over the last month, the price has remained relatively flat, with a slight gain of about 0.5%. Looking at a broader time frame, the stock is up 12% over the past three months and has gained just under 2% in the last six months.
The 52-week high for Oil India stands at ₹767.90, while the low is ₹325.00, indicating that the stock is trading well below its peak for the year. Recent sessions have shown increased volatility, with sharp movements both up and down. For example, the stock dropped over 5% in a single day on June 24, after previously rallying above ₹470 earlier in the month.
Oil India’s price-to-earnings (PE) ratio is 10.98, and the price-to-book (PB) ratio is 1.32, suggesting the stock is reasonably valued compared to its historical averages and sector peers. The company maintains a market capitalization of around ₹70,500 crore, ranking it among the larger players in India’s gas and petroleum sector.
In summary, Oil India Limited is currently in a correction phase after a strong run-up earlier this year. The stock is trading closer to its recent lows than its highs, with moderate valuation metrics and ongoing volatility. Investors should watch for further price stabilization before considering new positions.
KEC Price ActionKEC International’s share price as of June 6, 2025, is around ₹889.25, reflecting a 2.16% increase from the previous close. Over the past month, the stock has surged by 28.8%, and it is up 6.83% in the last week, showing strong short-term momentum. However, over the last six months, the stock is down by 26.85%, indicating significant volatility in the medium term .
The company is currently trading at a price-to-earnings (P/E) ratio of 40.6 and a price-to-book (P/B) ratio of 4.33, both of which are considered high compared to the sector average P/E of 28.9. This suggests that the stock is priced at a premium relative to its peers . The dividend yield stands at 0.63% .
KEC International recently secured new orders worth ₹2,211 crore across various segments, including Transmission & Distribution, Oil & Gas Pipelines, and Cables. This has contributed to a 40% year-to-date growth in orders and strengthened its international order book. As a result, analysts maintain a ‘Buy’ rating, with target prices ranging from ₹911 to ₹998, and some suggesting a potential 10% upside from current levels .
Financially, the company’s trailing twelve-month earnings per share (EPS) has grown by 58.95% year-on-year, and the company has a market capitalization of about ₹23,295 crore . The stock hit its 52-week high at ₹1,313.25 and its 52-week low at ₹627.45, highlighting its volatility over the past year .
In summary, KEC International is showing positive short-term momentum, backed by strong order inflows and optimistic analyst ratings. However, its high valuation multiples and recent volatility suggest that investors should approach with some caution, balancing growth prospects against the premium pricing and market fluctuations .

Sobha Ltd's Price AnalysisSobha Ltd's share price as of late May 2025 is trading in the range of ₹1,349.60 to ₹1,386.10, with recent sessions showing minor fluctuations and a slight upward move from the previous close. Over the past year, the stock has declined by nearly 29%, though its longer-term performance remains strong, with a five-year return exceeding 600% .
From a valuation perspective, Sobha is trading at a high price-to-earnings (P/E) ratio of about 225–241, which is significantly above the industry average and suggests the stock is priced for substantial future growth or that current earnings are relatively low. Its price-to-book (P/B) ratio is also elevated, at around 4.25–5.85 times, indicating a premium to its book value. The intrinsic value estimate is much lower than the current market price, at approximately ₹538.36, suggesting the stock is overvalued by fundamental metrics .
Analyst sentiment remains largely positive, with about 76% of analysts recommending a buy and an average target price of ₹1,580.88, indicating a potential upside of around 15% from current levels. The highest analyst target is ₹2,459, while the lowest is ₹1,150, reflecting a wide range of expectations .
Recent financial trends show revenue growth over the last three quarters, with net profit margins improving but still modest. Mutual fund holdings have slightly increased, and promoter holdings remain stable, both of which are generally positive indicators. However, the company has a low interest coverage ratio and has delivered poor sales growth over the past five years, signaling some underlying financial risks .
Technically, the stock has shown short-term bearish signals, with a recent moving average crossover historically leading to declines in the following week. Despite this, the long-term outlook from analysts remains constructive, and historical data shows that Sobha has often delivered positive returns in May, with an average change of 6.85% for the month over 17 years .
In summary, Sobha Ltd's stock is currently trading at a premium, with high valuations and mixed short-term signals, but it remains favored by analysts for its long-term growth potential. Investors should weigh the optimistic forecasts against the elevated risk implied by current valuations and recent negative momentum.

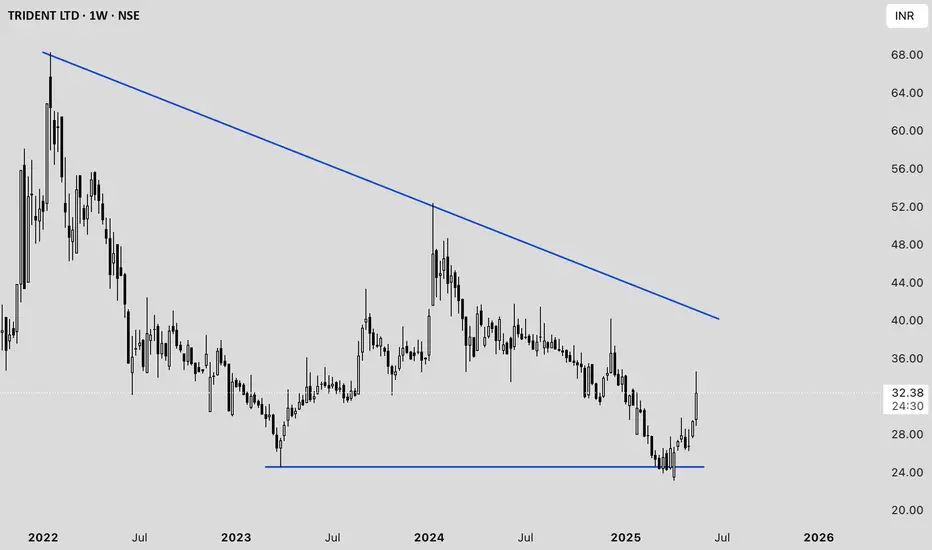
Trident Ltd. Price Analysis (as of May 23, 2025)#### **Current Price and Recent Movement**
- **Latest Price:** ₹32.11 (down 2.32% from the previous close) .
- **1-Week Return:** +9.29%
- **1-Month Return:** +9.11%
- **1-Year Return:** -15.39%
- **3-Year Return:** -32.89%
#### **Technical Analysis**
- **Buy Signal:** A 200-day moving average crossover occurred on May 21, 2025. Historically, this signal has led to an average gain of 6.61% within 30 days .
- **Momentum Indicators:**
- **RSI:** 62.17 (shows moderate bullish momentum)
- **MACD:** 0.535 (bullish signal)
- **Stochastic:** 75.40 (approaching overbought zone)
- **Supertrend:** 26.03 (bullish)
- **ROC:** 10.87 (positive momentum)
- **Analyst Sentiment:** 100% of analysts currently recommend a "Buy" with an average target price of ₹38, indicating a potential upside of ~15.6% .
#### **Fundamental Overview**
- **P/E Ratio:** 44.50–45.65 (well below the industry average of 126.09, but still high relative to earnings growth)
- **Price-to-Book Ratio:** 3.62–3.88
- **Dividend:** Announced ₹0.5 per share (record date: May 27, 2025) .
- **Net Profit Margin:** 5.78% (FY24)
- **Return on Equity:** 9.04% (FY24)
- **Debt/Equity:** 0.48 (moderate leverage)
- **Intrinsic Value Estimate:** ₹9.73 (suggests current price is at a premium to intrinsic value)
#### **Recent Financial Performance**
- **Q3 FY25 Revenue:** ₹1,667.09 crore (down 9.17% YoY)
- **Profitability:** Net profit/share for FY24 was ₹0.76, down from ₹0.83 in FY23
- **Expense Management:** Interest expense is low at 1.86% of operating revenue; employee cost is 13.2%
#### **Strengths**
- Strong technical momentum and recent bullish crossover.
- Consistent dividend payout.
- Low interest expense and moderate leverage.
#### **Weaknesses**
- Declining revenue and profit over the last few quarters.
- High valuation relative to earnings and intrinsic value.
- Long-term returns have been negative over 1 and 3 years.
#### **Outlook**
Analysts remain bullish in the short term, buoyed by technical signals and an expected price target of ₹38 . However, fundamental concerns such as declining profits, high P/E, and premium to intrinsic value warrant caution for long-term investors.
---
**Summary:**
Trident Ltd. is showing short-term bullish momentum with positive technical indicators and analyst sentiment. However, investors should be cautious due to weak long-term performance, high valuation, and recent declines in revenue and profit .
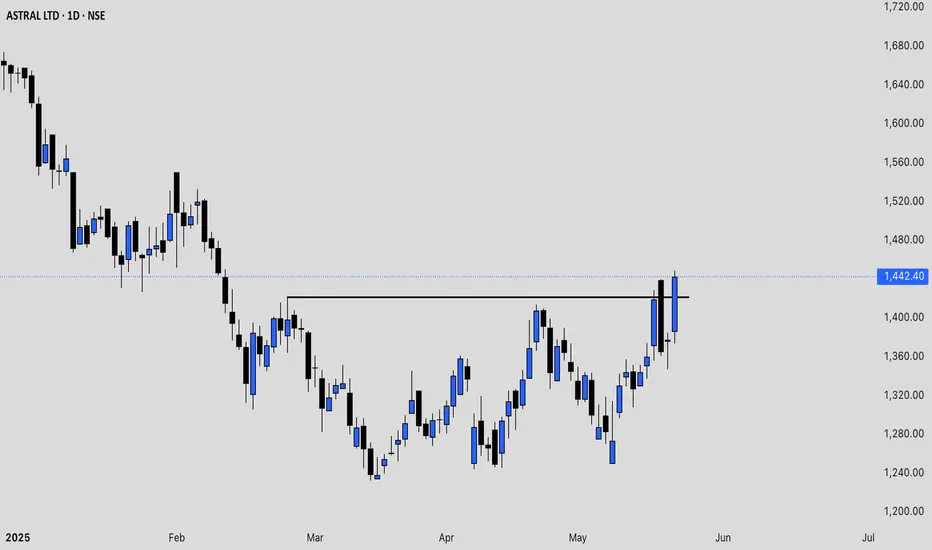
ASTRAL price action analysis Astral Ltd (ASTRAL) has shown a mix of volatility and recovery in May 2025. After a sharp decline earlier in the month, the stock rebounded, with recent prices moving from the ₹1,330–₹1,350 range up to ₹1,377.70 as of May 21, 2025. The trading volumes have remained strong, indicating active participation from both buyers and sellers.
Technically, Astral is trading above its short-term volume-weighted average price (VWAP) of around ₹1,362.9, which is a positive sign for near-term momentum . The price action over the past week has included both sharp drops and quick recoveries, suggesting a tug-of-war between bulls and bears. Oscillators and moving averages currently indicate a neutral to mildly bullish setup, with the stock having recovered from oversold levels seen earlier in May.
Astral’s 52-week high is ₹2,454, and the 52-week low is ₹1,232, showing that the current price is closer to the lower end of its yearly range . The price-to-earnings (P/E) ratio remains high (around 70), and the price-to-book (P/B) ratio is also elevated, reflecting premium valuations . The company’s fundamentals remain strong, but the high valuation and recent volatility suggest that further upside may require continued earnings growth or positive sector developments.
In summary, Astral is currently in a recovery phase after recent volatility. The technical outlook is neutral to slightly positive as long as the stock holds above the VWAP and key short-term support levels. Investors should watch for sustained moves above ₹1,380–₹1,400 for confirmation of renewed bullish momentum, while a drop below ₹1,350 could signal renewed weakness.
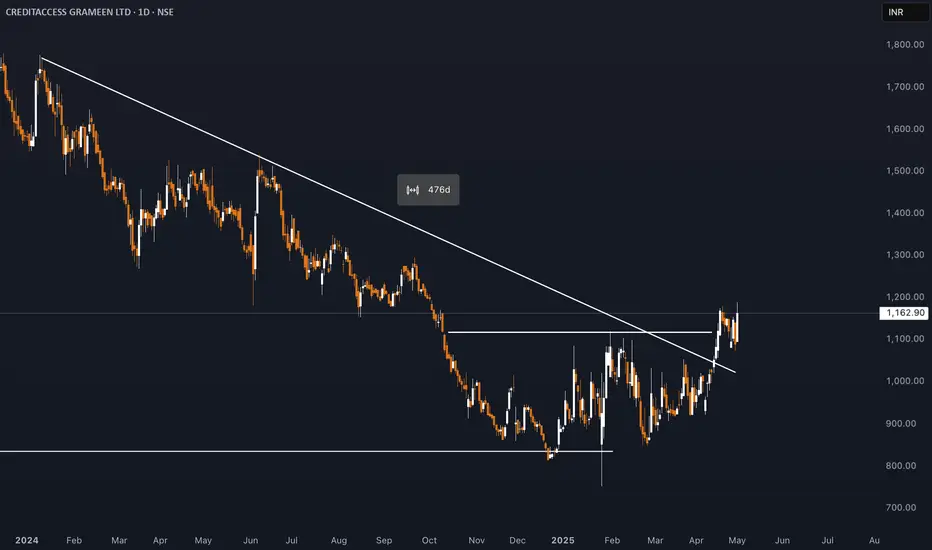
## CreditAccess Grameen (CREDITACC) Share Price Analysis- As of May 2, 2025, CreditAccess Grameen (CREDITACC) traded around ₹1,121–₹1,145, which is approximately 52% above its 52-week low of ₹750.20 (set in January 2025), but below its 52-week high of ₹1,551.95 (set in June 2024) .
- The stock has shown volatility over the past year, with a notable decline from its peak, reflecting both sector trends and company-specific events .
**Valuation and Financial Metrics**
- **P/E Ratio (TTM):** 20.3–21.2, indicating moderate valuation relative to earnings .
- **Book Value:** ₹438 per share, with the stock trading at about 2.6 times book value, which is considered on the higher side for the sector .
- **Dividend Yield:** Around 0.86–0.89%, with recent dividend payouts .
- **Return on Equity (ROE):** 24.8% (latest year), reflecting strong profitability .
- **Return on Capital Employed (ROCE):** 14.8% .
**Growth and Profitability**
- The company has delivered robust profit growth (35% CAGR over the last 5 years) and strong median sales growth (31.6% over 10 years)
- However, profit growth has turned negative in the trailing twelve months (-35%), primarily due to higher provisioning and write-offs in recent quarters
- The company reported a loss of ₹99.5 crore in Q3 FY25, mainly due to early risk recognition, conservative provisioning, and accelerated write-offs, but management expects this to safeguard future profitability as growth normalizes
**Operational Highlights**
- **Assets Under Management (AUM):** Grew by 6.1% YoY to ₹24,810 crore in Q3 FY25
- **Borrower Base:** Increased by 2.4% YoY to 48.05 lakh customers
- **Branch Network:** Expanded by 8.7% YoY to 2,059 branches
- **Collection Efficiency:** Remained robust at 93.3% (excluding arrears) and 94.1% (including arrears), with improving trends
- **Asset Quality:** PAR 90+ at 2.64%, NNPA at 1.28%, indicating some stress but manageable levels
- **Capital Adequacy:** CRAR at 25.9%, reflecting a strong capital position
**Strengths and Risks**
**Strengths:**
- Consistent long-term growth in profits and sales
- Strong capital position and liquidity buffer
- High collection efficiency and expanding branch network
**Risks/Concerns:**
- Recent decline in promoter holding (-7.42% over three years)
- Low interest coverage ratio, suggesting higher financial risk
- Elevated provisioning and write-offs impacting near-term profitability
- Stock is trading at a premium to book value, which may limit upside if growth slows
**Relative Performance**
- Over the past year, the stock is down 24%, underperforming the broader market, but over five years, it has delivered a 154% return, broadly in line with sector peers
- In the short term (last three months), the stock has rebounded by about 13% from its lows
## Summary
CreditAccess Grameen remains a leading NBFC-MFI with a strong track record of growth and profitability. While recent quarters have seen a dip in profits due to prudent risk management and provisioning, the company’s fundamentals-such as robust capital adequacy, liquidity, and operational scale-remain intact. The stock is moderately valued but carries risks related to asset quality and sector volatility. Investors should watch for normalization of growth and profitability in upcoming quarters, as indicated by management
ERIS Lifesciences Share Price AnalysisEris Lifesciences is currently trading in the range of ₹1,371 to ₹1,474, with the latest reported price at ₹1,474.20 as of April 23, 2025. The stock has shown strong performance over the past year, delivering a return of approximately 57%. Over the last three months, the stock is up about 9%, though it has seen a slight dip of 0.57% in the past month.
**Valuation and Fundamentals**
Eris Lifesciences trades at a price-to-earnings (P/E) ratio of 57.13, which is high for the sector, and a price-to-book (P/B) ratio of 4.53. The company’s earnings per share (EPS) stands at 29.19, and its return on equity (ROE) is 12.63%, indicating moderate profitability. The market capitalization is approximately ₹18,831 crore . The dividend yield is negligible, suggesting the company focuses more on growth than on returning cash to shareholders.
**Analyst Sentiment and Targets**
Analyst sentiment is strongly positive, with nearly 89% recommending a buy and the remainder suggesting hold; there are no sell recommendations. The average long-term price target from analysts is ₹1,512.56, indicating modest upside from current levels.
**Technical and Trading Overview**
The stock has recently traded near its upper circuit of ₹1,659.60, with a lower circuit at ₹1,106.40, reflecting a relatively wide trading band and potential for volatility. Recent trading volumes have been healthy, supporting the current price momentum.
**Summary**
Eris Lifesciences has delivered strong returns over the past year and is viewed positively by analysts. However, its high P/E ratio suggests the stock is priced for continued growth, and the lack of dividend yield may not appeal to income-focused investors. The technical outlook is stable, with the stock trading near its highs and supported by robust trading activity.
