The uptrend is being tested at the resistance of 3,305 USDAfter a strong recovery from the bottom around 3,140 USD, the world gold price is touching the important resistance zone at 3,305 USD/ounce in the trading session on May 21. On the 4H chart, the short-term uptrend is reinforced when the price breaks above the EMA 34 and EMA 89, creating a golden cross pattern - a sign that often signals the continuation of the uptrend.
However, the 3,305–3,325 area is currently acting as a short-term resistance - where many reversals have been recorded in the past. The price is showing signs of slowing down when approaching this area, with small candles and narrow bodies, indicating that buying power is temporarily slowing down.
If gold breaks and closes clearly above 3,325, the price will likely continue to move towards 3,375 and further to 3,400 USD. On the contrary, if the price fails to break above the current resistance zone and reverses, the support zone to watch is the confluence between EMA34 and EMA89 around 3,250–3,260.
With market sentiment still dominated by geopolitical factors and US credit risks, gold continues to maintain its safe-haven role. However, investors should monitor the price reaction at the 3,305 area to confirm the next momentum – whether it is a breakout or a technical correction.
Buy!!

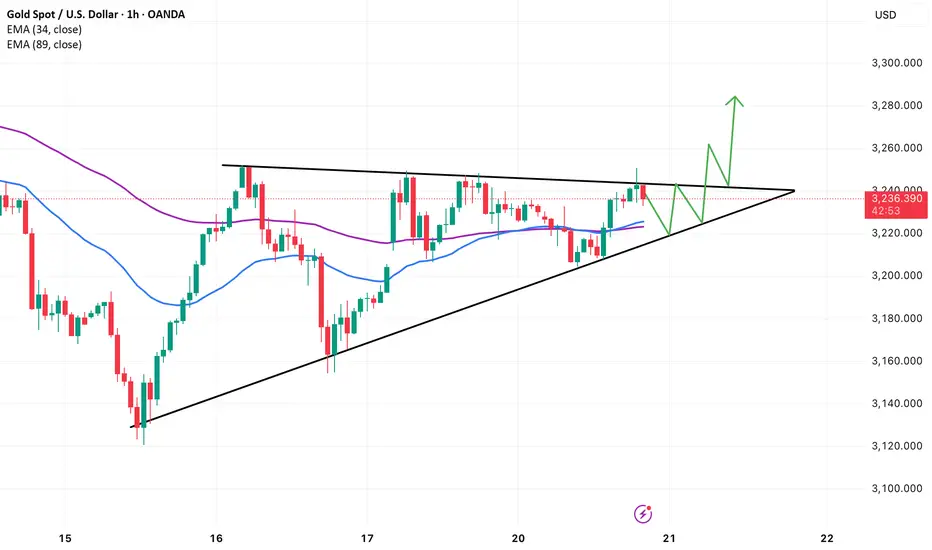
Gold breaks out of triangle patternThe world gold price has increased to 3,222 USD/ounce, continuing the strong recovery thanks to supportive factors from safe-haven sentiment. Moody's downgrade of the US long-term credit rating has fueled concerns about financial risks, while trade tensions due to the US Treasury Secretary's statement have further strengthened gold's position as a safe haven.
On the 1H chart, the price has just broken out of the ascending symmetrical triangle pattern - a technical structure that often signals the continuation of an uptrend. The breakout zone around 3,235 is currently acting as support. As long as the price holds above this zone, the possibility of gold continuing to move towards the target of 3,270–3,280 is quite high. In particular, the EMA34 and EMA89 lines are converging and preparing to create a short-term bullish crossover.
However, investors should note that if the price reverses and breaks through the bottom of the triangle (below 3,220), the bullish pattern will be negated, and the possibility of a bearish reversal will return. With the geopolitical and economic context still having many uncertainties, gold is holding the upper hand but still needs solid confirmation from price action after the breakout.
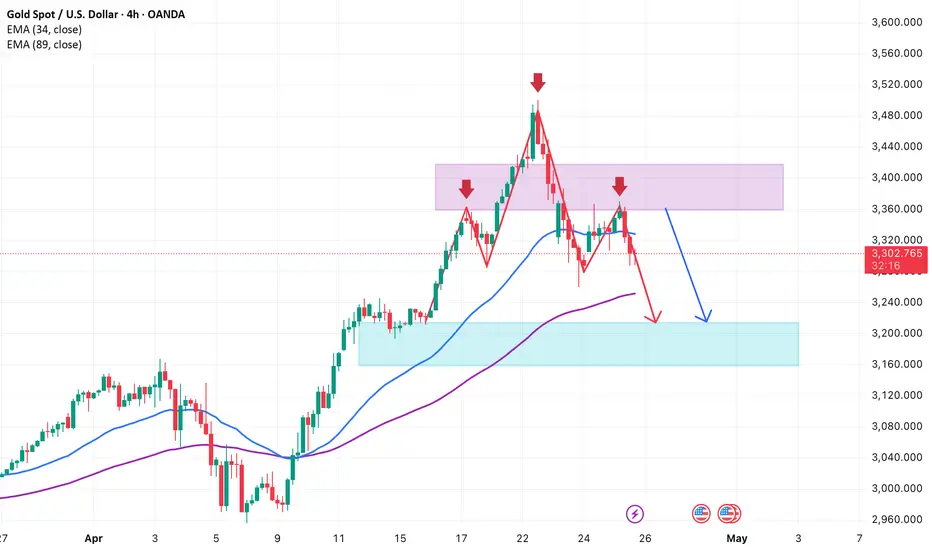
Beware of short-term bull trapsOn the H4 chart, gold is testing an important resistance zone around EMA89 (purple) after a rebound from the bottom of 3,120. However, both EMA34 and EMA89 are sloping down, indicating that the short-term trend is still bearish. The current rebound is not strong enough to confirm a reversal.
The most recent candle also has a long upper shadow, indicating that selling pressure is waiting above. If the price is rejected at the 3,250–3,260 zone and turns around to break down to 3,220, there is a high possibility that gold will retest the old bottom around 3,120.
The strategy at this time is to stay out or wait to sell lightly if a clear reversal signal appears near the resistance zone. Avoid FOMO because the rebound has not been confirmed by volume or trend structure.

Gold breaks EMA34 – Trend is weakeningOn the D1 chart, gold has just closed below EMA34 for the first time since February. Although the price bounced back slightly from the 3,120 area today, I see that the recovery force is still weak and not enough to reverse the trend. EMA34 has started to curve down, warning that the medium-term uptrend is weakening.
If the next few sessions cannot surpass 3,240, I am inclined to the scenario that the price will continue to fall to EMA89 around 3,050–3,070. I will temporarily stay out of this area, waiting for a clearer signal before deciding to follow the buying or selling side.

Gold Loses 3,220 – Will It Fall Further?Gold has just broken through the 3,220 support and closed the H4 candle at $3,213/ounce. The strong red candle with volume shows that the sellers are still in control. I saw the EMA34 cut down to the EMA89 early and maintained a negative slope – confirming a clear downtrend.
I am watching the 3,180 – 3,200 zone as the next target. If the price rebounds but does not surpass 3,240, I will continue to sell. The current situation is not suitable for buying against the trend, especially when the USD is still strong and the safe-haven sentiment is decreasing.

Gold breaks through 3,300 – Selling pressure has not stoppedGold price plummeted from 3,325 to 3,237 USD/ounce after the US and China reached a temporary agreement to reduce taxes. The stock market is up, the USD is strong, money flows out of gold. I see selling pressure clearly dominating.
On H1, the price is still below EMA34 and EMA89, recovering weakly around 3,260. H4 confirms the downtrend that has been formed before. If it does not surpass 3,270, I am inclined to believe that gold will continue to fall to 3,200 – 3,180.

Gold Under Pressure: Will Key Support Hold?Gold prices slipped slightly to around $3,230 in early trading today. The precious metal remains on the defensive due to a stronger U.S. dollar, rising U.S. bond yields, and renewed optimism surrounding the U.S.–China trade deal.
As long as this optimism continues, XAU/USD is likely to remain under pressure. The recent surge to record highs was driven by concerns over a global economic slowdown and rising inflationary pressures due to tariffs — but that rally quickly faded, failing to hold its peak.
From a technical perspective, the 4H chart shows that gold has dropped below the EMA 34 and EMA 89, with a clear confluence between the EMAs and a marked resistance zone, which also aligns with the 0.618 Fibonacci retracement level.
If price fails to break above this resistance with strong momentum, the downtrend could continue, leading to deeper corrections in the near term.

Gold Breaks Support Level – The Downtrend May Not StopAfter peaking at $3,500/ounce in April, gold is in a clear correction phase. On the H4 chart, the price has broken through both the EMA34 and EMA89, indicating that a short-term downtrend has been established. The most recent session closed at $3,223, losing nearly $130 in just a few sessions.
The sharp decline appeared after a long rally and the peak was rejected many times. The break through the EMA89 support has triggered technical selling pressure, reflecting the psychology of profit-taking after failing to surpass the old peak.

Gold falls after FED news, cautious buying powerWorld gold prices retreated to $3,370/ounce, down more than $25 from last night's peak. The H4 chart shows a sharp decline that broke through the EMA34, currently testing the EMA89 - a signal that profit-taking pressure is increasing after the previous strong bounce.
The FED kept interest rates unchanged in the 4.25% - 4.5% range, as expected. However, Chairman Jerome Powell's "wait and see" statement made investors pause buying gold due to concerns that prolonged high interest rates will continue to put pressure on non-yielding assets like gold. In addition, the rise in international stocks and China's money pumping policy have reduced the attractiveness of this safe haven.

Gold surges thanks to China buying goods, waiting for FED waveInternational gold prices jumped to 3,332 USD/ounce, up more than 72 USD compared to the bottom of last night's session. The main driving force came from the wave of gold buying in China, when concerns about the weakening economy caused people to massively turn to gold as a safe haven. The H4 chart shows a strong increase, EMA34 has crossed EMA89, establishing a clear short-term uptrend. If gold surpasses 3,340 USD, it is likely to head towards the old peak around 3,420–3,500 USD.
Crude oil prices are still fluctuating strongly around 57.2 USD/barrel, creating an unstable foundation for the commodity market. The FED will announce its policy in the early morning of May 8. Although it is expected to not change interest rates, any statement can move the market. This will be the next big catalyst for gold.

Gold price suddenly accelerates, approaching the 3,300 USD/ounceAfter two consecutive weeks of decline, the world gold price is showing strong signs of recovery when it skyrocketed to 3,266 USD/ounce - an increase of 25 USD in just one session. Although still quite far from the peak of 3,500 USD/ounce, the increase this morning shows that investor sentiment has begun to change direction.
The increase occurred at the beginning of the session despite previous negative forecasts, reflecting the sensitivity of gold to geopolitical and economic information such as US-China trade negotiations or the strength of the USD. The daily chart shows that gold has bounced strongly from the EMA34 support zone and returned to the resistance zone around 3,320–3,340 USD, opening up an opportunity to retest the 3,400 USD mark if the current increase is maintained.

Gold recovers after deep fallWorld gold prices recovered to 3,238 USD/ounce on the morning of May 2 after hitting a bottom of 3,205 USD/ounce last night. The reason came from the sell-off when the Chinese market was on a long holiday, causing a lack of physical buying power.
However, investors quickly took advantage of this opportunity to buy, amid expectations that the FED would lower interest rates and central banks would continue to collect gold as a safe haven asset. The 4-hour chart shows that the price has bounced back from EMA89, heading towards the EMA34 resistance zone - a positive sign for a short-term recovery.

Gold continues to lose value, pressured by USD and China dataWorld gold prices fell to $3,279/ounce, down $31 from the previous session's peak. The USD increased slightly along with the decline of crude oil and US stocks, making gold less attractive.
In addition, weak economic data from China raised concerns about falling physical gold demand - contributing to the price decline. On the daily chart, gold is falling from the peak, approaching the EMA34, warning of the risk of a deeper correction if it fails to hold this support level.

Gold weakens under pressure from USD and bonds
On the morning of April 30, the world gold price fell to 3,318 USD/ounce, down 20 USD compared to the same time the previous day. The strong increase in USD and high US bond yields at 4.23% made gold lose its appeal in the eyes of investors.
The recovery of US stocks and the decline in oil prices further depressed market sentiment. On the H4 chart, gold has not yet escaped the sideways zone around EMA34 - a sign that buying power is weakening.

Gold forms a top patternOn the H4 chart, the gold price chart is forming a clear bearish structure after forming a three-peak pattern in a row around the $3,435–$3,470 range. Each time the price touches this range, it is strongly rejected, indicating that selling pressure controls the market. The fact that the price cannot maintain above the EMA34 and EMA9 at the same time is also a sign of confirmation of a weakening trend in the short term.
Although gold recovered slightly to the $3,365 range in the Asian session on April 25 thanks to news of PBOC money injection and a weakening USD, the buying pressure was not enough to break the bearish structure. The price quickly reversed and fell below the $3,300 mark, confirming the possibility of further correction in the near future.
Currently, the price has cut below the two EMAs and broken the nearest bottom at $3,290, triggering a bearish signal according to the “small head and shoulders” pattern on the H4. The next target is the strong support zone of $3,180–$3,220. If this zone is broken, the correction trend may extend deeper to the $3,100 area.
The appropriate short-term strategy at this time is to wait for the price to retrace to the $3,310–$3,330 area, cut losses above $3,350 and take profits around $3,200. The bullish scenario will only happen if the price breaks above $3,370 and closes above the old resistance – then the bearish structure will be broken.
Gold falls below $3,300International gold prices are currently trading around $3,290/ounce, down $40 from last week and far from the record high of $3,500. The bearish structure still prevails as gold is below the EMA34 and EMA89, while failing many times to regain the $3,300 mark.
Strong profit-taking pressure, a recovering USD and rising bond yields are dragging gold prices down, despite the previous optimistic expectations from the Kitco survey. If gold continues to weaken below $3,300, it could head towards $3,250, deeper into the $3,200–$3,220 range. Conversely, only when it surpasses $3,320 will the downtrend be challenged.
Short-term strategy: Prioritize selling when gold recovers weakly.

Gold Under Pressure: Waiting for the Next Big MoveEarlier today, gold wrapped up the week around $3,320/ounce, falling about $53 from the previous night's peak at $3,373. This drop feels like a natural reaction as market flows begin to shift direction.
The main driver behind the pullback was a stronger U.S. dollar, fueled by easing concerns over the global economy. At the same time, rising U.S. bond yields made non-yielding assets like gold less attractive to investors.
Additionally, progress in U.S. trade talks with other nations further reduced the immediate demand for safe-haven assets like gold.
That said, I believe the market is now in a "holding pattern," awaiting key U.S. economic data — especially the upcoming inflation report from the Fed. If the numbers confirm economic stability, gold may face additional short-term selling pressure.
Bottom line: This is a time to trade cautiously. Focus on how gold reacts around major support zones and adjust strategies based on fresh economic data.
Wishing everyone safe and successful trading!

Gold Rebounds Sharply After Steep DropAfter plunging $91 to close at $3,288 in yesterday’s session, gold staged an impressive comeback this morning, surging over 700 pips to reach the $3,360 area.
This sharp price swing was largely driven by a mix of news catalysts. U.S. President Donald Trump stated he has no plans to remove Fed Chair Jerome Powell, but called for more aggressive rate cuts—boosting the U.S. dollar and putting short-term pressure on gold.
At the same time, the IMF released its latest global outlook, projecting elevated inflation through 2026. This raised expectations for prolonged monetary tightening from central banks, capping gold’s upside potential. Additionally, a wave of profit-taking after gold's recent rally added to the downward correction.

GBP/USD Rebounds as Tariff Fears EaseThe GBP/USD pair climbed to around 1.3270 on Thursday, snapping a two-day losing streak. The recent softening in concerns over potential tariff threats from U.S. President Donald Trump triggered some selling pressure on the U.S. dollar, offering a short-term lift for the pound. The move suggests a possible shift in sentiment as traders reassess the immediate risks in the global trade landscape.

EUR/USD Holding Key Support – Eyes Set on 1.1555?Today, EUR/USD remains steady around the 1.1280–1.1300 support zone after a mild pullback. This area aligns with the EMA89 and an ascending trendline, suggesting that the risk of a deeper decline is limited for now.
✅ Key news: The USD is under pressure as markets expect the Fed to keep rates unchanged or pivot toward a more dovish stance. This supports the euro and helps maintain the pair’s upward momentum.
As long as the price holds above this support, a move back toward 1.1420 – 1.1555 remains very much on the table.

Gold Slides on Trump Remarks — But Trading Opportunities RemainGold (XAU/USD) fell over 1% in early Asian trading on Wednesday, currently hovering around $3,333. The drop came after U.S. President Donald Trump clarified that he has no intention of firing Federal Reserve Chairman Jerome Powell.
Trump stated, "The media tends to exaggerate things. No, I’m not planning to fire him. I just want to see him take a more active stance in cutting interest rates." This comment signaled reduced pressure on the Fed, which weakened gold's safe-haven appeal for the short term.
Gold also showed signs of pullback due to developments around Russia-Ukraine peace talks and U.S.-China tariff negotiations. While the long-term bullish trend has paused, the current dip presents new trading setups worth considering.
💡 Suggested Trade Ideas:
SELL XAU/USD:
Zone: 3432–3435
🎯 Take Profit: 3405 / 50–300 pips
🛑 Stop Loss: 3440
BUY XAU/USD:
Zone: 3286–3283
🎯 Take Profit: 3323 / 50–400 pips
🛑 Stop Loss: 3278
Stay calm, read the price action, and make your move when the market enters key zones.
Happy trading and good luck out there! 💰

Gold May Be Entering a New Era — Are You Ready?Last week, gold extended its historic rally once again. As trade tensions between the U.S. and China escalated and the Fed signaled a possible policy shift, the yellow metal regained strong momentum, pushing to new highs around $3,380, gaining over 500 pips from the week’s opening.
What’s most notable is that despite these record levels, market sentiment remains clearly optimistic — and in my view, that optimism is well-founded.
We’re seeing capital flow into gold from all directions: speculators, institutional funds, and even central banks. In today’s uncertain climate, gold isn’t just an option — it’s the market’s natural reaction to instability.
This isn’t only about tariffs or geopolitics. What truly fuels the move is the Fed’s increasingly dovish tone. And every time monetary policy softens, gold steps back into the spotlight as a defensive anchor.
Unless we see a major surprise — such as a sudden trade resolution or a sharp policy pivot — there’s little reason to expect the uptrend to end here. In fact, any short-term correction could serve as a healthier entry point rather than a reversal signal.
So the real question right now isn’t “Has gold gone too far?”
It’s: “Are we ready for a much longer bullish cycle?”

Gold Holds Steady — Is Another Rally Brewing?Gold prices are holding firm above the key zone around $3,330/oz, showing resilience despite the market slowing down for the Easter holiday. While price action is currently sideways, the bullish momentum hasn't faded.
Ongoing geopolitical tensions, economic uncertainty, and U.S. trade policy shifts continue to fuel safe-haven demand for gold. For now, resistance stands near $3,353, with a solid support base forming around $3,300.
After a strong rally, gold may enter a brief phase of consolidation before building fresh momentum. The ideal approach? Watch for pullbacks to key areas like the EMA 34 or support zones — or wait for a clean breakout above resistance to jump in once the market regains full liquidity.
Stick with the trend, traders — and don’t forget to secure your trades with proper TP and SL. Stay sharp!
