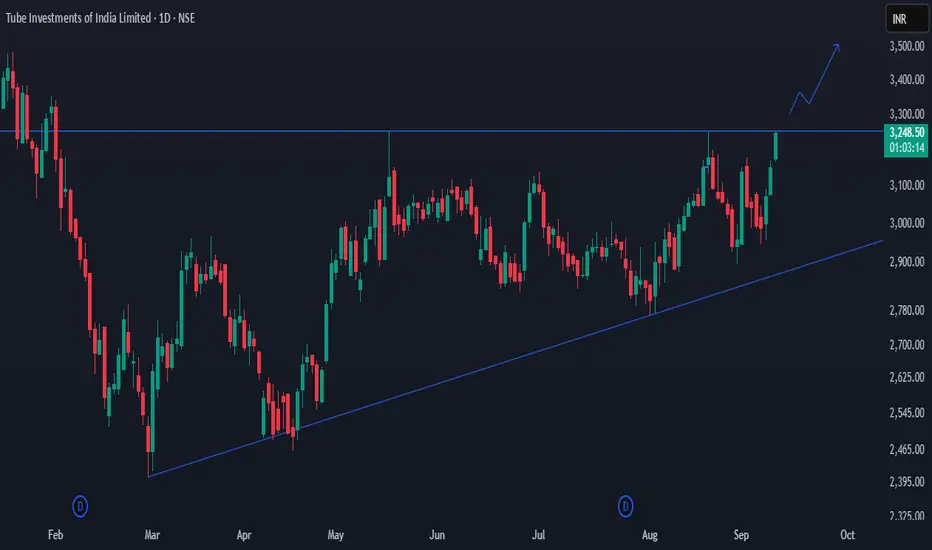
Breakout ready stock - TIINDIATube Investments of India is pressing against a flat resistance near 3,250–3,270 while making higher lows since March–April, forming a classic ascending triangle; a strong daily close above 3,270–3,300 with good volume would confirm the breakout, after which a conservative upside looks toward 3,450–3,500, then 3,800–3,850, and a full measured move can stretch to 3,950–4,000, whereas on the downside a healthy retest can dip to 3,150–3,170, with the pattern staying valid as long as the rising trendline/3,030 area holds and turning weak only on a decisive break below 2,900.
Buyingopportunity
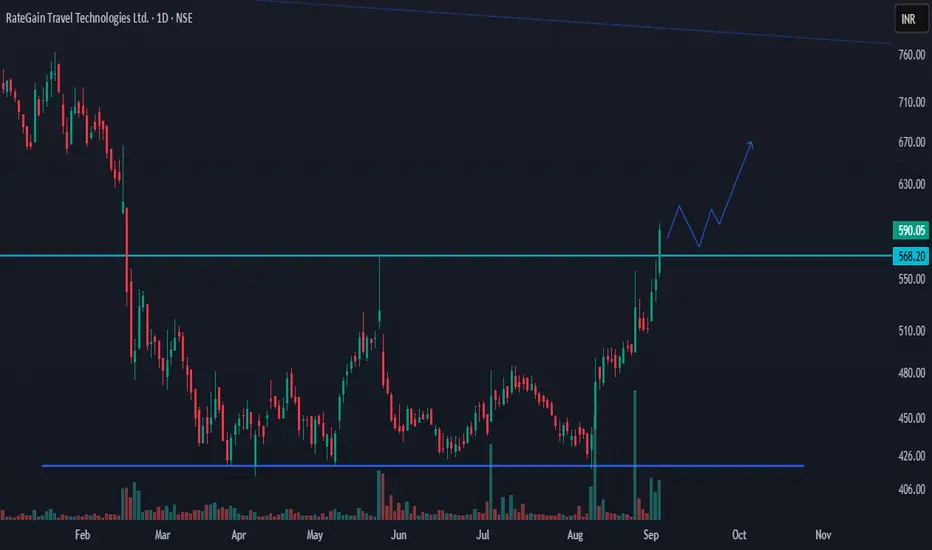
Breakout on daily chart - Holding TradeRATEGAIN is shaping up so nicely.
The stock built a base around 430–445 and has now moved back above the 568–570 zone, which turns into support if daily closes keep holding.
As long as price stays above 570, the next areas to watch are 645–660 and then 700-720, with a bigger hurdle near 800–810 from the old down‑trend line.
A healthy setup would be a dip toward 572–585 that shows buying strength; that gives a cleaner entry. Manage risk below 548 for a tight stop, or below 530 for a wider swing stop.
If the stock closes back under 570 and doesn’t quickly recover, treat it as a failed reclaim and wait. On the business side, the company has been posting double‑digit growth with improving margins from its AI‑driven travel‑tech products—so buying dips while 570 holds and higher lows keep forming makes sense.
YES BANK-liquidity grab before the big move📉 Short-Term: Head & Shoulders breakdown likely. Price may drop to take seller liquidity below ₹13.62–₹11.17.
📈 Long-Term: Strong reversal expected from ₹9.61–₹11.17 (Institutional Demand Zone) toward ₹30+.
🔹 Swing Trade Path (Blue): Weak buy → 50% retracement targets.
🔺 Investment Path (Red): Strong buy in reversal zone → ride to ₹31.18.
📍 Key Levels:
Support – ₹13.62, ₹11.17, ₹9.61
Resistance – ₹19.55, ₹23.72, ₹31.18
⚠️ Not Financial Advice – Trade wisely!

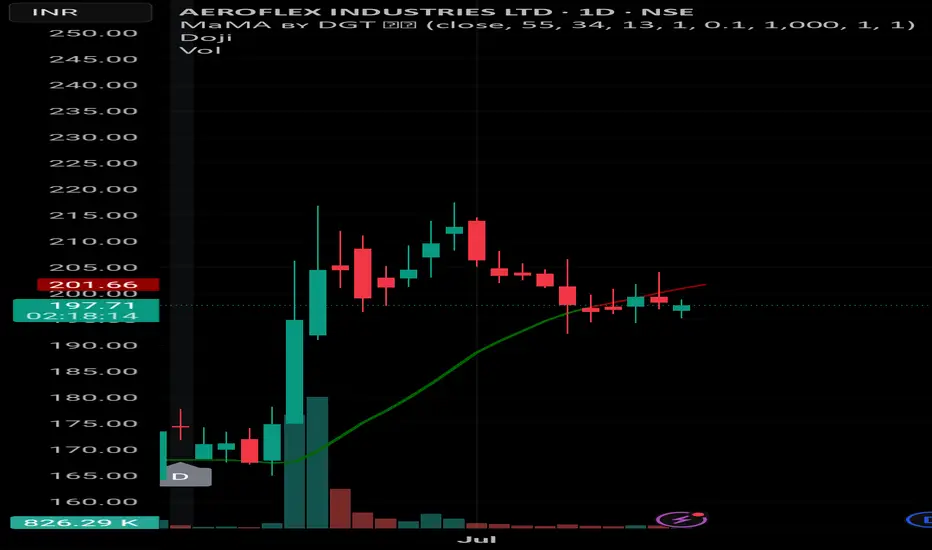
AEROFLEX INDUSTRIES LTD – Short-Term Swing Setup🟢 AEROFLEX INDUSTRIES LTD – Short-Term Swing Setup
📊 Chart: Daily (1D)
📍 CMP: ₹198.33
📅 Date: July 14, 2025
---
🔍 Technical View:
Price bounced after short correction, holding above 20 EMA.
Volume spike on prior breakout shows buyer interest.
UP signal printed again — showing short-term strength.
---
🎯 Trade Plan:
Entry Zone: ₹195–198
Target 1: ₹210
Target 2: ₹220 (partial profit booking suggested)
Stoploss: ₹191 (closing basis below 20 EMA)
📋 Action Plan:
✅ If price sustains above ₹200 with volume — hold for full target.
⚠️ If price hovers below ₹195 for too long — exit or re-evaluate.
❌ If closing below ₹191 — exit completely (setup invalidated).
🔁 Trail SL to ₹198 once ₹210 is hit, to lock partial profit.
⚠️ Disclaimer: This is purely educational and not investment advice. I am not a SEBI-registered advisor. Do your own analysis or consult a financial expert before trading.
A very good buying opportunity in pi network coin.PI coin is in a very good demand zone in daily time frame. Legout of the demand zone is very good. We can target 2.8 level in pi which is a supply zone. Trade has good risk to reward ratio of 1:4. Follow risk management

Butterfly Descending Triangle Breakout!Possible breakout near ~ 795, 800 levels. Short-Term Buy ~ 800, 810, With Stop ~ 750, For Target ~ 980. Time Frame - (Positional 10,15 day's))

Stock is Ready for BreakoutNMDC is near trend line breakout
A trend line formation on down side price correction in stock and now price trying to breakout this trend line
after breakout a good up side movement can be seen in stock
if stock retested that trend line after breakout then that will be a good entry point for fresh trade

SBIN - Bullish Flag Chart PatternState Bank of India is forming high tight bullish flag chart pattern.
Happy Diwali to all of you.

Tight Range Breakout | MFSLFor Education Purpose only!!!!
**MFSL stock is already up by 3%, but it’s holding up well in this falling market. I'm charting this stock just for my own perspective and clarity, though I may not be 100% accurate.**
FIIs are playing their old trick:
1️⃣ Push prices down 📉
2️⃣ Buy cheap stocks 💰
3️⃣ Wait for rate cuts 📊
4️⃣ Profit big in the next bull run! 🚀
Retail investors, don’t fall for the fear!
✅Stay invested—smart money knows a bull run is coming!
News has circulated about the index predicting a target of 24,000 for Nifty and 50,500 for Bank Nifty. The price has already been quoted in the reports.
⭕️ Swing Trading opportunity: Price Action Analysis Alert !!!⭕️
💡FNO Stocks Trading📉📈📊
✅Check out my TradingView profile to see how we analyze charts and execute trades.
💡✍️Applied Tools:-
✅Strong Chart Pattern Breakout
✅Channel Pattern
✅Range Breakout
✅Resistance becomes support
🙋♀️🙋♂️If you have any questions about this stock, feel free to reach out to me.
📍📌Thank you for exploring our idea! We hope you found it valuable.
🙏FLLOW for more !
👍LIKE if useful !
✍️COMMENT Below your view !

Trading setup for Tata Technology1. Lower Tops and Lower Bottoms: This pattern suggests that the stock was in a downtrend after its initial listing, with each high being lower than the previous high and each low being lower than the previous low.
2. Consolidation: Since July 2024, the stock has been consolidating at lower levels. This typically indicates a period of stabilization where the price is moving within a range, suggesting accumulation by investors. During this phase, the stock might not be making significant gains but is building a base.
3. Breakout: The stock has recently broken above the downtrend line with high volume. This breakout from a downtrend line, especially when accompanied by high volume, is often seen as a bullish signal. It suggests that buying interest is strong and the stock may be poised for an upward move.
4. Bullish Implications: The combination of consolidation at lower levels and a breakout with high volume can be interpreted as a positive signal. It indicates that the selling pressure has subsided and there could be potential for further gains if the bullish momentum continues.
Trade Setup:
Buy Entry: Consider buying the stock if it trades above ₹1040.
Stop-Loss (SL): Set your stop-loss at ₹980 to manage risk.
Target: The target is open-ended, meaning you expect the price to rise significantly, but you will need to monitor for potential exit points based on further analysis or changes in market conditions.
It’s always wise to stay updated with any fundamental changes or news that could impact the stock and adjust your strategy accordingly. Good luck with your trade!
***Disclaimer : This is my personal view, please trade after consultation with your financial advisor. I am neither a SEBI Register RA or RIA.
Regards
Arvind Kumar Yadav, Cfa
Arvind Share Academy

NMDC BULLISH AT SUPPORT.NMDC has came to its support area or say buying zone, Its has also made a bullish candle at its support. This shows Buying at the support.

All Cargo Terminals LTD 51.20, ATL - Stock to buy Stock is trading around its support level. if company gives good quarter one results we might see stock move upside.
its good buying opportunity. one can make 10 to 15 % profit in short period.
i prefer you buy on long term perspective for better return.

MAYURUNIQ - (14Y) Multi Year Breakout / All Time HighMayur Uniquoters Ltd
1) Time Frame - Weekly.
2) The Stock has been Consolidating since (August, 2014). Now It has given a multi year Consolidation breakout & Closed at it's Life Time High with good volume & good bullish momentum candle in weekly Time Frame.
3) The stock may find it's next resistance around the price (930 - 40.95% from the price 659.75) in the long term.
4) Recommendation - Strong Buy.

WTICAB - 3 Months Consolidation Breakout Wise Travel India Ltd
1) Time Frame - Daily.
2) The Stock has been in a Consolidation since (March, 2024). Now It has given Consolidation breakout & Closed at it's Life Time High with good volume & good bullish momentum candle in Daily Time Frame.
3) The next resistance would be around the price (330 - 18.15% from the price 279.30).
4) Recommendation - Strong Buy.

Nifty Metal: Metal stocks ready to flyMetal sector: Nifty metals has not shown much rally but as per time cycle this sector seems to be ready to fly in next few days/weeks. My Preferred picks are: Jsw steel, Nalco, jspl.

Breakout Stock | PELDown trend price consolidation in channel pattern
Given upper trend line breakout
fundamentally undervalued stock
stock getting volumes
good stock for holding purpose
PLong

ZEE ltd Analysis!As per trend its bullish facing big resistance at 289 & trend line breakage today at the end of day.
Good Buying oppurtunity for holding from 285 to 281
Support at 281
Resistance at target 289 to 290

NATURALGASHi, in this chart i drew a good Deamand and Supply level for Short and Long Positions in NATURALGAS...please Observe this levels and Analysis your own... Don't Take any orders Based on this Chart because this is just Observation purpose only.
I Observed these Levels based on price action and Demand & Supply which is My Own Concept Called "PENDAM ZONES" ... Don't Take any trades based on this chart/Post...because this chart is for educational purpose only not for Buy or Sell Recommendation.. Thank Q

Exide on Buying ZoneBuy exide @337.5 with Stoploss of @235.5
You can go for the target @244
Exide is looking good at technical point of view Risk and Reward ratio is very good at this Trade

Inverted head and shoulder | ERISinverted head and shoulders pattern formation in stock
price is resisting at neck line of head and shoulder pattern once price breaks this resistance of supply zone price expected to move upward
Stock successively running in down trend making lower higher and lower lows
but here trend is trying to change where it created peak of low and reverse back and again try down attempt but its over in small move price changes to up side and creating higher high and higher lows
this is how head and shoulder formation created.
Price down by 5 times when it comes to supply zone but this time at supply zone price not getting down but also sustaining at it higher level so we can see buyers are winning over sellers will see breakout once price breaks the blue zone drawn on chart

Café Coffee Day Breakoutstock give resistance level breakout
also support with down trend line
you can see a kind of triangle formation on daily chart in stock
looking good for swing trade here
also book value is 152 and stock running at 41 now
it also expected to give good quarter result

graphite india trend reversalstock given trend line breakout with volume
its running in a down trend from here after trend line breakout this may be trend reversal for stock
support trend supporting buy side trade
MACD also giving buy signal

trend reversal infosysafter a big gap down infy consolidated in certain price range
form here it given range breakout it may try to fill that gap
nifty it is turning back It stock will get movement from here
