Positional or Long Term Opportunity in ITCGo Long @ 327.8 for Targets of 357, 377, and 423 with SL 309.45
Reasons to go Long :
1. On Weekly timeframe If we draw Fibonacci retracement from the recent swing low (A) to the swing high (B) then the stock took support from the 0.5 Fibonacci level.
2. In addition to this, the stock formed a Bullish Engulfing Pattern (marked with a orange color) around 0.5 Fibonacci level.
3. Also there is a strong demand zone (marked with a purple color) from which the stock is taking support.
Candlestick Analysis

BankIndia - Rounding bottomBank of India has formed a rounding bottom pattern and also had a small breakout.
It had made high of 170 and then come down for the resting.
So, once it breaks and sustain above 170, you can buy and hold for the target of 200 and 220.
Buy on every dips after breakout, it will give handsome amount of return.

NIFTY is still weak and can break below anytime sooner$ As we can see NIFTY had been weak throughout the day despite getting rejected from the demand zone and the only hope is because it could maintain itself above the demand zone else a massive sell off could have taken place so now as soon as NIFTY breaks below the demand zone, that would potentially act as a supply zone giving fuel to the fire and exceeding weakness so plan your trades accordingly and keep watching the important zones.

BSE Ltd | Bullish Consolidation Near ₹3,000 | Liquidity & Trend
NSE:BSE Ltd (Daiy)
Bullish Continuation | Liquidity-Supported Breakout Setup
BSE Ltd continues to trade in a strong primary uptrend, maintaining a clear higher-high, higher-low structure on the daily timeframe. Price
Trigger: Daily close above ₹3,030 with volume
Price Compressing Near Range High
21 & 50 EMA Acting as Dynamic Support
Trend Intact Until 50 EMA Holds

VadilalVadilal has made a bottom out and ready ti move up.
It is good to buy and hold for the short term.
Buy on deep and hold till May-June to gain handsome profit.
Targets are 6500-8000-9500

Cempro Zone-based chart analysis approach applied consistently across stocks, crypto, and forex, focusing on price structure—not predictions.

NIFTY50 // BULLISH ENGULFING // 4HR TFHey folks,
I am looking here at the 4hr TF of Nifty 50 with EMA 50.
A visible Bullish engulfing on the 4hr tf has formed today above 50EMA, confirming the support of the moving average.
I know it is not a perfect bullish engulfing some of you might say, because of current 4hr candle open was not below previous one close. But in Chart analysis there is a rule that you to be versatile and flexible regarding these patterns, so it can be said that the two said price points are marginally close to consider this a engulfing.
Also, seeing little angle of the previous candle lower wick ( a good long one) it can be interpreted that the buy orders absorbed the good qty of sellers.
thus, I am going for a small long position in Nifty CE for next 4hrs candles till expiry of 10feb.
NIFTY 10FEB 26000CE.
Now just hoping for the "TRUMP" element to stay put down over the weekend.🤞🏼
:) Thanks. Happy Trading.

Signs of REVERSAL from our demand zone!? As we can see NIFTY managed to reverse exactly from our demand zone which was well anticipated but the holistic approach says we are still bearish following the global cues hence keep the bearish bias in long term, a short term reversal can be seen if NIFTY sustains itself above the demand zone so plan your trades accordingly and keep watching everyone.

Positional or Longterm Opportunity in Triveni TurbineGo Long @ 506.5 for Targets of 619, 670, 721, and 818 with SL 462
Reasons to go Long :
1. On Weekly timeframe If we draw Fibonacci retracement from the recent swing low (A) to the swing high (B) then the stock took support from the 0.5 Fibonacci level.
2. In addition to this, the stock formed a Bullish Engulfing Pattern (marked with a orange color) around 0.5 Fibonacci level.
3. Also there is a strong demand zone (marked with a purple color) from which the stock is taking support.

Trent Ltd Cmp 3823 Bullish Engulfing Candle @ supportTrent Ltd Cmp 3823 dated 3-2-2026
Weekly chart (Positional)
1. Bullish Engulfing Candle @ support
2. RSI reversal
Buy above 3900 Sl 3600 target 4000-4200-4400-4500
it is just a view, please trade at your own risk.

Resistance aheadPrice is near resistance zone.
Volumes are not strong.
RSI shows bearish divergence on weekly chart.
Thus shorts can give good risk/reward at current price

USA reduced TARIFF to 18%! Recovery for NIFTY!?Following the global cues, we can see SGX rose over 3 percent following the statement that USA has reduced tariff to 18 percent which will give temporary push to NIFTY but yet our supply zones will act as important zones hence we will trade based on rejection on your demand and supply zone so plan your trades accordingly and keep watching everyone.

Positional or Longterm Opportunity in BEMLGo Long @ 1838.1 for Targets of 2008.7, 2179.3, 2349.9, and 2520.5 with SL 1667.5
Reasons to go Long :
1. On Weekly timeframe If we draw Fibonacci retracement from the recent swing low (A) to the swing high (B) then the stock took support from the 0.618 Fibonacci level.
2. In addition to this, the stock formed a Bullish Engulfing Pattern (marked with a orange color) around 0.618 Fibonacci level.
3. Also there is a strong demand zone (marked with a purple color) from which the stock is taking support.

Positional or Longterm Opportunity in HBL EngineeringGo Long @ 794.1 for Targets of 867.05, 940, 1012.95, and 1085.9 with SL 721.15
Reasons to go Long :
1. On Weekly timeframe If we draw Fibonacci retracement from the recent swing low (A) to the swing high (B) then the stock took support from the 0.382 Fibonacci level.
2. In addition to this, the stock formed a Bullish Engulfing Pattern (marked with a orange color) around 0.382 Fibonacci level.
3. Also there is a strong demand zone (marked with a purple color) from which the stock is taking support.

Positional or Longterm Opportunity in NAVA LtdGo Long @ 570.9 for Targets of 607.25, 643.6, 679.95 and 716.3 with SL 534.55
Reasons to go Long :
1. The stock formed a Bullish Engulfing Pattern (marked with a orange color).
2. Also there is a strong Trendline (marked with green color) which supports the stock.
3. Also there is a strong demand zone (marked with a purple color) from which the stock is taking support.

More fall coming below 24800As we can see NIFTY fell strongly which was well analysed in our post but now it has also broken our important demand zone making it even weaker hence we may expect NIFTY to fall further towards 24400-24200 respectively in coming trading sessions so plan your trades accordingly and keep watching everyone.

Decoding Today’s Price Action on a Major Event Day(Union Budget)Is today’s market fall because of a negative budget surprise? Maybe yes, maybe no. That debate doesn’t help much.
But what does help is understanding that price action had already started preparing for this move nearly 10 days ago.
Candlesticks do speak — But only to those who have the patience to listen . Here's what they announced in advance:
Event days might trigger big moves — but structure prepares them in advance to facilitate big price movements

Positional or Long-term Opportunity in Piramal PharmaGo Long @ 203.6 for Targets of 229, 244, 259, and 287.1 with SL 186.9
Reasons to go Long :
1. On Weekly timeframe If we draw Fibonacci retracement from the recent swing low (A) to the swing high (B) then the stock took support from the 0.5 Fibonacci level.
2. In addition to this, the stock formed a Bullish Engulfing Pattern (marked with a orange color) around 0.5 Fibonacci level.
3. Also there is a strong demand zone (marked with a purple color) from which the stock is taking support.

XAUUSD – Historic Volatility Doji at 1.618 | Exhaustion SignalXAUUSD – HTF Exhaustion at 1.618 | Major Volatility Signal Formed
GOLD HAS PRINTED ITS BIGGEST DOJI IN ENTIRE HISTORY OF DAY CANDLE NEARLY 490$ FROM LOW TO HIGH AND ENDED WITH INDECISION. LETS SEE WHAT HAPPENS NEXT . WAIT FOR LOW AND HIGH OF DOJI.......?
Gold has reacted precisely from the 1.618 Fibonacci extension zone (~5600), where price printed a high at 5597.04 and faced strong rejection.
The current Daily candle is forming an exceptionally large indecision candle (Doji-like structure) after a strong impulsive move.
With an intraday range of nearly 490$, this candle highlights clear exhaustion and aggressive profit-taking at premium prices.
Technical Perspective
Clear rejection from the 1.618 extension resistance
Strong volatility spike following a vertical price expansion
Daily candle structure suggests weakening bullish momentum
Key HTF Levels to Watch
Resistance / Supply: 5580 – 5615
Immediate Reaction Zone: 5350 – 5400
Major Support / Rebalancing Area: 5000 – 4900
HTF Value Area Low: Below 4900 (only if bearish momentum accelerates)
Expectation (Next Sessions / 1–2 Weeks)
As long as price remains below the 1.618 rejection zone, probability favors:
Consolidation or corrective price action
Gradual rotation toward 5000–4900 HTF demand
No immediate V-shaped recovery unless strong acceptance above 5600 is seen

NIFTY at MAKE or BREAK AREA!!As we can see NIFTY has finally reached it trendline resistance which previously acted as a trendline support and an immediate supply zone can also be seen around 25500 so any signs of rejection could show strong weakness on the other hand if manages to break and sustain above 25500 then we may see another strong upmove in NIFTY as it would not only break the supply zone but also would break the trend line adding fuel to the fire so plan your trades accordingly and keep watching everyone .

REVERSED but will it sustain!? As we can see NIFTY did reversed exactly as analysed in our previous analysis as it was trading at important demand zone and a psychological level but the reversal wasn’t strong enough hence we may see weakness continuing in the index if fails to sustain itself above the psychological level so plan your trades accordingly and keep watching everyone.

NIFTY 50 1D T/F ANALYSIS----
nifty 50 1d t/f analysis----center portion is a double s curve which are bended both side now we can measure previous supply and also according to range analysis supply of timing will be half so we can expect demand can be fast here and wait for any bullish candle here on retesting area let`s see---

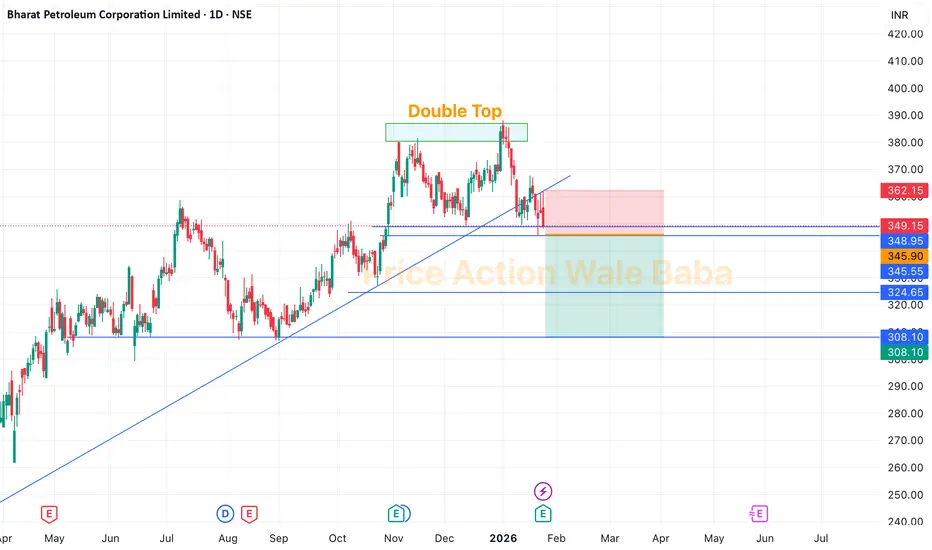
BPCL - Double TopBPCL is forming a Double Top which is has neckline of 345.
Delivery Based Selling Strategy:
Sell below 345,
Keep SL on high of 23rd Jan candle, which is 361.
Targets are 320-300.
Option Buying Strategy
So, for the option trading in this stock, you can choose any PUT option on BPCL, mark high of 21st Jan candle in option, once it breaks it just buy and keep SL below same day's low.