A possible Head and Shoulder formation in BankniftyChance of a head and shoulder formation on the hourly chart of the Index.
If the market clears the resistance line around 57300, it can form another high or test the recent high made.
On the lower side, there is are support and it may respect the support levels.
Major support levels :- 56800, 56640
Resistance levels :- 57285, 57600
Wait for the market to move above the neck line for any bullish trade to enter in the index. Else bearish trade can be initiated below 56650 levels.
Watch for the price action near the price levels before entering the trade.
Candlestick Analysis
Chart always tells the truth - Nifty and Banknifty The chart always tells the truth.
We studied that NSE:NIFTY would bounce, and it did — what a bounce!
But keep in mind, fear is still present in the market. Traders can sell even on the smallest negative trigger. Today’s move was largely because of short covering.
Today’s Nifty candle is bullish, but buyers’ volume is only 40 million higher than sellers, while on Friday sellers had 43 million more than buyers.
This clearly shows that sellers are still active.
So, a bullish candle + low volume + short covering = likely sideways action tomorrow.
Nifty levels:
- Support: 25050
- Resistance: 25175 — above this, we could see short covering up to 25350
The market remains bullish, and this is the right time to build a list of stocks where character or structure change has happened.
If you can spot such small-cap stocks, you can easily aim for 40-50% upside in next 3-4 months.
Talking about NSE:BANKNIFTY — even after such a big green candle, sellers outnumbered buyers by 7 million in volume. So be cautious while trading here.
BankNifty levels:
- Support: 56770
- Resistance: 57200
Sector-wise, the craze is still around IPOs. Focus on recently listed NSE:NIFTY_IPO stocks (1-2 years old) where character changed in the last rally.
Here’s how my recent picks performed today:
NSE:MASTEK - +7%
NSE:PARADEEP - +7.63%
NSE:JYOTICNC - +5%
NSE:BDL - +2.80%
NSE:LTF - +3.66%
NSE:UPL - +3.92%
NSE:CARRARO - +5.6%
NSE:KPEL - +4.7%
NSE:MMTC - +3.79%
That’s all for today.
Take care.
Have a profitable tomorrow.
Powergrid - 10% Upmove possible?!!!Chart patterns suggest me the above titled opinion
1. Monthly chart shows a Mother baby candle (feb and march 2025)
2. Weekly chart too shows a good inside bar candle with good volume support and Breakout visible (shown below)
3. In daily time frame, there is an expanding channel pattern... . Higher high formed indicates a bulls edge .
4.Let's wait for the Breakout and enter the trade
5.Target levels mentioned @ chart.
This is just my opinion...not a tip nor advice...
Thank you!!!!
Positional or longterm opportunity in CESCGo Long @ 139.6 for Targets of 165, 185.8, and 276.5 with SL 124.2
Reasons to go Long :
1. On a Weekly timeframe if we draw the Fibonacci retracement tool from the recent swing low (point A) to the recent swing high (point B) then we see stock took support from the 0.618 Fibonacci level.
2. Besides, a bullish candlestick pattern Bullish Engulfing (marked with orange) is formed around the 0.618 Fibonacci level.
3. Also there is a strong Trendline (marked with green color) which earlier was acting like resistance but now is providing support to the stock.
EDELWEISS FIN SERVE LTD - BUY/LONG TRADEThere is bullish head and shoulder formation on edelweiss fin serve ltd. given breakout on daily time frame with supporting volume . one can look to buy if next candle hold above breakout candle high with mention target and without stoploss as i will update when to exit.
ELECTCAST : Swing Trade#ELECTCAST #ThreeWhiteSoldiers #fairvaluegap #stage1breakout #breakoutstock #Trendingstock
ELECTCAST : Swing Trade
>> Low PE Stock
>> Stage 1 Breakout & Retest done
>> TWS & FVG Visble
>> Liquidity Sweep Visible
>> Volumes Dried up
>> Stock gaining strength
Swing Traders can lock profit at 10% and keep Trailing
Please Boost, comment and follow us for more Learnings.
Note : Markets are still Tricky and can go either ways so don't be over aggressive while choosing & planning your Trades, Calculate your Position sizing as per the Risk Reward you see and most importantly don't go all in
Disc : Charts shared are for learning purpose only, not a Trade recommendation. Do your own research and consult your financial advisor before taking any position.
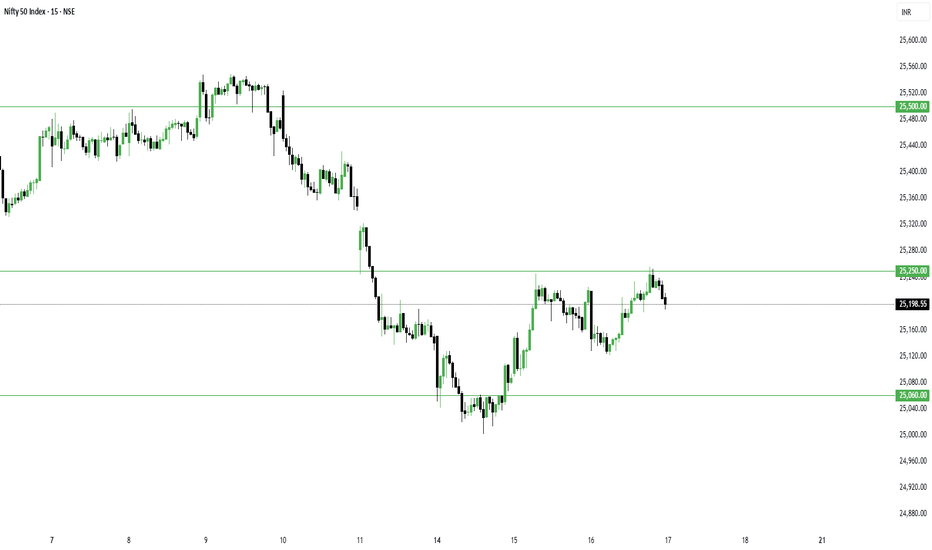
Nifty Holds Positive Trend, BankNifty Eyes New High - Key LevelsThe missing piece we talked about yesterday — a close above 25200 — is now complete.
Selling pressure has reduced, although we didn’t get the strong follow-up buying we expected.
But from a trading perspective, today was superb:
- NSE:SPORTKING , which we bought yesterday, gained another 7% today.
- NSE:EDELWEISS intraday setup delivered a solid 6% move.
- NSE:TATAPOWER ATM options shot up by 100%.
- As mentioned in yesterday’s commentary, NSE:CNXPSUBANK performed well — I’m holding NSE:BANKBARODA and had added #SBIN a few days back.
- NSE:SHYAMMETL closed strong today; I’ve taken it as a positional trade.
- I exited NSE:CUPID today and replaced it with $NSE:MOBIKWIK.
In total, I’m holding 4 open positions, and I’ll continue to hold them until they overextend.
Coming to the market:
Nifty formed a Supply Candle today as sellers’ volume was 33 million higher than buyers.
The positive takeaway is that selling pressure has eased, and the trend has moved back to the positive zone.
Considering these conditions, tomorrow is likely to remain sideways.
NSE:NIFTY levels for tomorrow:
- Resistance: 25250 — a close above this could trigger short covering up to 25500
- Support: 25155
BankNifty looks stronger than Nifty and seems ready for a new all-time high.
NSE:BANKNIFTY levels for tomorrow:
- Support: 57000
- Resistance: 57300 — a breakout above this can push it to fresh highs
Sector-wise, #PSUBANKS remained the strongest today.
That’s all for today.
Take care.
Have a profitable tomorrow.
MTNL's Comeback Story: Innovation and GrowthRevitalizing MTNL: A Bright Future Ahead
Target: ₹200
Time frame: 3 years
Mahanagar Telephone Nigam Limited (MTNL), a Public Sector Undertaking (PSU), has faced significant challenges in recent years, leading to a decline in its business fortunes. However, despite being knocked out of the competitive telecom market, the company is poised for a resurgence.
Embracing New Frontiers
As the telecom landscape evolves, MTNL is gearing up to tap into emerging opportunities. The future holds immense promise, and the company is strategically repositioning itself to capitalize on newer forms of communication and technology.
5G: The Game-Changer
A key catalyst for MTNL's revival is the ongoing testing of 5G technology. With its potential to enable faster data speeds, lower latency, and greater connectivity, 5G is expected to revolutionize the telecom sector. MTNL's foray into 5G will enable it to offer cutting-edge services, bolstering its competitive edge.
Ambitious Targets
Three-Year Roadmap
Over the next three years, MTNL will concentrate on:
Enhancing its 5G capabilities to deliver high-speed, reliable connectivity
Developing innovative services and solutions to cater to emerging customer needs
Strengthening its network infrastructure to support growing demand
Fostering strategic partnerships to drive growth and expansion
With a clear vision and robust strategy in place, MTNL is poised to reclaim its position as a leading player in the Indian telecom sector. The future indeed looks bright for this PSU, as it embarks on a transformative journey to reclaim its glory.
Pivot Low Formed, Follow-Up Buying Crucial – Nifty and BankniftyYesterday, i mentioned that sellers’ volume was 40 million higher than buyers, and for a new trend to emerge, today’s candle needed to absorb that supply.
And look what happened — today, buyers’ volume surpassed sellers’ by 82 million.
All the setups I traded today blasted exactly as expected:
NSE:SWARAJENG (Earnings Pivot) – +10%
NSE:SPORTKING – +5.92%
NSE:MOBIKWIK – +4.16%
For the short term, I am still holding NSE:CUPID , which has already given a 22% move in the last 3 sessions since my entry!
Now, coming to today’s market action:
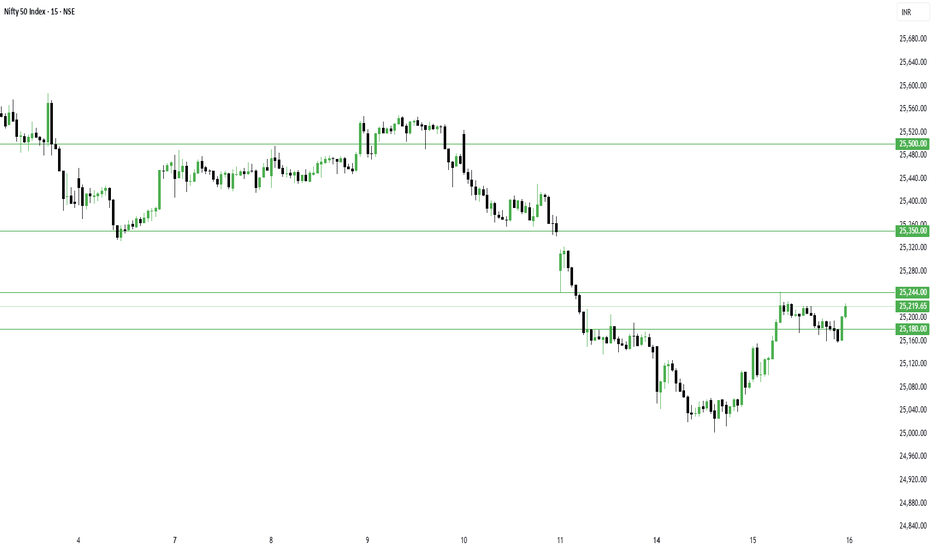
NSE:NIFTY formed a Demand Candle today, and along with that, a Pivot Low has also been created.
The only missing piece is that the index hasn’t yet closed above 25200.
The message is clear — if we get follow-up buying tomorrow, the index could be ready for a fresh high.
For tomorrow:
Resistance: 25244 — once crossed, short covering can push it directly to 25350/25500.
Support: will be at 25180.
NSE:BANKNIFTY looks more positive, and this time, NSE:CNXPSUBANK could be the key driver.
For BankNifty:
- Support: 56965
- Resistance: 57260 — a close above this could trigger a move towards a new high.
Talking about sector rotation — in the short-term timeframe, a new sector has emerged: NSE:NIFTY_CONSR_DURBL
NSE:NIFTY_IPO stocks remain strong, and for intraday trades, NSE:CNXAUTO and NSE:NIFTY_EV stocks are at the top of the list. So if you’re planning tomorrow’s intraday trades, focus on these sectors.
That’s all for today.
Take care.
Have a profitable tomorrow.
July is Historically a Bullish Month for NiftySaid earlier that NSE:NIFTY could pull back till 25000 and then bounce. And that's exactly what happened.
The quarterly rotation in the market seems to have completed. And today, supply started getting absorbed.
I’ve already mentioned before — July has historically been a positive month for the markets, and that view still stands.
The outlook remains bullish.
Today’s candle in Nifty is a demand candle — it has absorbed nearly half of the selling pressure.
However, the remaining supply is still there, since sellers outnumbered buyers by around 40 million today.
So we’ll turn aggressive only if tomorrow’s early session absorbs this supply.
Ideally, the first hourly candle should take care of it. If that happens, strong momentum can follow.
Otherwise, Nifty might just consolidate for a bit.
Intraday levels for tomorrow:
- Support: 25044
- Resistance: 25202
If 25202 breaks, direct upside target is 25350.
Coming to NSE:BANKNIFTY — today’s candle is indecisive.
If strong momentum doesn’t follow soon, it could drop again.
So it’s important for BankNifty to close above 57098 within the first hour tomorrow.
Support zone will be around 56590.
Talking about sector rotation — NSE:CNXMEDIA topped the charts today. So special focus should be there for intraday trades.
That said, short-term leadership is still with IPOs, Pharma, and Realty sectors.
Right now is the best time to identify quality breakout stocks.
But remember, you also need a solid position management strategy.
Most traders make the mistake of exiting too early in bull markets with small profits — that’s greed.
In bull phases, the goal should be to ride the trend. Don’t follow feelings. Follow your setup.
Stocks like NSE:HPL and NSE:DBREALTY are showing great setups.
Study these setups carefully. Learn from them. Never blindly copy others.
That’s all for today.
Take care.
Have a profitable day ahead.
Nifty possible movement for the upcoming trading session.Nifty closed around the support zone forming a long lower tail showing some bullishness today.
Though the market has moved after a long time and can move on the either side.
Levels are marked and possible movements are also plotted.
Wait for the price action and trade accordingly.


