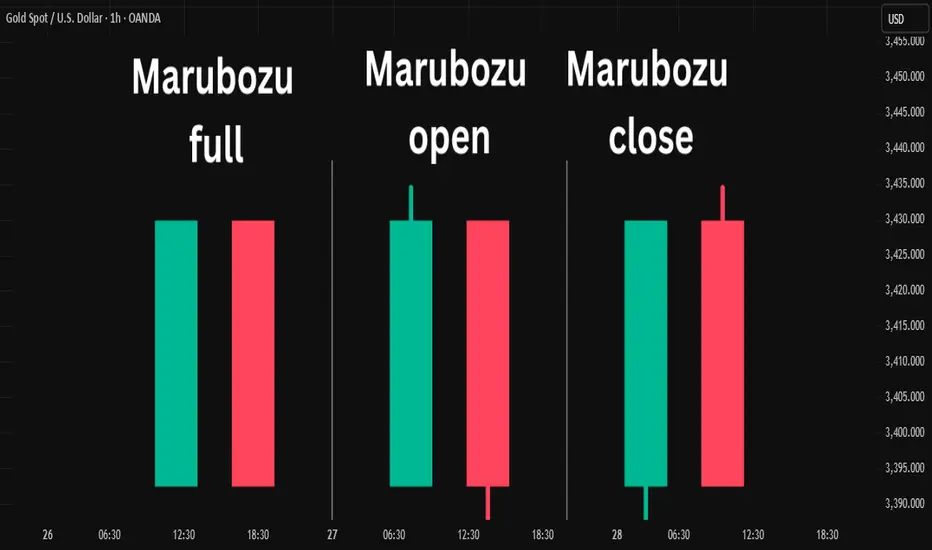
Marubozu Candlestick Pattern.....The Marubozu is a unique and powerful single candlestick pattern that signals strong momentum in the market.
📌 What is a Marubozu?
A Marubozu candlestick has "no wicks or small wicks" — just a full body from open to close. This shows that the buyers or sellers were in complete control during that period.
🔵 Bullish Marubozu
A Bullish Marubozu opens at the low and closes at the high, showing strong buying pressure. It often appears at the beginning of a bullish move or during a breakout.
🔴 Bearish Marubozu
A Bearish Marubozu opens at the high and closes at the low, indicating strong selling pressure. It can mark the start of a downtrend or a continuation of bearish strength.
🧠 Interpretation
Marubozu patterns are seen as signs of conviction. When spotted at support or resistance zones, they can strengthen breakout signals or confirm reversals.
⚠️ Tip :
Always combine Marubozu with volume analysis or other indicators to avoid false signals and improve accuracy.
🔍 Use this pattern to identify strong momentum shifts and trade in the direction of the breakout!
Disclaimer :
This post is not financial advice, it's for educational purposes only highlighting the power of coding( pine script) in TradingView, I am not a SEBI-registered advisor. Trading and investing involve risk, and you should consult with a qualified financial advisor before making any trading decisions. I do not guarantee profits or take responsibility for any losses you may incur.
Candlestick Analysis
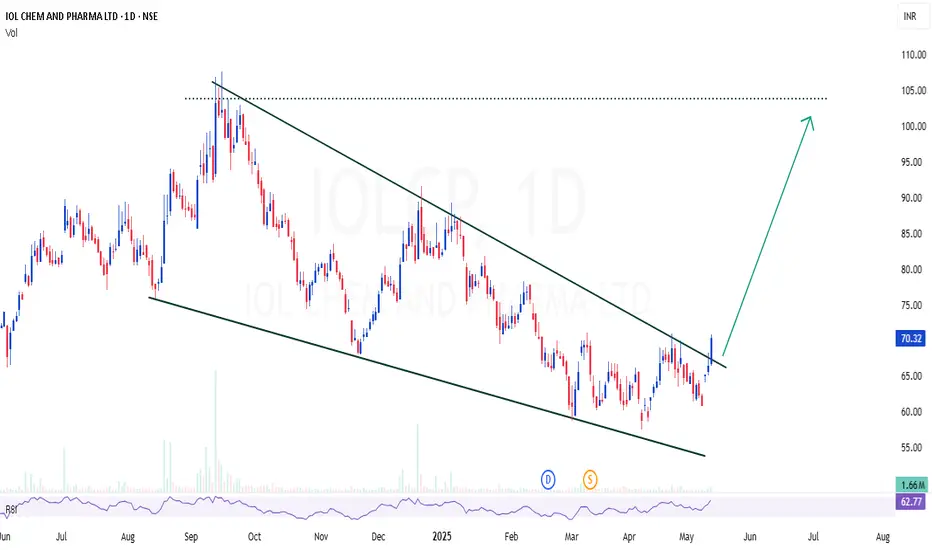
IOLCP | Perfect channel / wedge breakout - Looks good for 50%IOLCP | Perfect channel / wedge breakout - Looks good for 50%
CMP : 70
SL : 60
Target : 100
Gallantt Ispat Ltd - Up Flag PatternGallantt Ispat Ltd. displays a strong bullish setup with multiple confluences suggesting potential upside:
📊 Technical Analysis Summary:
✅ 1. Bullish Flag / Pennant Pattern
After a strong uptrend (flagpole), the price is consolidating in a tight descending channel, forming a bullish pennant.
These patterns are continuation setups, and a breakout above the upper trendline usually signals a resumption of the uptrend.
✅ 2. Volume Spike
There is a clear increase in volume, confirming institutional interest.
Breakouts with volume are more reliable—this spike could indicate accumulation before breakout.
✅ 3. MACD (CM_Ult_MacD_MTF)
MACD line is above the signal line and both are rising, indicating positive momentum.
Histogram turning blue and increasing, further confirms bullish momentum.
✅ 4. Entry/Exit Setup
Entry zone: Around ₹554.70 (current price), or on breakout above ₹562.40.
Stop loss: Around ₹523.75 (below pattern and recent support).
Target: ₹639.80 (based on flagpole projection).
🧠 Trade Idea:
Risk-Reward: Favorable (Approx. 1:2.7 R:R).
Ideal Entry: Wait for breakout candle with high volume above ₹562.40.
Safe Entry: Enter in retest after breakout, if it occurs.

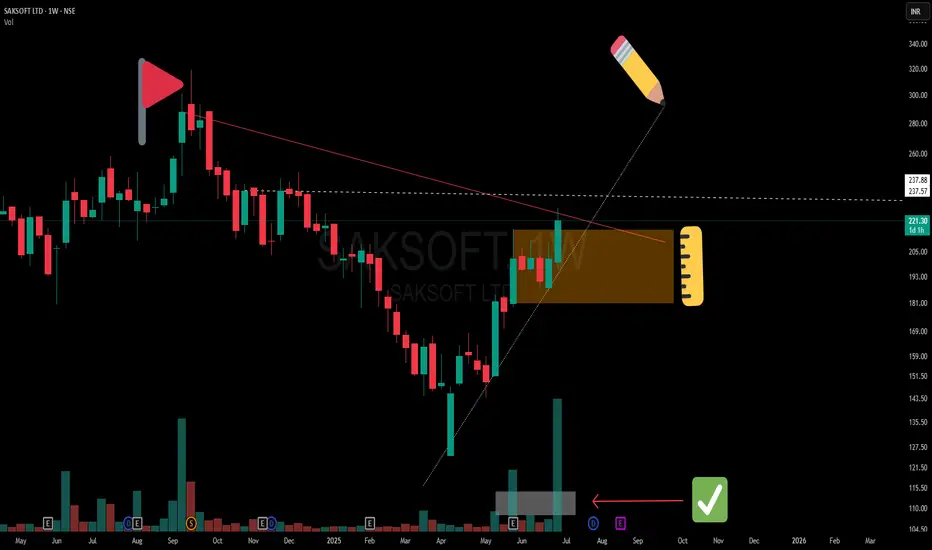
Precision Meets Patience | SAKSOFT Chart WTF🔻 A clean Control Trendline (CT) drawn from the all-time peak (🔺) on the Weekly Time Frame (WTF) shows a long-term price memory resistance finally getting tested.
📏 Overlapping that is a hidden horizontal resistance (⚪ dotted white line), representing the final hurdle before the stock can challenge the supply zone.
🟧 Mother Candle Structure: A powerful consolidation candle has now been broken with strength, giving us structure + intent in one move.
🔊 Volume speaks! We’ve seen two separate clusters of high volume, confirming active participation—not a lonely breakout.
📈 The trendline from bottom left is giving both body and wick supports—a technically clean angle where structure meets sentiment.
📝 Note:
This is a structural breakdown meant for educational and analytical purposes. Not a forecast or recommendation.
ITC will start going downwards soonTECHNICAL INDICATORS -
DOUBLE TOP PATTERN :
Recently NSE:ITC has formed a double top pattern indicating strong bearish potential for the stock
Double top is formed when 2 consecutive peaks are formed with a dip or low between them
HANGING MAN CANDLESTICK :
The stock has also formed a hanging man candlestick which denotes reversal of upward trend to downward trend
Hanging man is formed when a candlestick has long lower shadow and small upper body at the top
STRONG SUPPORT-RESISTANCE ZONE :
The stock has also taken reversal from a very strong support-resistance zone twice in the last 1 month indicating very stong momentum for the stock to go downwards
PROFIT TARGET :
411
STOP LOSS :
435

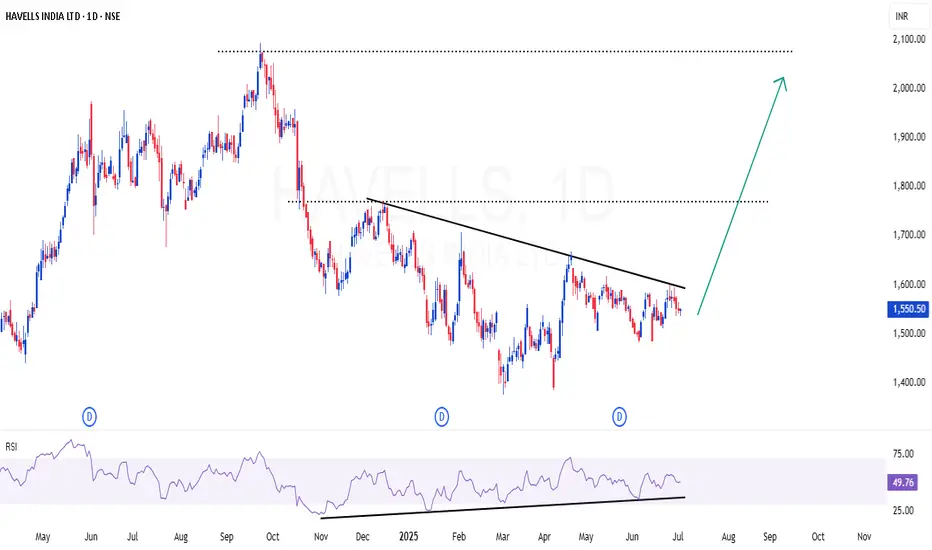
HAVELLS | Pleasant set up - INHS & RSI divergenceHAVELLS | Pleasant set up - INHS & RSI divergence
Strong RSI divergence in daily time frame
Inverted Head & Shoulder setup also in visual
A small dip may be possible for 8-10% in this stock , as market (NIFTY) is over heated. But we can consider that as opportunity to scale up the position
CMP : 1550 (Dip : 1480)
Head And Shoulder in Formation. Will it succeed?Gold is trading near the Support of 3250 3300
With a head and shoulder in formation.
Will it complete and give break on the downside remains to be seen.
If it does, 3050 could be tested.
Failure could lead to rally again, towards ATH and 3600

BLUE STAR LTD. – TECHNICAL ANALYSIS📈 BLUE STAR LTD. – TECHNICAL ANALYSIS
📆 Date: July 1, 2025 | ⏱ Timeframe: Daily Chart
🔍 Educational Breakdown – For Learning & Study Use Only
________________________________________________________________________________
🔹 Price Action Zones
• 🔴 Top Range (Resistance): 2417
• 🟢 Bottom Range (Support): 1521
________________________________________________________________________________
🔹 Chart Pattern: ✅
Rectangle/Box Consolidation Breakout – Price was range-bound in a tight zone and has given a strong breakout on high volume, indicating bullish intent.
________________________________________________________________________________
🔹 Reversal Candlestick Patterns
• Top Range (2417): ⛔ No recent candlestick activity visible at the top range.
• Bottom Range (1521): Todays Candle
✅ Bullish Engulfing + Strong Bullish Candle
✅ RSI Bounce + Volume Spike
✅ Confirmed by Price Action and Momentum Indicators
________________________________________________________________________________
📊 Trade Plan (Based on Reason and Logic)
🔼 Bullish Trade Setup:
• Entry: 1715 (Breakout Candle Close)
• Stop Loss: 1614.45 (Below consolidation and bullish candle)
• Target 1: 1850
• Target 2: 1980
• Reason:
o Strong breakout with above-average volume
o Multiple confirmations (RSI, Bollinger Band, Supertrend)
o Box breakout with previous supply cleared
________________________________________________________________________________
🔽 Bearish Trade Setup:
• If price fails to sustain above 1715 and closes back below 1680 zone
• Entry: Below 1665 (Fakeout confirmation)
• SL: Above 1715
• Target: 1615 / 1550
• Reason: Potential failed breakout & liquidity trap
________________________________________________________________________________
📌 Disclaimer
This analysis is shared for educational and study purposes only. It does not constitute investment advice. The author is not SEBI-registered. Please consult a SEBI-registered advisor before making trading decisions. Always use proper risk management and trade only with confirmation.
________________________________________________________________________________
💬 Comments
What’s your view on Britannia?
Drop your thoughts and chart setups
________________________________________________________________________________

BRITANNIA INDUSTRIES LTD. – INTRADAY ZONE ANALYSIS📈 BRITANNIA INDUSTRIES LTD. – INTRADAY ZONE ANALYSIS
📆 Date: July 1, 2025 | ⏱ Timeframe: 15-Minute Chart
🔍 Educational Breakdown – For Learning & Study Use Only
________________________________________
🔹 Price Action Zones
🔴 Top Range (Resistance): ₹5869.50
🟢 Bottom Range (Support): ₹5721
⚪ Neutral Zone: Between ₹5732 – ₹5804 (No clear directional bias until breakout from either zone)
________________________________________
🧩 Chart Pattern: No
There’s no prominent chart pattern (e.g., flag, wedge, triangle) seen in the current snapshot. This is primarily a demand-supply structure with price action analysis.
________________________________________
🔁 Reversal Candlestick Patterns:
🔴 Top Range: No textbook reversal candle observed yet. However, the previous rejection from ₹5822–₹5804 still makes this zone valid for bearish observation.
🟢 Bottom Range: ✅ Morning Star pattern identified near ₹5721.
This is a strong bullish reversal pattern indicating potential buyer strength emerging from the demand zone.
________________________________________
🧠 1. Trade Plan (Based on Reason and Logic)
🔼 Bullish Trade:
Idea: Go long if price retests ₹5732–₹5721 and holds with bullish confirmation (preferably another higher low or volume spike).
Stop Loss: Below ₹5715
Risk-Reward: 1:1 | 1:2+
Logic: Presence of a valid Morning Star reversal at demand zone suggests buyer strength and potential upside toward ₹5800+.
________________________________________
🔽 Bearish Trade:
Idea: Short if price rallies to ₹5822–₹5804 and shows rejection (bearish wick, reversal candle, volume drop).
Stop Loss: ₹5827.25
Risk-Reward: 1:1 | 1:2+
Logic: Previously reacted supply zone with strong rejection. If tested again without volume confirmation, short setup is valid.
________________________________________
📦 2. Trade Plan Based on Demand/Supply Zones
🟥 Supply Zone: ₹5822 – ₹5804
SL: ₹5827.25
Plan: Enter short only if price rejects the zone again with bearish confirmation.
Risk-Reward: 1:1 | 1:2+
🟩 Demand Zone: ₹5732 – ₹5721
SL: ₹5715.60
Plan: Enter long if the zone holds, ideally using the Morning Star as confirmation.
Risk-Reward: 1:1 | 1:2+
________________________________________
📌 Disclaimer
This analysis is shared for educational and study purposes only. It does not constitute investment advice. The author is not SEBI-registered. Please consult a SEBI-registered advisor before making trading decisions. Always use proper risk management and trade only with confirmation.
________________________________________
💬 Comments
What’s your view on Britannia?
Will the Morning Star at the demand zone lead to a reversal, or will supply pressure dominate again?
Drop your thoughts and chart setups below 👇
________________________________________

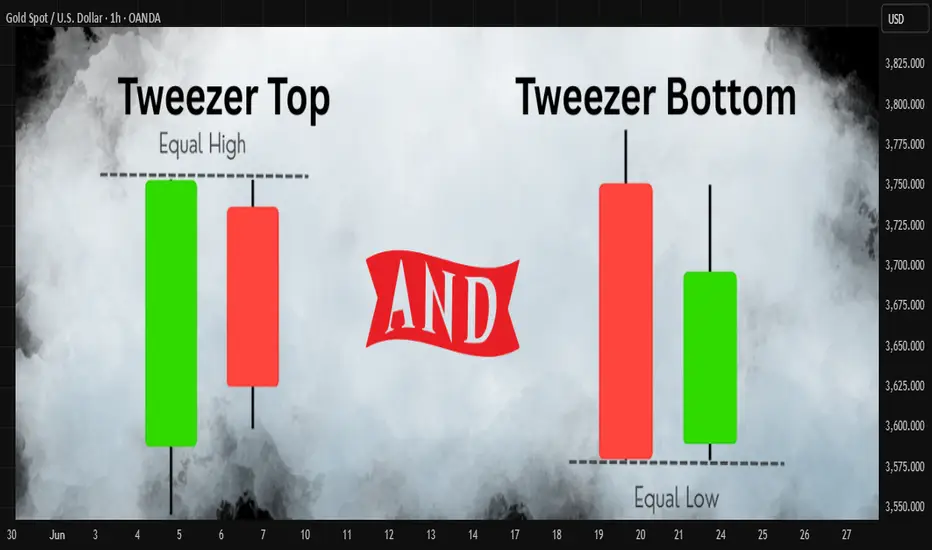
Tweezer Top and Tweezer Bottom Candlestick PatternsTweezer Top and Tweezer Bottom are powerful reversal candlestick patterns often spotted at the end of trends.
🔻 Tweezer Top
Appears at the top of an uptrend. It consists of two consecutive candles with similar highs. The first candle is usually bullish, followed by a bearish candle of almost the same high, signaling a potential bearish reversal.
🔺 Tweezer Bottom
Appears at the bottom of a downtrend. It consists of two candles with matching lows. The first candle is bearish, followed by a bullish candle of nearly equal low, indicating a possible bullish reversal.
📌 Key Characteristics:
• Both candles have equal highs (top) or lows (bottom)
• Second candle shows hesitation or rejection of the previous trend
• Often found near resistance or support zones
• Works best with volume confirmation or other confluence signals
Disclaimer :
This idea post is not financial advice, it's for educational purposes only highlighting the power of coding( pine script) in TradingView, I am not a SEBI-registered advisor. Trading and investing involve risk, and you should consult with a qualified financial advisor before making any trading decisions. I do not guarantee profits or take responsibility for any losses you may incur.
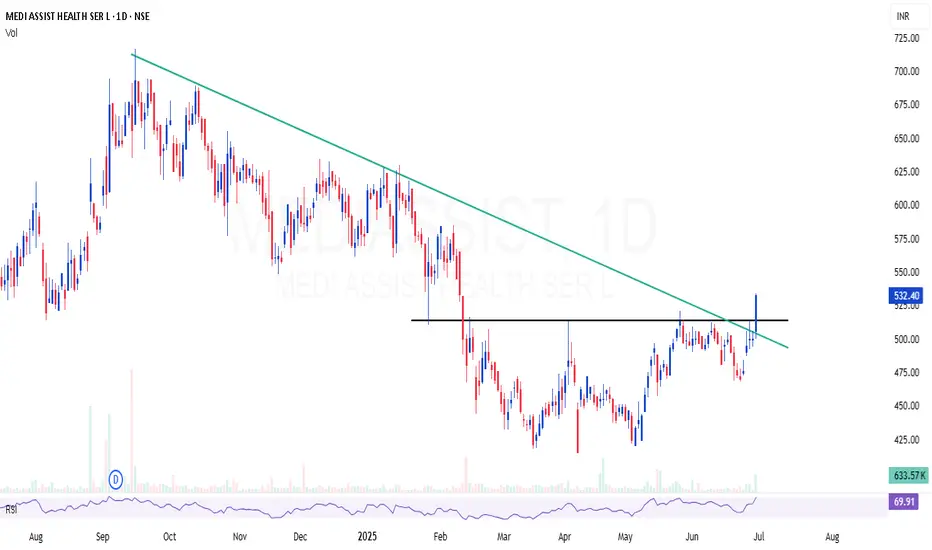
MEDIASSIST | High probable setup - Looks good for 30%MEDIASSIST | High probable setup - Looks good for 30%
Technically, the stock is strong and recent news—like the Star Health deal—is positive. The coming lock-in expiry, however, could trigger volatility. With solid digital expansion but elevated valuation, it's likely attractively positioned yet not without risk.
CMP : 532 (Dip : 500)
SL : 470
LICHSGFIN | Small flag setup (Small but convincing)LICHSGFIN | Small flag setup (Small but convincing)
Looks good for 25- 30% with good risk reward
Keep SL below 530

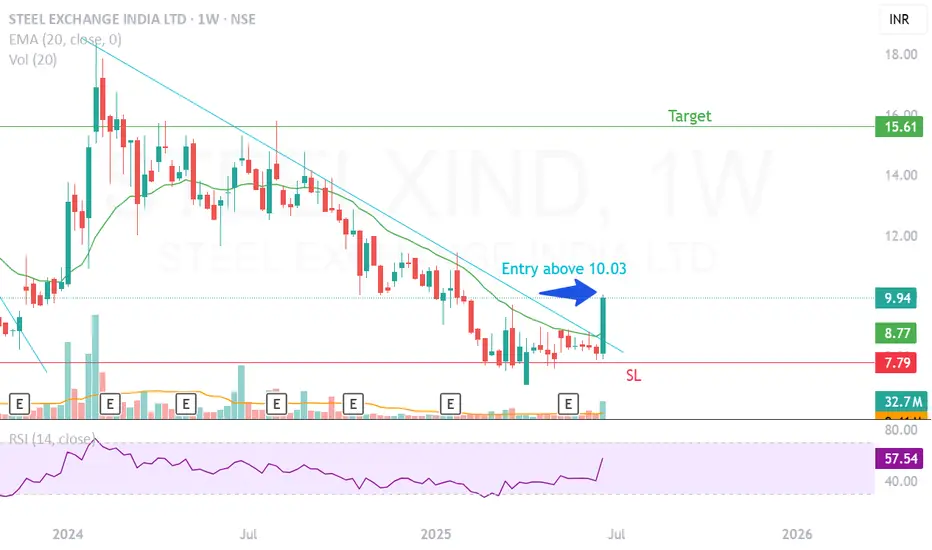
Trendline breakout in weekly Time frameLooks good for buying at this price .
The price was at key support level
trendline breakout happened in daily, weekly timeframe
can get best returns in short time when chased the target with trailing stoploss
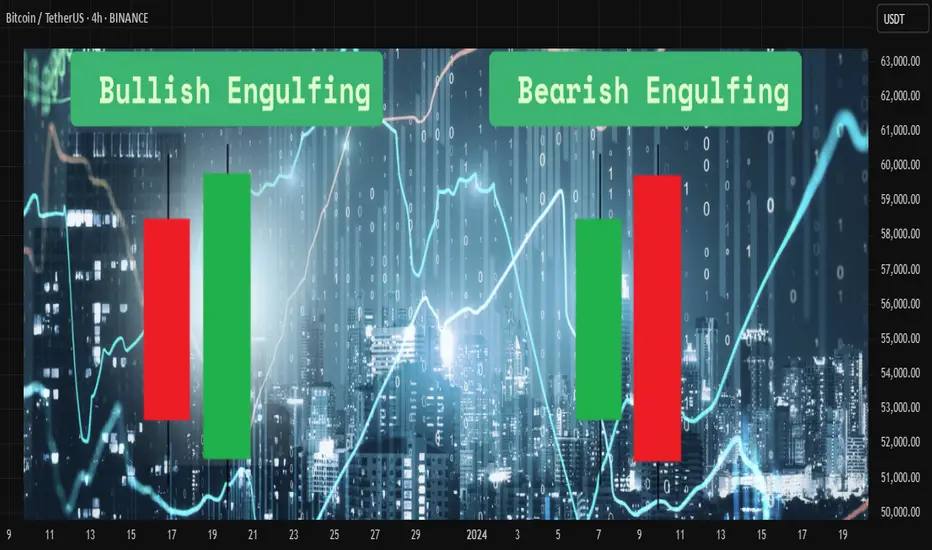
Engulfing Candlestick Pattern Explainedthe engulfing candlestick pattern is a powerful price action signal used by traders to identify potential reversals in the market. it consists of two candles:
🟢 bullish engulfing
* occurs during a downtrend
* the first candle is bearish (red)
* the second candle is bullish (green) and completely engulfs the body of the first candle
* it signals a potential reversal to the upside
🔴 bearish engulfing
* occurs during an uptrend
* the first candle is bullish (green)
* the second candle is bearish (red) and completely engulfs the body of the first candle
* it signals a potential reversal to the downside
📍 key points to remember
* the second candle must fully engulf the body (not just the wicks) of the first candle
* higher volume during the engulfing candle increases its reliability
* it works best when combined with support and resistance levels or trendlines
💡 confirmation
always wait for confirmation before entering a trade. for bullish engulfing, a break above the high of the engulfing candle is ideal. for bearish engulfing, a break below the low adds strength to the signal.
📈 How to use it ?
many traders use this pattern as part of their entry or exit strategy. combining engulfing patterns with indicators like rsi, moving averages, or trend filters can improve accuracy.
⚠️ risk management
like any pattern, engulfing candles are not 100% accurate. always use proper risk management and stop-loss placement to protect your capital.
Disclaimer :
This Video is not financial advice, it's for educational purposes only highlighting the power of coding( pine script) in TradingView, I am not a SEBI-registered advisor. Trading and investing involve risk, and you should consult with a qualified financial advisor before making any trading decisions. I do not guarantee profits or take responsibility for any losses you may incur.
Bullish and Bearish harami candlestick patternthe harami pattern is a two-candle reversal formation seen on candlestick charts. it reflects indecision and a possible shift in momentum, making it useful for spotting early signs of a trend change.
🔵 bullish harami
this pattern forms during a downtrend. the first candle is a large bearish one, followed by a smaller bullish candle that fits completely within the body of the first candle. this shows that selling pressure is weakening and a potential upward reversal may occur.
🔴 bearish harami
this pattern appears during an uptrend. the first candle is a strong bullish one, followed by a smaller bearish candle that is completely inside the previous candle’s body. this suggests that buying strength is fading, and a downward move might follow.
📌 key characteristics
* second candle is smaller and opposite in direction
* body of the second candle is fully within the body of the first candle
* confirmation from volume or the next candle increases reliability
✅ usage tips
* combine with support and resistance levels or trendlines
* look for confirmation from indicators like rsi or macd
* avoid using it alone in sideways or noisy markets
Disclaimer :
This post is not financial advice, it's for educational purposes only highlighting the power of coding( pine script) in TradingView, I am not a SEBI-registered advisor. Trading and investing involve risk, and you should consult with a qualified financial advisor before making any trading decisions. I do not guarantee profits or take responsibility for any losses you may incur.

Weekly CT Breakout + 200EMA Flip | GALAXYSURF Structure📉 Main CT Line (Dotted White)
A well-defined counter-trendline finally gave way after weeks of price compression. The breakout was clean, with a strong bullish candle closing decisively above it.
📊 Volume Confirmation
Breakout candle posted a solid spike in volume — the highest weekly volume in months. 💥
📈 200 EMA Broken (Blue Line)
Price has also cleared the 200-week EMA, a key dynamic resistance, now potentially flipping to support. 📉
🟧 Higher Timeframe Supply (Orange Line) / ⚪ (White Lines)
The breakout candle has also stepped into a tight zone between Weekly + Monthly supply, marked by the orange line.
📌 As always, the chart tells the story. No predictions. No assumptions, just structure.

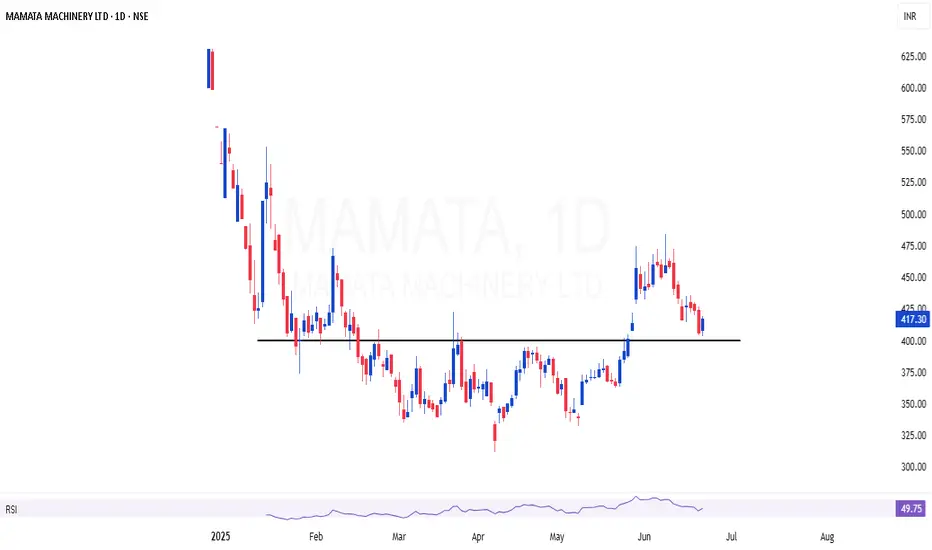
MAMATA | Breakout and retesting the area of valueMAMATA | Breakout and retesting the area of value
Valuation also looking good
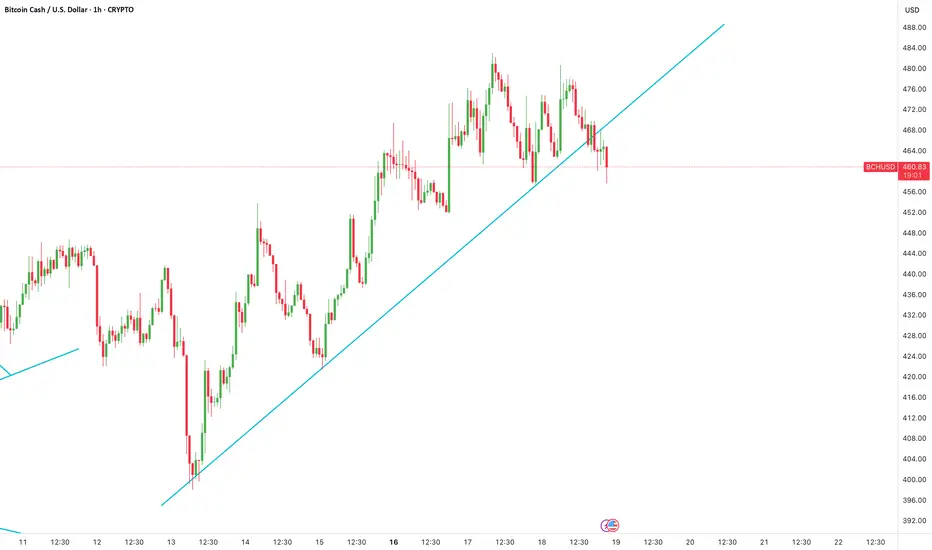
BCHUSD Trendline Breakdown and RetestBCHUSD has broken its trendline on the 1-hour timeframe and has retested with a large doji and a subsequent inside candle.
This is a great bearish signal with the SL of the high of the Retest/Doji candle.
My target will be at the 222-225 level which is second trendline point.
Bandhan Bank June Futures at a crucial zone.Bandhan Bank is at a crucial zone for continued upward momentum after a steep fall towards the support zone. The bullish momentum today has been pretty strong, although the price is coming at a halt near the 178-179 range, upon the break of 179.5 and upwards, I expect the price to continue upto 183, 188 in the coming 2 weeks, and 200, 212 (upon extreme optimism and market’s current momentum).
Buy trade executed at 173.5.

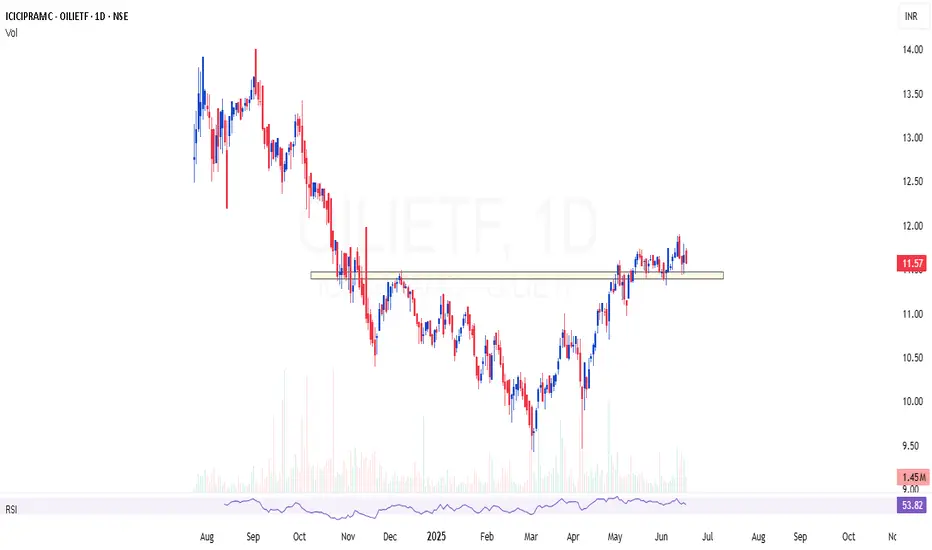
OILIETF | Good theme for current global sentimentOILIETF | Good theme for current global sentiment
The ETF has good volume to trade,
Portfolio consist of stable stocks that are fallen already
Trying to capture a 30% move in this ETF
Has good risk reward and momentum aswell
Relatively a stable bet
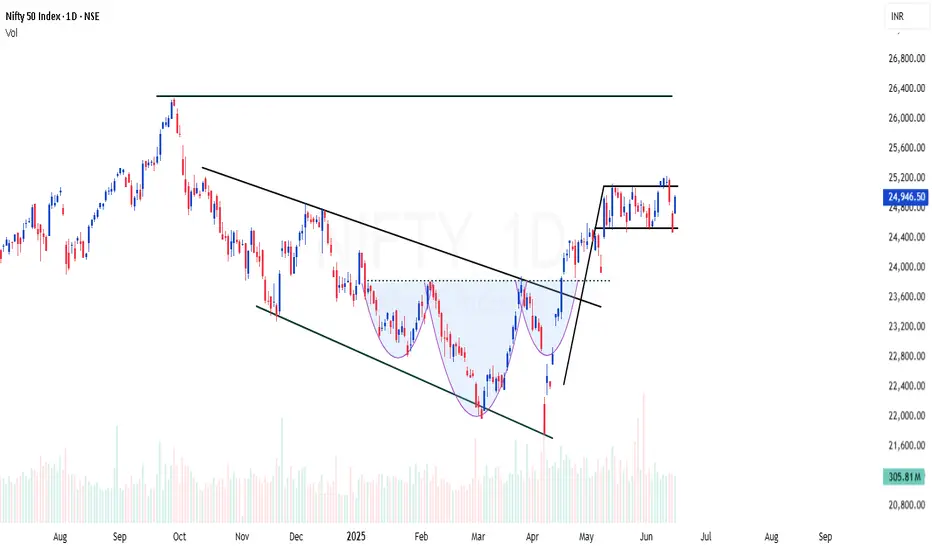
NIFTY | Back to back bullish patternsNIFTY showing back to back bullish signs
Channel breakout - Done
Inverted Head & Shoulder breakout (INHS) - Done
Now forming flag setup
NIFTY shows strength to move another 15% this year
Simplified Approach to read Candlesticks -Easy Candles ~ Part 1MARKETSCOM:OIL
Introduction
⦿ Candles form the basis of chart creation and analysis.
⦿ A weak foundation can destabilise your entire structure. This thread will clarify and simplify your understanding of price candles.
I use two types of candles on charts:
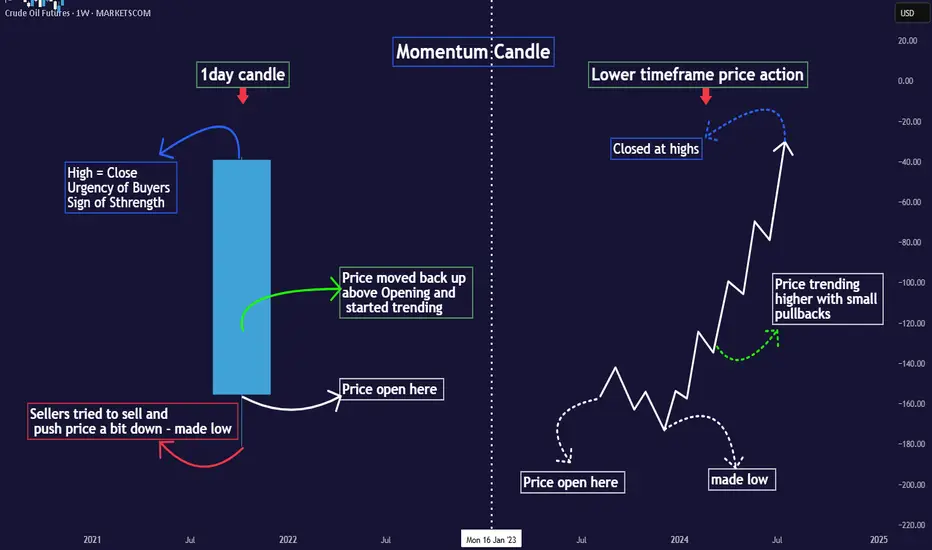
1. Momentum/trending candles
2. Ranging/trading candles
Understanding these eliminates the need to memorize complex candle names (e.g., Marubozu, Harami bullish) cause every candlestick pattern is formed with combination of these 2 candels only.
Definitions:
⦿ Momentum candle: Body >50% of total size
⦿ Range candle: Body <50% of total size
Decode Momentum Candle
⦿ Only Buyers here - Clear Trend
Decode Range Candle
⦿ Both Buyers & Sellers here - No Trend
⦿ Indecision mode among participants.
⦿ Understand what major players did in the last candle to predict their next move.
⦿ Don't just memorise candle names; grasp the psychology behind them.
⦿ I'll share the levels of candle strength to elevate your candle reading.
♦️Stay tuned and follow for more educational
content.
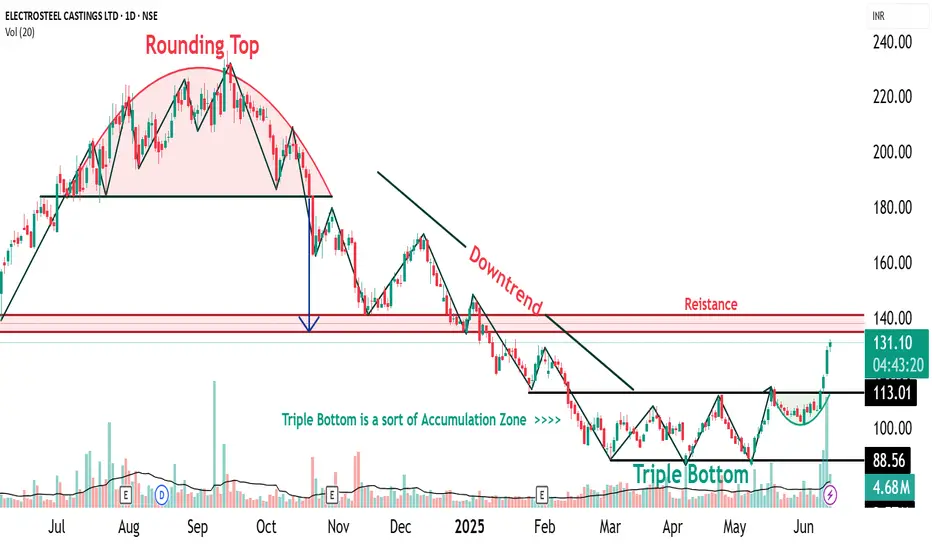
ELECTCAST Triple Bottom Pattern🔍 1. Understanding the Triple Bottom
The Triple Bottom is a classic bullish reversal pattern that typically forms after a prolonged downtrend or consolidation phase. It signifies strong buying interest at a consistent support level, leading to three distinct price lows (or “bottoms”) occurring near the same price zone.
📌 Key Characteristics:
Formation Time: Typically spans 2–6 months
Touchpoints: Three distinct lows formed at or near the same support level
Pattern Zone (for ELECTCAST): ₹87 – ₹88
Trade Entry: Entry is typically considered on a breakout above the neckline, which is the horizontal resistance connecting the interim highs between the bottoms. In this case, a breakout confirmation would be around ₹96.
Stop Loss (SL): Just below the third bottom, e.g., ₹85
Target: Based on pattern depth projection, conservative ₹104, aggressive potential up to ₹120–₹140, once momentum sustains
📉 2. Triple Bottom Formed at ₹87–₹88 Zone
Electrosteel Castings has tested the ₹87–₹88 level three times, showing that this price zone has acted as a strong accumulation support. The repeated defense of this level suggests significant buying interest by institutional players or informed investors.
1st Bottom: Initial rejection near ₹88
2nd Bottom: Retest with similar rejection zone
3rd Bottom: Confluence with bullish reversal candlestick (Morning Star)
The pattern is visually symmetric and clean, enhancing its reliability.
At the third bottom near ₹87, a Morning Star was observed, marking the first visual confirmation of bullish reversal. This adds significant strength to the pattern because the third bottom often acts as a psychological pivot point, triggering buying from traders watching for a reversal.
📈 3. Higher Top – Higher Bottom Structure Emerging
Following the Morning Star, the stock has started forming a higher bottom and higher top structure—a fundamental trait of an uptrend. However:
🟡 Caution: One more higher bottom formation is required to confirm the start of a sustainable uptrend.
Once the uptrend is firmly established, a close above ₹140 will act as a major breakout signal, potentially propelling the price toward new 52-week highs or an all-time peak.
🧠 4. Accumulation Zone and Triple Bottom – The Relationship
An Accumulation Zone is a price range where informed investors quietly accumulate shares over a period, usually when a stock is undervalued or consolidating.
🔗 Connection to Triple Bottom:
The Triple Bottom pattern often forms within the Accumulation Zone
Each dip to the support level attracts buyers, revealing hidden demand
The formation acts as a transition from accumulation to markup phase
The breakout from the Triple Bottom signals the end of accumulation and the start of an uptrend
Hence, the Triple Bottom is not just a technical pattern, but a visual representation of accumulation dynamics playing out.
📝 Disclaimer
This report is intended purely for educational and training purposes. It is not a recommendation to buy or sell securities. Always conduct your own research or consult a certified financial advisor before making trading decisions.