Bank Nifty Weekly Update & Key Levels📌 Weekly Recap:
Bank Nifty closed the week at 50,593.55, recording a strong gain of 5.27%.
Key Levels for the Upcoming Week
🔹 Price Action Pivot Zone:
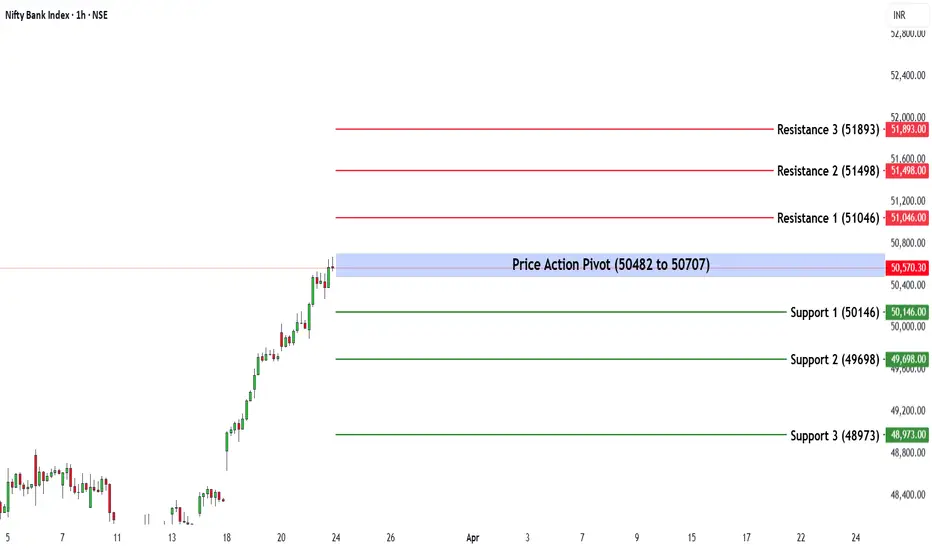
The crucial range to watch for potential trend reversals or continuation is 50,482 - 50,707.
🔹 Support & Resistance Levels:
Support:
S1: 50,146
S2: 49,698
S3: 46,956
Resistance:
R1: 51,046
R2: 51,470
R3: 51,893
Market Outlook
✅ Bullish Scenario: A sustained move above 50,707 could drive buying momentum, pushing Bank Nifty towards R1 (51,046) and higher.
❌ Bearish Scenario: If the index falls below 50,482, selling pressure may intensify, dragging it towards S1 (50,146) and lower support levels.
Disclaimer: This analysis is for educational purposes only. Investors should conduct their own research before making any trading decisions.
Candlestick Analysis
Kalyani Steels trendline breakout - D timeframeKalyani Steels after achieving the target of 1179.50 exited parallel channel and held support at 700 range. Bullish reversal happened at 704.20 (mar 3) and bullish reversal confirmation at 721 (mar 17). Dec 17 '24 ATH to Mar 3 '25 precisely 44.86% fall as anticipated. Now price chart in daily timeframe showing double bottom with inverted hammer (Mar 19) along with RSI double bottom breakout. Weekly chart piercing line (i think) candlestick pattern along with RSI +ve divergence.

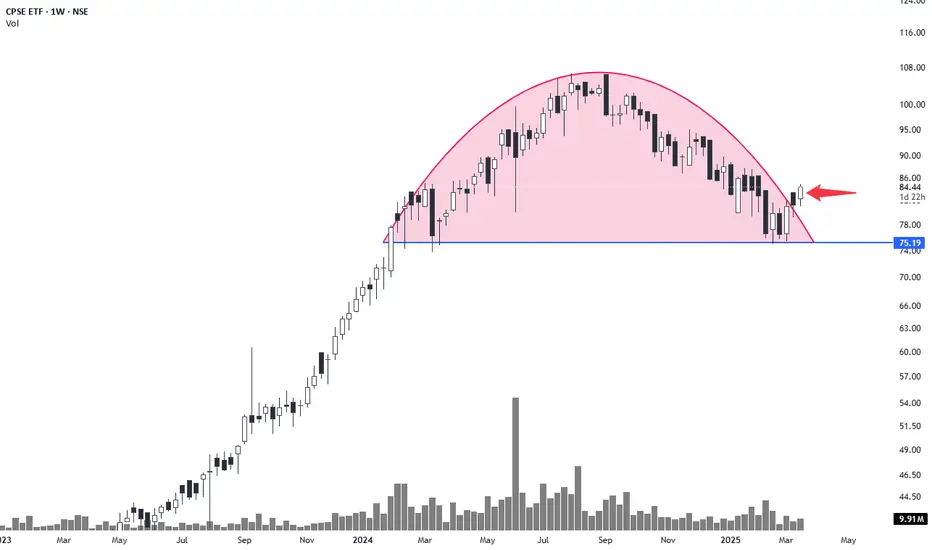
CPSE ETF Round Top BreakoutCPSE ETF breakout is happening from a rounding top pattern. Took support from previous long term lows 1 year back. Can it sustain the breakout and head towards the previous high is to be seen.
Nifty weekly analysis for 17/03/2025Nifty is trading between 100 EMA (weekly) and 20 EMA (daily). A good support from the weekly moving average is there and resistance on the daily charts.
A continuous support from 22300 level is there as the market has remained in a range whole week.
If the market tried to breach the support level, the support of weekly 100 EMA can be the other support around 22030 else it will take support around 21800.
In case the market starts to recover from the bottom and creates a higher high higher low formation it has to take out the resistance of 22650 and 22758.
Major levels are plotted in the charts. Just wait for the price action to confirm the entry into a trade else another sideways market can be seen.
Inside candle formation on the daily charts is also there and break out/down can be traded accordingly. Different trading approaches can help in capturing a good trade.
Wait for the price action near the levels before entering the market.

Positional or Longterm Opportunity in JSW EnergyGo Long @ 506.8 for Targets of 634.35, 709.75 and 777.4 with SL 439.15
Reasons to go Long :
1. On a Weekly timeframe if we draw the Fibonacci retracement tool from the recent swing low (point A) to the recent swing high (point B) then we see stock took support from the 0.5 Fibonacci level.
2. Besides, a bullish candlestick pattern Bullish Engulfing (marked with orange) is formed around the 0.5 Fibonacci level.
3. In addition to this there is a strong demand zone (marked with purple) which earlier was acting like resistance but now is providing support to the stock.

Positional Opportunity in AptusGo Long @ 304.15 for a Target of 382.6 with SL 278
Reasons to go Long :
1. On a Monthly timeframe if we draw the Fibonacci retracement tool from the recent swing low (point A) to the recent swing high (point B) then we see stock took support from the 0.618 Fibonacci level.
2. Besides, a bullish candlestick pattern Bullish Hammer (marked with orange) is formed around the 0.618 Fibonacci level.
3. Also there is a strong Trendline (marked with green color) which supports the stock.

Is Nifty still bearish?Nifty is still below support line. So is Nifty still bearish and the recent rally was short covering?

Coforge-A perfect watchlist stock!Coforge is an IT services company providing end-to-end software solutions and services and is among the top-20 Indian software exporters according to Screener data. Stock has give 20% compounded sales growth in last 5 years which is quite remarkable.
Hence, It can be a good stock to be kept in watchlist for medium to long term.
Stock had given breakout of cup and handle pattern in weekly time frame and is now retesting the same.
Stock has formed a kind of morning star pattern at the retest support zone. Need to watch if it sustains above this zone.
As you can see, retest zone also coincides with 50% fib retracement which makes it even stronger.
If we see good buying in this stock from here, we can see ATH levels soon and even bigger levels in coming years.
However, If stock goes below 61.8% retracement, it is not advisable to hold.

Nifty weekly analysis for 10/03/2025.Is this the end of the fall or its just a retracement. The market after a while has given some hope of a green week.
It is a retest or a base formation no body knows. Nifty is trading around 22550 levels and looks somewhat positive for the coming week.
Market is still in the down trend and bullish trend will only be confirmed once a 'W' pattern is formed on higher time frame or a break out is done.
On the hourly charts, market remained in a range for the last trading session, the sideways market can continue as it may form a base and trend reverses from here.
In case the market remains in the trend lower levels of 21800-850 might be coming. Else market may start travelling on the higher side hitting the resistance levels.
Major support levels :- 22310-360, 22050-090
Resistance levls :- 21620, 21760
A gap filling trade on the higher side can be seen in the coming week as a gap is pending.
Watch for the price action and trade accordingly. A sideway or volatile market is more probable as the market has been trading in a trend.

#SDBLFundamentals:
* ROCE - 19.4%, ROE - 18.4%. Debt to Equity - 0.21
* EPS / Revenue - has been steadily increasing
* FII/FPI have increased holdings from 0.56% to 0.90% in Dec 2024 qtr.
* Institutional Investors have increased holdings from 0.57% to 0.92% in Dec 2024 qtr.
* Promoters have increased holdings from 35.33% to 36.32% in Dec 2024 qtr.
Technicals:
* Bullish Candlestick Patterns - Closing Marubozu Uptrend / Long Line Uptrend
* Weekly Chart shows that 10 WEMA is crossing above the 20 WEMA
* On daily chart, there is a low risk entry available
* Two days of green candles Price is forming a tight action and emerging from a cup formation
* Volumes had declined while consolidating and with up move are now showing signs of increase
* RVOL and ADR is great and spiking
* Relative strength is strong / Momentum indicates steady maintenance / ADR is 5.8% and indicating up move
Good for positional trade. SIP type entry considering that market is pretty crazy as of now.
Note - Entry / SL / Target / Position size - Please figure out on your own based on risk appetite
Disclaimer - Your money requires your due diligence! I merely analyze and bring out probabilities. All the best.

Long Swing In PFC SPOTTED!After Correcting almost 40% from ATH.
Technical Analysis:
1. PFC has broken out of its Bearish Trend line with
2. Candle Stick Pattern shows Bullish Engulfing Pattern on
3.Weekly Time Frame (in formation) at
4. Demand Zone with
5. Bullish Divergent RSI on Daily Time Frame.
Above Factors Favour a Short Term Upmove.
Trade Details:
CMP 403
Buy Above 395
SL below 350
Target 460~470
Risk Reward Ratio - 1:2

JSWENERGY | Time to accumulate stocks nowJSWENERGY | Strong demand zone + Weekly 200 EMA
Not accumulating this following stocks for just trading, but for investment also.
CMP : 481

Monthly Breakout On RSI & TrendlinePlease check Monthly Trendline over RSI - From 2018 to 2025 RSI Trendline Breakout done Last month & Sustain in crusial month also
Second thing if we check Trendlines over Chart - Stock is taking regular support from 2014 to till date
if we check from 2021 to till date consolidation zone - Stock is going to breakout this zone (final conformation above 2080, for Safest Entry)
But as per current scenario and situation i thing kotakbank will be a good choice if market start upward direction

Mahindra & mahindraM&M itself focuses primarily on mobility products and farm solutions. It’s a titan in India’s automotive sector, renowned for rugged SUVs like the Scorpio, Thar, and XUV700, and holds a dominant position in utility vehicles with an 11.4% market share, competing with Tata Motors, Hyundai, Kia, and Maruti Suzuki.
Chart for your reference

Understanding Bullish & Bearish Candles FormationHello Traders!
In today’s post, we’ll be discussing the Candlestick Formation setup, which is essential for reading price action and identifying potential trend reversals. Candlestick patterns are a crucial tool for traders to understand market sentiment and predict future price movements. Let’s break down the two most common formations: Bullish Candlestick and Bearish Candlestick .
Bullish Candlestick Formation Setup
What is a Bullish Candlestick?
A bullish candlestick appears when the price closes higher than it opened. This formation suggests that buyers are in control and the price is likely to rise further.
Key Components of the Bullish Candlestick:
Body : The green section between the open price and the closing price . This is the main body of the candle, indicating the price movement during that time period.
Wicks : The thin lines above and below the body of the candle. The upper wick shows the highest price reached during the period, while the lower wick shows the lowest price.
Closing Price : The point at which the price closed for the trading period. A higher closing price indicates strong bullish momentum.
Open Price : The price at which the asset opened at the start of the trading period.
Low & High : The low is the bottom of the lower wick, and the high is the top of the upper wick.
When to Look for Bullish Candlesticks?
A bullish candlestick typically forms at the bottom of a downtrend, indicating a potential reversal or continuation to the upside. It’s a signal that the market is gaining upward momentum.
Bearish Candlestick Formation Setup
What is a Bearish Candlestick?
A bearish candlestick forms when the price closes lower than it opened. This indicates that sellers have control, and the price might continue to fall.
Key Components of the Bearish Candlestick:
Body : The red section between the open price and the closing price , representing downward price movement during the period.
Wicks : Similar to the bullish candlestick, the upper wick shows the highest price during the period, and the lower wick shows the lowest.
Closing Price : The point at which the price closed during the period, showing the downward momentum of the asset.
Open Price : The price at which the asset opened, showing the start of the downward movement.
Low & High : The high is at the top of the upper wick, and the low is at the bottom of the lower wick.
When to Look for Bearish Candlesticks?
A bearish candlestick typically forms at the top of an uptrend, signaling a possible trend reversal or a continuation to the downside. It suggests that selling pressure is building up.
Key Differences: Bullish vs Bearish Candlesticks
Bullish Candlestick:
The close is above the open .
Indicates upward price movement or buying strength.
Appears during a downtrend reversal .
Bearish Candlestick:
The close is below the open .
Signals downward price movement or selling pressure.
Appears during an uptrend reversal .
Trading with Candlestick Formations
Confirm the Trend : Look for candlestick formations at key levels, such as support and resistance, or after a strong uptrend or downtrend.
Use Multiple Candles : Don’t rely on just one candlestick. Look for multiple bullish or bearish candles to confirm the direction.
Combine with Other Indicators : Use candlestick patterns in conjunction with technical indicators like RSI, MACD, or moving averages for stronger confirmation.
Pay Attention to Volume : High volume with a bullish or bearish candlestick gives more weight to the signal.
Conclusion
Candlestick formations are one of the most powerful tools in a trader’s arsenal. By understanding the bullish and bearish setups, you can predict market movements and make informed decisions. Remember, always confirm the pattern with other indicators and never trade based on just one candlestick.
What candlestick patterns do you use in your trading strategy? Let me know in the comments!

Positional or Long term Opportunity in Shipping Corp Of IndiaGo Long @ 205.7 for Targets of 241.1 and 276.5 with SL 188
Reasons to go Long :
1. On a Weekly timeframe if we draw the Fibonacci retracement tool from the recent swing low (point A) to the recent swing high (point B) then we see stock took support from the 0.618 Fibonacci level.
2. Besides, a bullish candlestick pattern Bullish Hammer (marked with orange) is formed around the 0.618 Fibonacci level.
3. Also there is a strong Trendline (marked with green color) which supports the stock.
4. In addition to this there is a strong support zone (marked with purple) from which the stock is taking support.


Mastering the Three White Soldiers Pattern: A Bullish ReversalHello Traders!
I hope you're doing great in your trading journey! Today, we will be diving into the Three White Soldiers chart pattern, a powerful bullish reversal pattern that can help you spot a potential trend shift. This pattern typically occurs after a downtrend, signaling a strong reversal. If you can spot it early, it offers a high-reward trading opportunity. Let’s break down the pattern and how to use it effectively.
What is the Three White Soldiers Pattern?
The Three White Soldiers pattern consists of three consecutive long bullish candles that close progressively higher. This pattern typically appears after a downtrend and signifies a potential reversal. The pattern shows a strong shift in market sentiment, where buyers are stepping in to push the prices higher.
Key Characteristics of the Three White Soldiers Pattern
Trend Reversal: The pattern forms after a strong downtrend, signaling a potential trend reversal.
Three Consecutive Bullish Candles: The pattern consists of three long bullish candles, each closing higher than the previous one.
Strong Closing Prices: Each candle should close near its high, indicating strong buying pressure.
Volume Confirmation: The pattern is more reliable when accompanied by increasing volume, showing strong interest in the reversal.
How to Trade the Three White Soldiers Pattern
Entry Point: Consider entering a long position once the third candle closes, confirming the reversal.
Stop Loss: Place your stop loss below the low of the first candle in the pattern to limit potential losses.
Profit Target: For setting targets, measure the height of the pattern (distance between the low of the first candle and the high of the third candle) and project this distance upwards from the entry point to set your profit target.
Real-World Application: TCS Case Study
In the chart of Tata Consultancy Services (TCS) , we see a clear Three White Soldiers pattern forming after a downtrend. The price closed progressively higher over three consecutive days, breaking key resistance levels and signaling a potential bullish trend. Traders entering after the confirmation of the pattern would have witnessed a substantial upward move, with a clear Stop Loss and Profit Target in place.
Risk Management Considerations
Position Sizing: Adjust your position size according to your risk tolerance and overall portfolio.
Stop Loss Placement: Place your stop loss below the low of the first candle to manage risk in case the pattern fails.
Volume Confirmation: Confirm the pattern with increasing volume to ensure the strength of the reversal.
What This Means for Traders
The Three White Soldiers pattern is an excellent tool for identifying trend reversals and can be a powerful signal when used in conjunction with other technical indicators. Remember to always look for confirmation with volume and manage your risk effectively.
Look for the pattern after a significant downtrend to identify potential bullish reversals.
Use volume to confirm the strength of the pattern and increase the reliability of your trade.
Implement stop loss placement to minimize risk while targeting a favorable risk-to-reward ratio.
Conclusion
The Three White Soldiers pattern is a reliable bullish reversal signal that can offer excellent trading opportunities when combined with other technical indicators. By understanding its key characteristics, waiting for confirmation, and managing risk appropriately, you can increase your chances of making profitable trades.
Have you traded using the Three White Soldiers pattern?
Share your thoughts and experiences in the comments below! Let’s keep learning and improving our trading strategies!

Three Black Crows: How to Spot and Profit from Bearish ReversalsHello Traders!
I hope you’re all doing great! Today, we’ll discuss the Three Black Crows candlestick pattern, one of the most reliable bearish reversal patterns you can find in technical analysis. If you're serious about identifying potential trend reversals, understanding this pattern is essential.
The Three Black Crows is a powerful bearish signal that typically marks the end of an uptrend. It consists of three consecutive long red (or black) candles that close progressively lower, showing strong selling pressure and a shift in momentum. This pattern is particularly effective when it forms at a key resistance level, and it can lead to significant price declines.
What is the Three Black Crows Pattern?
The Three Black Crows candlestick pattern signals the reversal of an uptrend. The pattern forms when:
The first candle is a large red candle, closing near the low of the day.
The second candle opens below the first one and closes lower.
The third candle opens lower than the second one and closes near its low.
Each candle in the sequence is characterized by strong bearish price action, and their alignment suggests that bears are gaining control.
Key Characteristics of the Three Black Crows Pattern
Bearish Trend Reversal: Three long red candles following an uptrend suggest a shift in momentum from buyers to sellers.
Strong Resistance Zone: The pattern is more reliable when it forms near a strong resistance level, where the price has struggled to move past in the past.
Closing at the Low: Each of the three candles closes near their respective lows, showing increasing selling pressure.
Volume Confirmation: Volume should ideally increase with each successive candle, confirming that bears are taking control.
How to Trade the Three Black Crows Pattern
Entry Point: After the formation of the third candle, consider entering a short position once the price breaks the low of the third candle. This confirms the bearish trend.
Stop Loss: Place your stop loss just above the high of the third candle to minimize risk in case of a false breakout.
Profit Target: Measure the distance from the high of the pattern to the low of the third candle. Project this distance downward from the breakout point to estimate your profit target.
Real-World Application: Tata Consultancy Services Case Study
In the chart of Tata Consultancy Services (above), we can see a classic example of the Three Black Crows pattern. The price formed a resistance zone and then saw the three consecutive bearish candles break the support, confirming the bearish trend reversal. The huge fall after the pattern’s confirmation indicates the power of this candlestick formation.
Risk Management Considerations
Position Sizing: Adjust your position size based on your risk tolerance and make sure it fits within your overall portfolio strategy.
Stop Loss Placement: Place your stop loss above the third candle to avoid potential losses from a false breakout.
Confirmation with Volume: Always wait for volume confirmation before entering the trade. Volume should increase as the pattern forms.
What This Means for Traders
The Three Black Crows is an excellent pattern to spot potential trend reversals, especially after an uptrend. This pattern works best when combined with other technical indicators like trendlines, support and resistance, and moving averages to confirm the trend reversal.
Look for the pattern at resistance levels to identify high-probability bearish reversals.
Confirm with volume to increase the reliability of the pattern.
Use proper stop loss placement to manage your risk and ensure a favorable risk-to-reward ratio.
Conclusion
The Three Black Crows candlestick pattern is a reliable bearish reversal signal that can help traders capitalize on price declines. By identifying the pattern correctly, waiting for confirmation, and applying solid risk management strategies, you can improve your trading success.
Have you traded using the Three Black Crows pattern?
Share your experiences in the comments below! Let’s keep learning and growing together!

Weekly Wrap idea Got Confirm. Tradeplan #Nifty50 18th Feb2025First Step of a successful trader is to build a Trade plan & review what he has done. (education purpose for all )
*Trend is rangbound, Short term Bullish.
*Trade plan: Buy on dip.
*for Critical levels see the video
Jai Hind.
Disclaimer :
This video is only for educational purposes. Please consult your financial advisor before you take any trade.

Long In SBICARDEntry- 815-818
Stop- 800
Target- 840, 860,
Pattern- Falling trendline BO with a bullish engulfing in 4hr Time frame.
Note- This stock has been underperforming for a long time. It may continue its upward journey
* Please trade carefully seeing the current market structure the trend is to be cautious.
Disclaimer- This is just for education purpose please take advice from your financial advisor before making any decision.
Jai Shree Ram.

SRM CONTRACTORS - At Channel Support The stock has been travelling in an ascending channel respecting the borders in 4 previous instances. Within the channel, we have seen how the stock price action has been repeating itself. As the saying goes history repeats itself, this time again the stock has shown strength at the channel support which in my opinion seems to be indicating a possible rally towards the upper border of the channel. Only time will tell.
Company has reduced debt.
Company is expected to give good quarter
3 Years ROE 34 %

Nifty 50: Market Structure Break on 60-Hour TimeframeMarket Structure Break: The 60-minute timeframe shows a clear structural break, pushing prices into a premium zone.
Premium to Discount Retracement: Given the overextended nature of the premium zone, a retracement to a discount zone is expected.
Potential Reversal: The retracement could lead to a reversal, where market momentum shifts, creating a more balanced trading environment.
Consolidation Point: The market is likely to consolidate around the 23400 level, a critical juncture that corresponds with the FVG and discount zone, serving as a potential springboard for future upward movement.
Traders should monitor the price action closely in the discount zone for signs of reversal confirmation.
