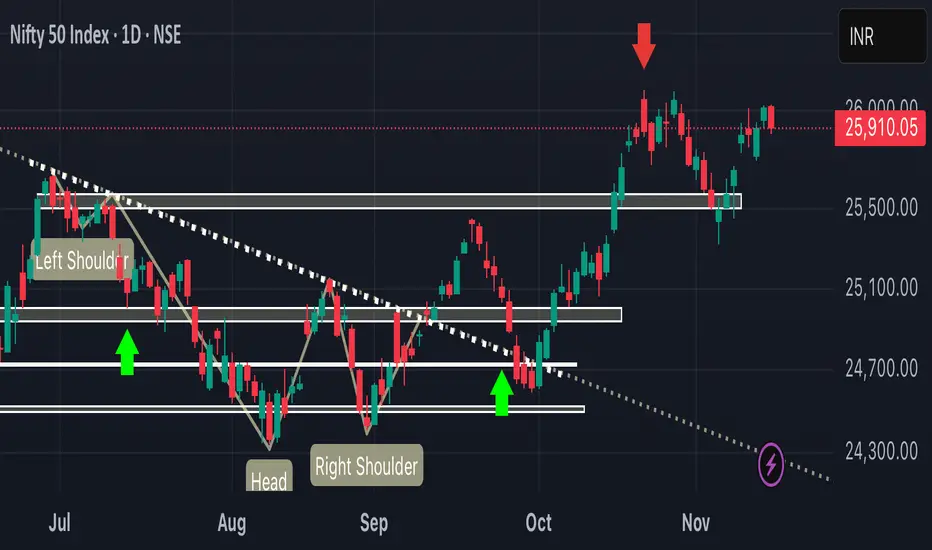
Bears Knocking, Then Reversal ? Weekly Wrap #Nifty50First Step of a successful trader is to build a Trade plan & review what he has done. (education purpose for all )
*Trend is rangbound, Short term Bearish.
*Trade plan: Sell on rise
* Critical Levels:
* Resistance:26135- 26200
* Support: 25960-25853
Jai Hind.
Disclaimer :
This video is only for educational purposes. Please consult your financial advisor before you take any trade.
Candlestick Analysis

Unidirectional move is yet to come! As we can see NIFTY has finally broken above 26100 level and has managed to close itself above the given level. Moreover it has broken the neckline of inverted head and shoulders pattern showing signs of strong upmove so plan your trades accordingly and keep watching everyone.

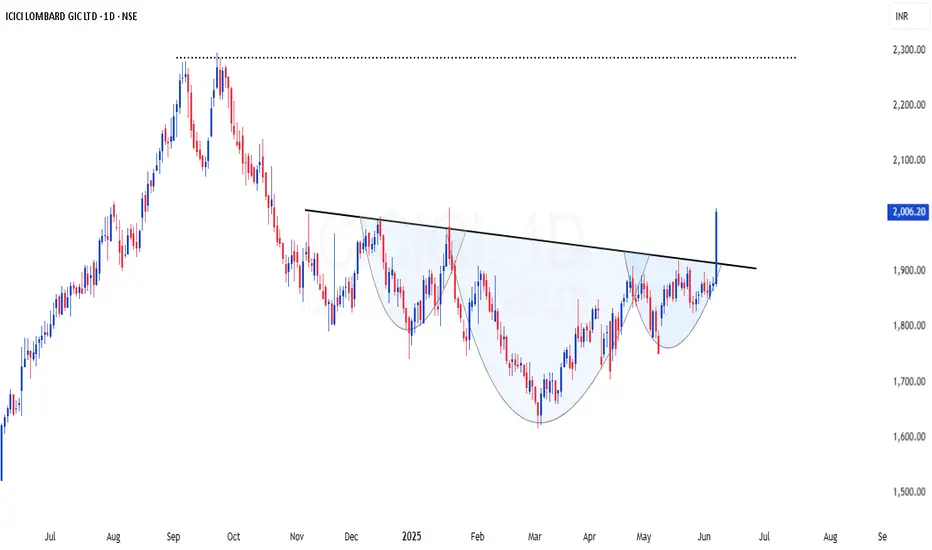
ICICIGI | High probable INHS setup - Looks good for 20-40%ICICIGI | High probable INHS setup - Looks good for 20-40%
CMP : 2006 (Dip : 1930)
SL : 1800
The stock has confirmed a classic inverted Head & Shoulders pattern on the daily chart, signaling a strong trend reversal.
✅ Breakout above neckline with decent volume, adding conviction to the move.
🎯 Immediate Target: 2300
🎯 Second Target (as per Fibonacci extension): 2700
📉 Pattern: Inverted H&S
📈 Volume: Supporting the breakout
📊 Bias: Bullish
This could be an excellent area of value for swing traders looking to ride the trend. A retest of the neckline could offer a second entry opportunity with a good risk-reward ratio.
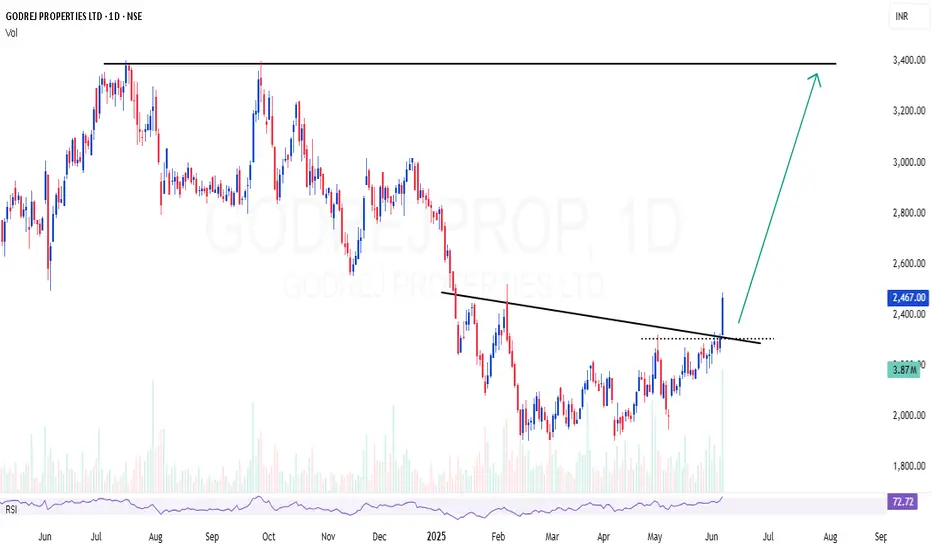
GODREJPROP | Nice breakout with volume, looks good for 40-45% GODREJPROP | Nice breakout with volume, looks good for 40-45%
CMP : 2467 (Dip : 2300)
SL : 2100
Target : 3400
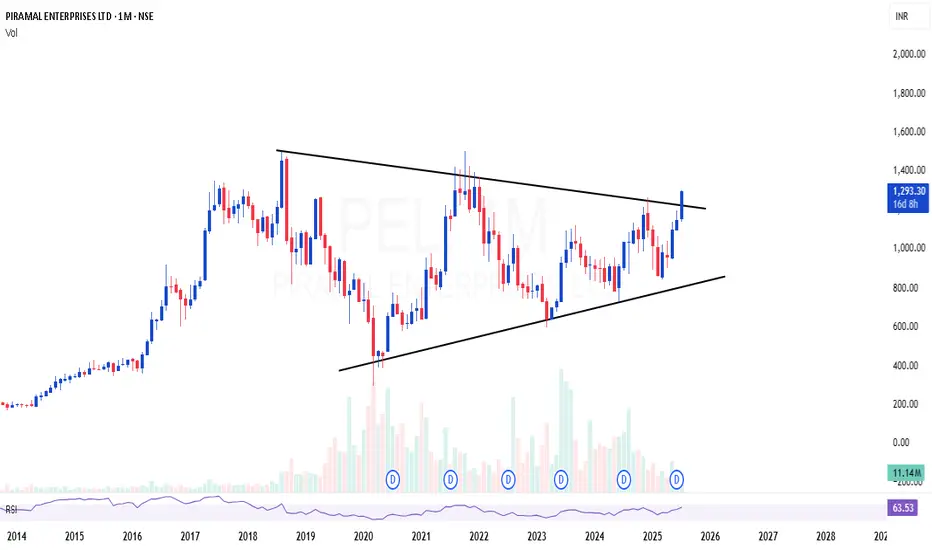
PEL | Triangle breakout after 7 years consolidationPEL | Triangle breakout after 7 years consolidation
CMP : 1293 (Dip : 1150)
SL : 1000
P
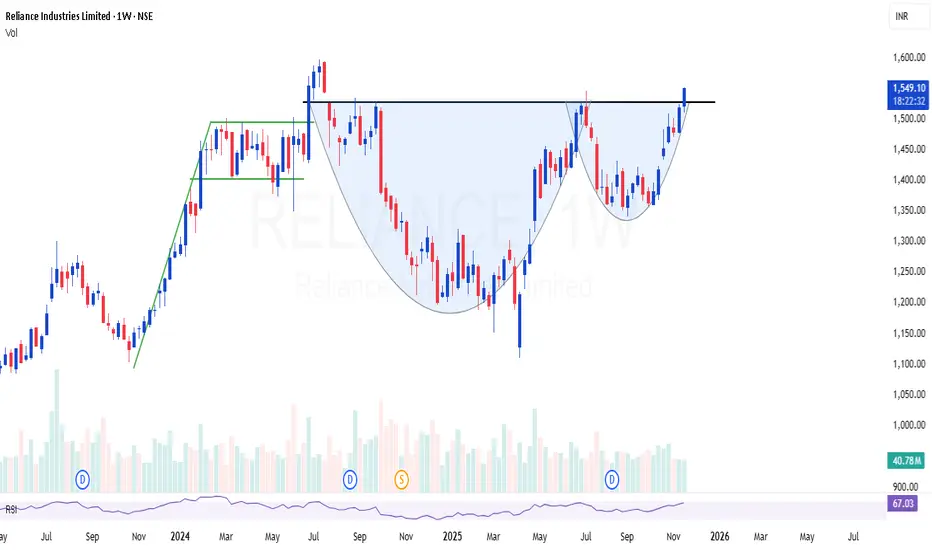
RELIANCE | Perfect cup & handle setup - Looks very strong 30%RELIANCE | Perfect cup & handle setup - Looks very strong for 30% short term
Last time the flag breakout disappointed, but this time Cup & handle will restore the faith i believe
Looks like 2026 is going to be a large cap year !
KOTAKBANK
RELIANCE
TCS
INFY
index heavy weights are super bullish
SBIN looking bullish on the weekly charts. (18/08/2025)State Bank of India is trading around the resistance zone after convincingly breaking the trendline and taking support from the weekly moving averages.
The stock has closed at 826.55 this week gaining 2.77% week on week.
If the stock starts trading above 833, there are chance of it travelling till 860 levels in the coming month.
SBIN has posted good result as well.
Major resistance :- 833, 865
Entry :- Above 833
SL :- Below 818
The stock looks bullish on the daily and the weekly charts.
Wait for the stock to close above the resistance levels on the daily chart frame.

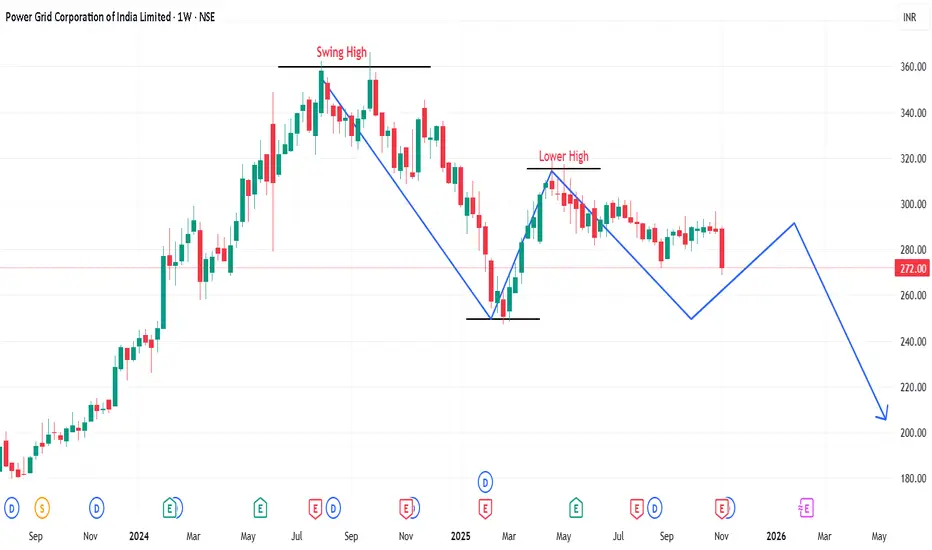
Will Powergrid showing sign of exiting it??Power Grid has been trading in a range for a while and it is showing sign of some weakness.
Major Trend - Down Trend
As there is a BoS of the previous market cycle.
Minor Trend - Sideway to range bound.
The market tends to retest the swing low in the coming month.
Stock has taken a strong resistance from 20 & 50 EMAs. Weekly close is below 100 EMA.
If the stock follow through the downside movement, entry for a sell trade is there with a 1:2 R:R ratio.
Entry :- 270
Stop Loss :- 279
Target :- 259
Last week the index too has supported the fall. If the index remains negative, full quantities can be punched around 270, in case of a retest half quantities can be sold around the retest and the price action near resistance levels while remaining quantity to be entered once the price action is in our favor.
Premier Polyfilm Ltd – Inverted Hammer Reversal at Key SupportStrong Bullish Candle After Multi-Month Downtrend
Premier Polyfilm has printed a bullish Inverted Hammer at a major support zone after a prolonged decline — a classic early reversal signal on the weekly timeframe. The stock has been falling consistently for months, and this week’s sharp +12% bounce shows strong buying interest returning near the demand zone of ₹34–₹36.
Price is now closing above the minor resistance zone (₹40–₹43). If sustained, the stock may attempt a short-term trend reversal.
RSI also shows a bullish uptick from oversold territory, supporting the possibility of a relief rally.
🎯 Key Technical Levels
CMP: ₹43.00 (+12.33%)
Immediate Resistance: ₹49–₹52
Major Resistance Zone: ₹73–₹80
Support Zone: ₹34–₹36
Major Support: ₹30
Swing SL: Close below ₹35 (weekly basis)
📈 Technical View
A clean Inverted Hammer candle formed exactly at support → early reversal signal.
RSI bouncing sharply from oversold (14–20 range).
Price reclaiming the small demand zone around ₹40–₹43.
Trend is still down, but first signs of exhaustion are visible.
Sustaining above ₹43 could lead to a move toward the 20-week EMA and the ₹49–₹52 area.
🧠 View
Premier Polyfilm has shown its first strong bullish candle after several months of selling pressure. The combination of Inverted Hammer + support + RSI reversal makes this an early-stage reversal watch. A weekly close above ₹43 strengthens the case for upside toward ₹49–₹52, and potentially ₹70+ on a medium-term basis.

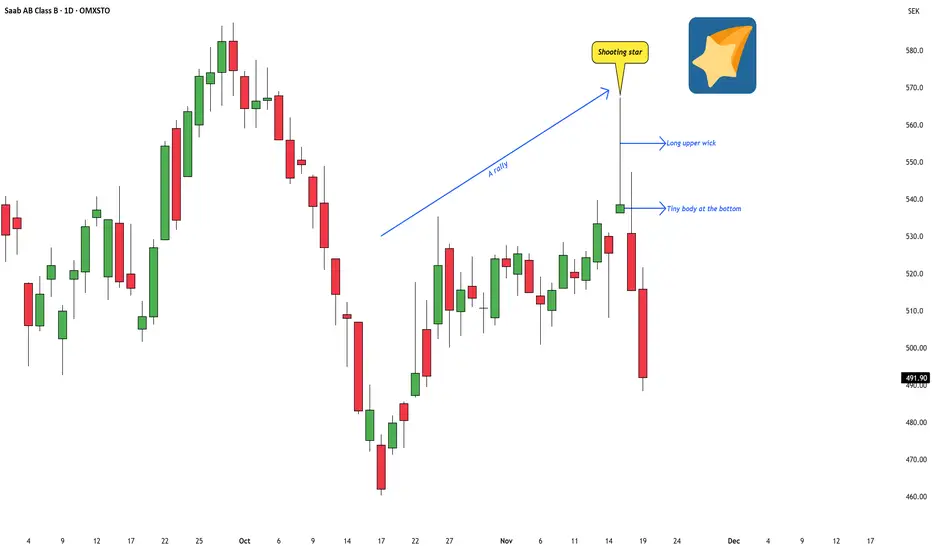
Identifying a Shooting Star Pattern on the ChartI was tracking a Swedish stock recently, and a very clean candlestick pattern popped up — a textbook shooting star.
The stock is Saab AB, a major Swedish company involved in military defense, commercial aviation, and civil security. Their operations span aircraft development, missile systems, naval platforms, surveillance systems, and a wide range of high-tech engineering services. In short, it’s one of Sweden’s core defense and aerospace names.
While going through the chart, this particular candle stood out because it matched the classic structure described in Japanese candlestick literature:
a tiny real body near the bottom,
a long upper wick,
and it formed after a short-term rally.
These are the key ingredients that define a shooting star.
From an educational perspective, the psychology behind this pattern is simple but powerful: the market pushed sharply higher during the session, could not sustain those higher levels, and slipped back toward the open. The candle itself captures that shift in momentum.
In classical candlestick theory, when a shooting star forms after an upswing , it often suggests that bullish strength may be fading and that the trend could be losing momentum. It doesn’t guarantee a reversal, but it does act as a visual warning sign — a moment where the advance pauses, hesitates, or becomes more vulnerable.
This post is simply to highlight how a shooting star looks on a real chart and what it typically represents in terms of market behaviour. No forecasts or trade ideas — just a clean educational example of the pattern in context.
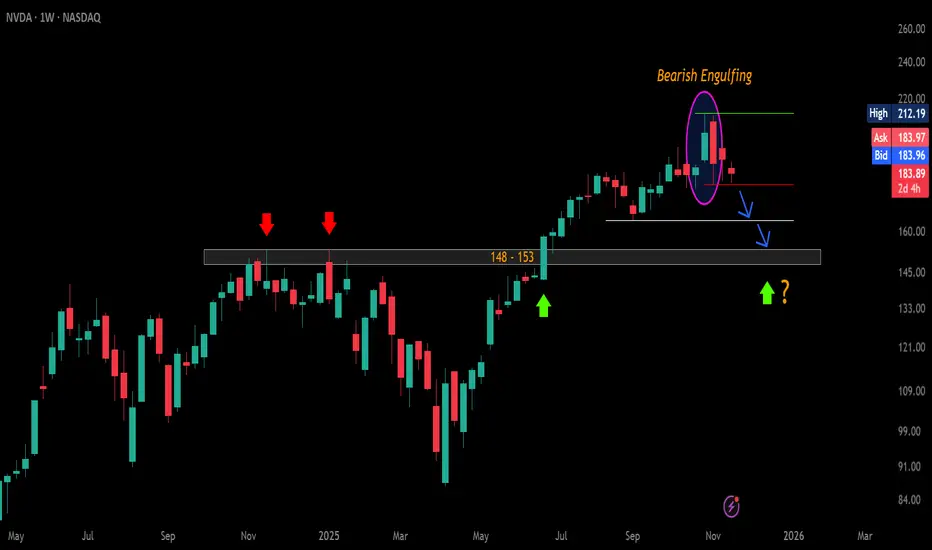
$NVDA – Weekly Bearish Signal Triggering?CMP: $184
NVDA has formed a Bearish Engulfing on the weekly chart and is currently trading inside the engulfed candle.
A WCB / sustained break below $178.91 will confirm the pattern → likely dragging price toward $164 and the major $153–$148 breakout-retest zone . 🔻
A WCB above the ATH $212.19 will invalidate the pattern and signal a fresh uptrend. 🚀
📌 Note: Q3 earnings to be announced post-market. 🕒
Bias: Short-term bearish, HTF bullish if $148–$153 holds. 💚
#USMarket #NVDA #Stocks #TechnicalAnalysis #PriceAction #BearishEngulfing
📌 #Disclaimer: This analysis is shared for educational purposes only. It is not a buy/sell recommendation. Please do your own research before making any trading decisions.
Strong upmove coming up above 26100!As analysed, following the structure, we can still see NIFTY in more like an inverted head and shoulders pattern which is a strong bullish pattern. Hence now that it has managed to close above 26000 which has already been tested multiple times before can now show a very strong upmove above 26100 which is a neckline of the structure so one can go long if breaks above given level so plan your trades accordingly and keep watching everyone.
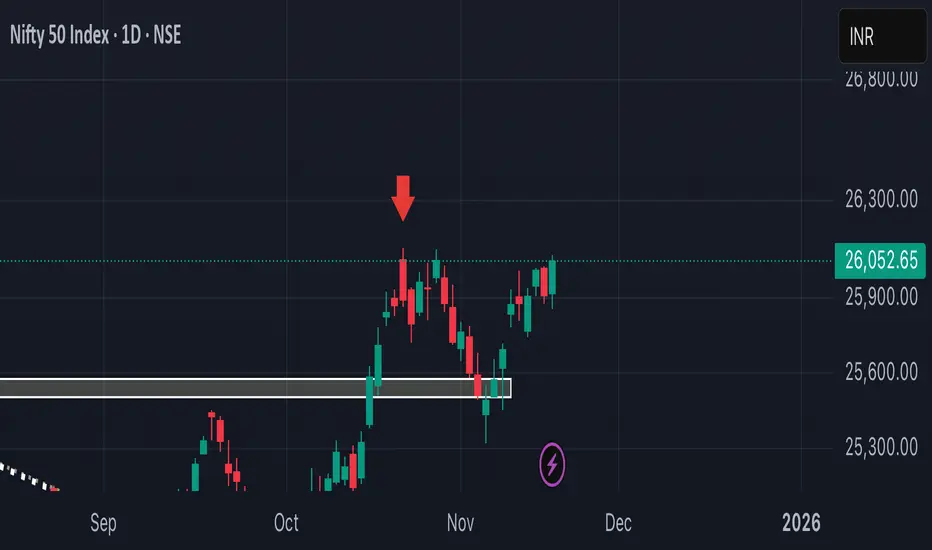
NIFTY got rejected from 26000! Weekly closing needed.As we can see NIFTY got rejected exactly from psychological level and important supply zone. Moreover, we can see it has been forming more like inverted head and shoulder pattern in bigger time frame. Any strong closing above 26000, can show strong upmove but until that we may see sideways to weak market so plan your trades accordingly and keep watching everyone .

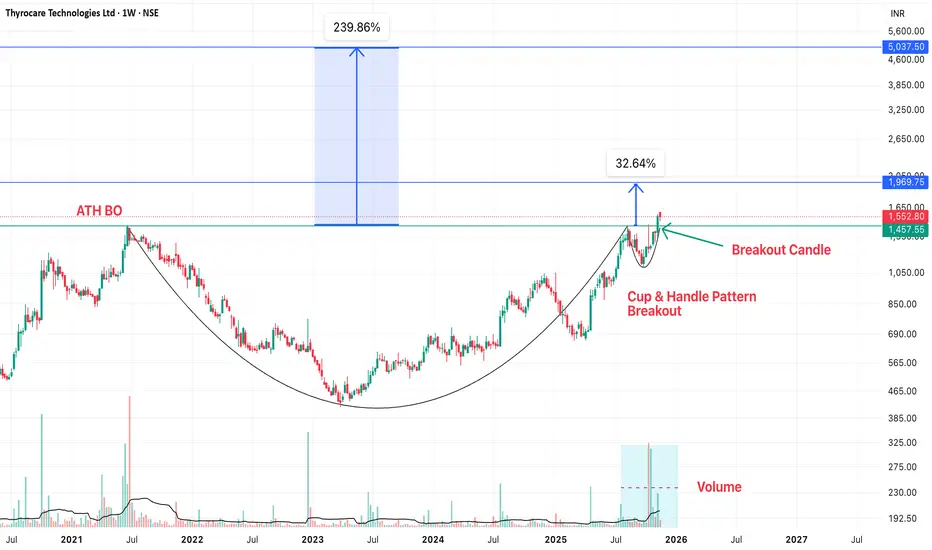
Thyrocare - Cup & Handle Breakout on Weekly Time FrameThyrocare has given a Cup & Handle Breakout on weekly time frame. Factors which will lead to 40%-200% return:
1. Cup & Handle breakout pattern
2. ATH Breakout
3. Volumes has picked up at Breakout
4. Fundamentally, super results in Q2 and best sales ever
Stock looks super fundamentally and technically. Must in your portfolio.
Keep following @Cleaneasycharts as we provide Right Stocks at Right Time at Right Price.
Cheers!!!
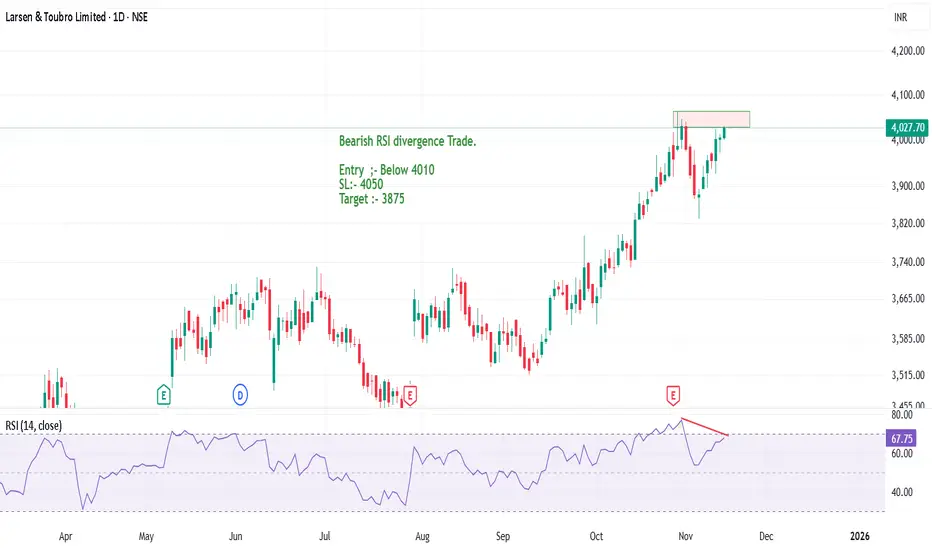
L&T forming a new high or Double Top pattern?Larsen & Toubro is showing a strong bearish RSI divergence on the daily charts. There can be an opportunity to sell the stock in coming trading sessions.
The stock has performed fabulously and good returns has been yeilded by the stock.
If there is a bearish price action, a double top pattern confirmation, good R:R trade can be capture in the stock.
Entry :- Below today's low (4000)
Stop Loss :- 4055
Target :- 3875
A swing trade can be initated in the stock with Target 1 as 3875 and trailing SL for next target upto 3780.
Target 2 can also be made with the help of the 50 EMA.
In case price tries to form a new high is can be shorted only when there is some negative sentiment and price action in the stock.
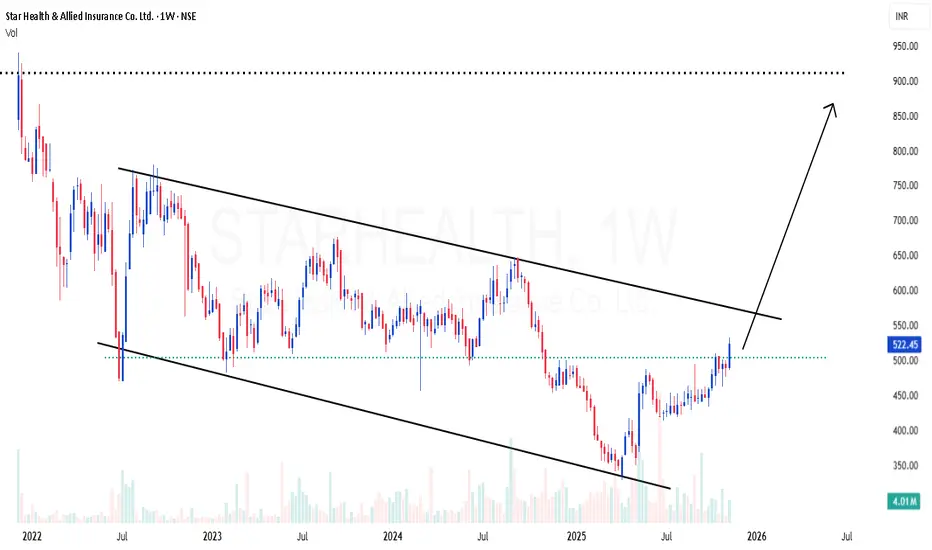
STARHEALTH | Strong channel breakout ahead with good risk rewardSTARHEALTH | Strong channel breakout ahead with good risk reward
CMP : 522
SL : 460
Target : 900+
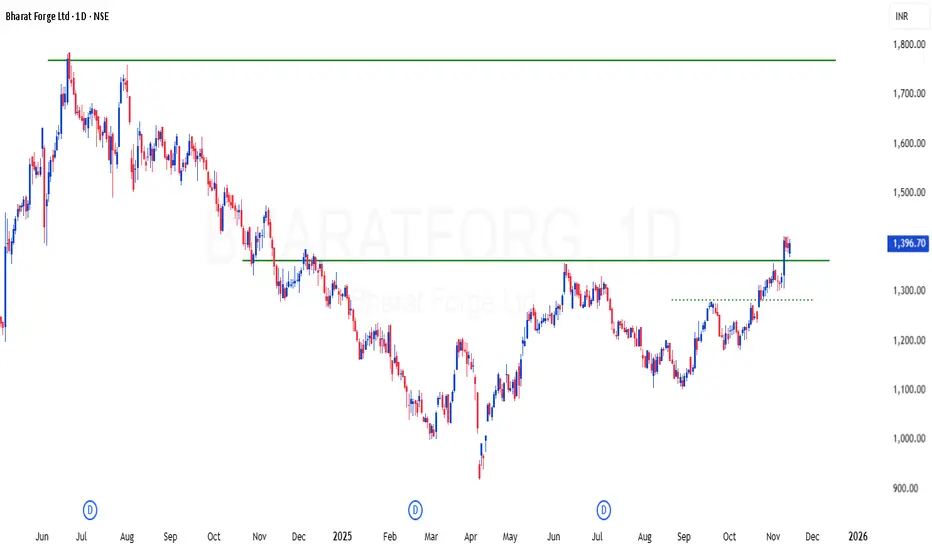
BHARATFORG | Simple Supply and demand play - Looks good for 25%BHARATFORG | Simple Supply and demand play - Looks good for 25%
CMP : 1396 (Dip : 1300)
SL : 1250
$Gold: Breakdown or Bounce?🔻 #Gold Breakdown or Bounce? 🔺
Price tested a critical level (upward sloping trendline - Breakdown Retest ) after a bearish engulfing and is now pulling back. Will the breakdown continue, or can bulls reclaim control? 👀
Trendline break 🚨
Breakdown retest ⚠️
Key levels to watch:
🚧 Resistance: $4099.40 - $4126.08 / $4185.91 - $4195.21 / $4355.80 - $4381.44
🛡 Support: $4024.53 / $3932.10 - $3930.62 / $3953.00
Below $3953 → opens downside toward $3500.20–$3432.84 📉
Between ATH & $3953 → market likely stays trendless/choppy ⚖️
TVC:GOLD #Gold #XAUUSD #Forex #BearishEngulfing #CandleStickPatterns #BreakdownRetest #BearishReversal #PriceAction #ForexTrading
📌 #Disclaimer: This analysis is shared for educational purposes only. It is not a buy/sell recommendation. Please do your own research before making any trading decisions.

#Silver Alert: Double Top Breakdown Incoming?🚨 Double Top on XAGUSD daily chart:
1️⃣ First Top: Bearish Engulfing
2️⃣ Second Top: Dark Cloud Cover
Pattern confirms DCB 🔻 below $45.55 , 🎯 targeting $36.71 .
🚧 Resistance: $52.32 - $54.49
🛡 Support: $50.62, $49.38 - $48.91, $47.17 - $46.90
⚠️ Major sell-off potential. Longs only above Double Top high after 2 consecutive closes.
#Silver #XAGUSD #DoubleTop #TechnicalAnalysis #BearishReversal #ChartPatterns #CandlestickPatterns #PriceAction
📌 #Disclaimer: This analysis is shared for educational purposes only. It is not a buy/sell recommendation. Please do your own research before making any trading decisions.

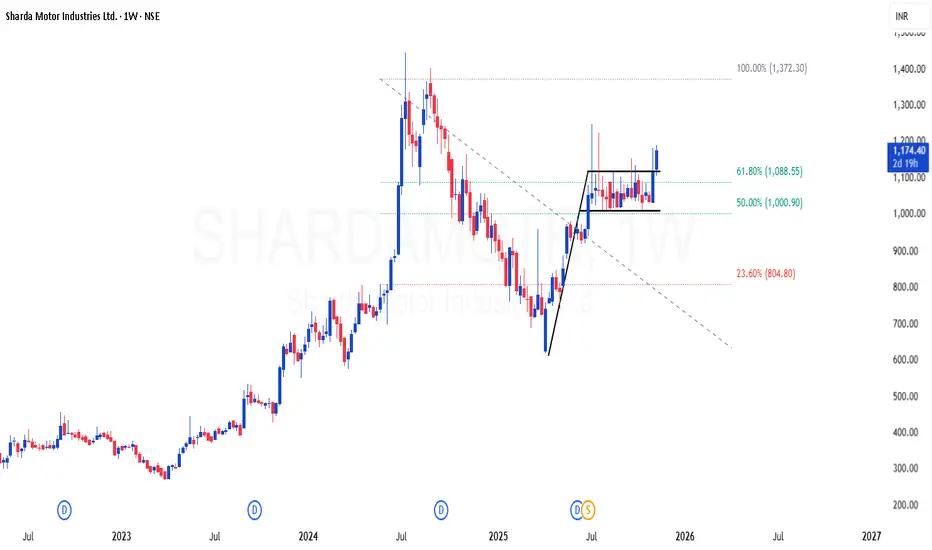
SHARDAMOTR | Nice flag breakout in weekly time frameSHARDAMOTR | Nice flag breakout in weekly time frame
CMP : 1170 (Dip : 1000)
SL : 900
Target : 1800 (based on fib)
XAUUSDGold is almost at the Supply. There might be possibility of reversal from here. Buy side liquidity is done. Now it can start targeting sell side Liquidity.

XAUUSDGold is in bullish phase. It can retrace back to the demand zone in near future. Keep patience and wait for it to tap into the demand. Target whatever the recent new high would be, just above that.
