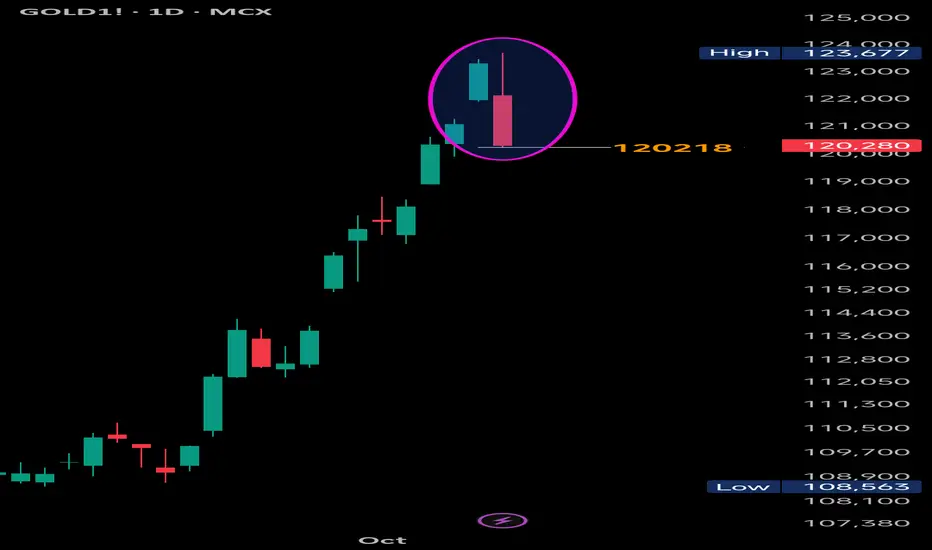
Gold: Bearish Engulfing – Is the Top In?Gold View:
Potential temporary top may be forming in Gold, marked by a strong Bearish Engulfing pattern on the daily chart. While it’s still early to confirm a full reversal, price action suggests caution for bulls.
✅ Confirmation:
A daily close below today's low 120,218 , especially with increased volume, would confirm the pattern and likely trigger further downside momentum.
❌ Negation:
If Gold manages to close above 123,677 (today’s high), the bearish structure will be invalidated.
🎯 Key Levels to Watch:
Resistance: 123,677 (pattern high)
Support: 120,218 (pattern low)
Stay alert for follow-through candles and volume spikes in coming sessions.
#Gold | #XAUUSD | #BearishEngulfing | #CandlestickPatterns | #TechnicalAnalysis | #PriceAction | #GoldAnalysis
📌 Disclaimer: This analysis is shared for educational purposes only. It is not a buy/sell recommendation. Please do your own research before making any trading decisions.
Candlestick Analysis
TITAN COMPANY LIMITED ( 1D ) 🎯 TRADING PLAN 🎯
✔ Price Action shows strong
Resistance at the 61.80% Fibonacci
Retracement with a Bearish Harami
Candlestick Pattern.
✔ RSI being Overbought adds weight to
The setup.
💡 Trade your plan not your emotion.
Disclaimer : All information is for
Educational & Informational
Purpose only. Not a buy / sell
Recommendation. You are
Solely responsible for your
Trading & Investment decision.

National Aluminium Co. Ltd (NALCO) – 1HMarket Structure:
Price is currently in a bullish trend with a clear BOS (Break of Structure) on the 1H timeframe. After showing strong displacement to the upside, the market is expected to retrace into a discount zone before continuing bullish expansion.
POI (Point of Interest):
A demand zone is identified around ₹214–₹215, aligning with previous structure support and unmitigated bullish order block. Price may revisit this zone to collect liquidity and rebalance inefficiency.
Liquidity & FVG Analysis:
Liquidity Sweep: Sell-side liquidity below ₹216–₹217 could be targeted next.
Fair Value Gap: Exists between ₹216–₹220 — a likely magnet for re-entry before expansion.
Scenarios (As per the 3 projected paths):
Red Path: Aggressive continuation after shallow retracement — short-term bullish impulse.
Purple Path: Controlled pullback and BOS confirmation before bullish leg.
Black Path: Deep liquidity sweep into POI (~₹214) followed by a strong reversal.
Trade Setup:
Entry Zone: ₹214–₹215 (after bullish reaction confirmation).
Stop Loss: Below ₹199 (structural invalidation).
Target: ₹248+ (premium zone and equal highs).
Bias: 🟢 Bullish – Looking for liquidity sweep and continuation to premium range.
Confirmation: Wait for a lower timeframe BOS (M15–M5) within POI before entry.

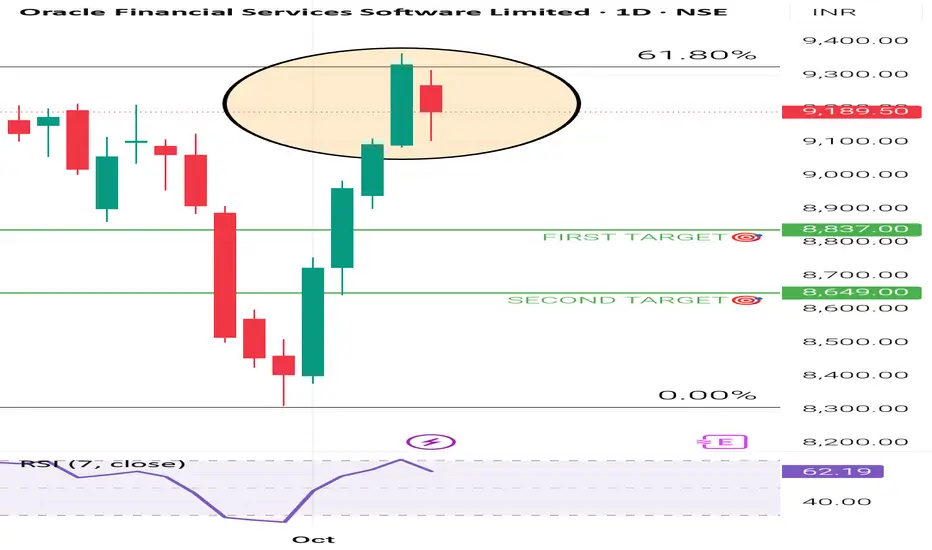
ORACLE FINANCIAL SERVICES SOFTWARE ( 1D ) 🎯 TRADING PLAN 🎯
✔ Price Action shows strong
Resistance at the 61.80% Fibonacci
Retracement with a Bearish Harami
Candlestick Pattern.
✔ RSI being Overbought adds weight to
The setup.
💡 Good Trader's focus on protecting their
Money. Bad Trader's focus on making
Money.
Disclaimer : All information is for
Educational & Informational
Purpose only. Not a buy / sell
Recommendation. You are
Solely responsible for your
Trading & Investment decision.
BHARTI AIRTEL LIMITED ( 1D ) 🎯 TRADING PLAN 🎯
✔ Price Action shows strong support at
the 78.60% Fibonacci Retracement
with a Bullish Engulfing Candlestick
pattern.
✔ RSI being Oversold adds weight to
the setup.
💡 Great Traders Have Extreme Discipline &
Patience.
Disclaimer : All information is for
Educational & Informational
Purpose Only. Not a buy / sell
Recommendation. You are
Solely responsible for your
Trading & Investment
Decisions.

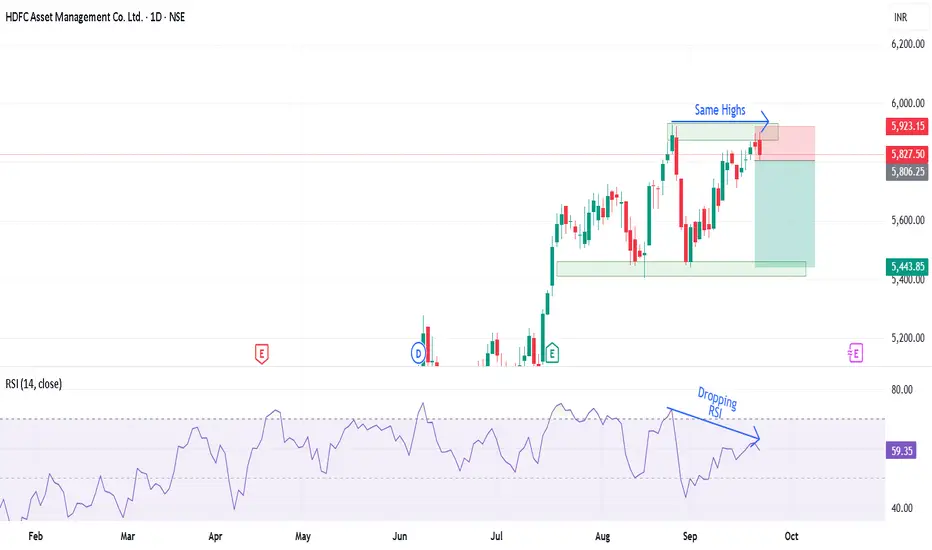
Double Top at the Peak: Is a Bearish Reversal Coming in HDFC AMCHDFC AMC has given a good upside rally of 65% and is form a double top pattern.
The stock is following a bullish trendline but the RSI divergence is creating a bearish sentiment supported by the drop India VIX.
If the stock breaks below the trendline, a bearish trade can be entered with the first target of 5440 following it to 5208.
Bullishness will only be confirmed only once the stock starts trading above 6000 levels.
There is RSI divergence on the higher time frame too and gives more convincing trade in the stock.
Entry :- Below 5809
Target :- 5440 and 5208
Stop Loss :- Close above 5927 (daily charts)
Wait for the price action and trade accordingly.
JSWENERGY Quarterly Breakout#jswenergy Strong Breakout and Sustaining strongly on Quarterly Chart.
Good to Hold for Swing, Short and Long-term #Investment.
Strong on Technical's.
Charts never Disappoint me !

How to Backtest, Create a Strategy and Execute a Trade In this video I have showed a good trade is executed with proper planning and mindset .
Charts Used in this video are older than 3 months . Only for educational content .

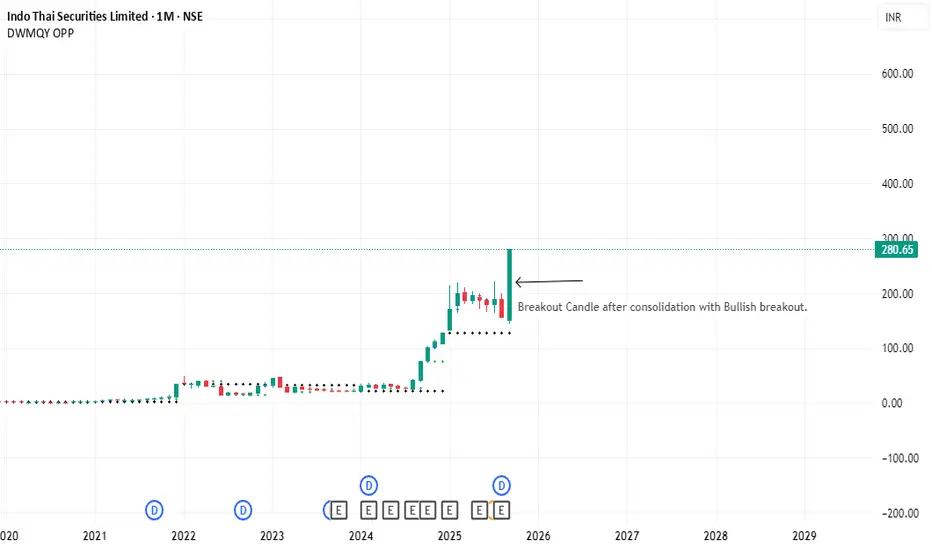
INDOTHAI SECURITIES_ATHHi traders,
Currently Stock is trading @ ATH with bullish breakout @ Monthly timeframe.
Pros:- Good set-up @ Monthly timeframe with Bullish breakout candle.
:- Stock is @ATH.
Cons:- Stock reacted 80 % gain in Sept-2025.
:- Enter after pullback in daily timeframe or weekly timeframe.
Note:- Just for educational purpose not for investment advice. Read all parameters before investing.
Happy Trading folks.
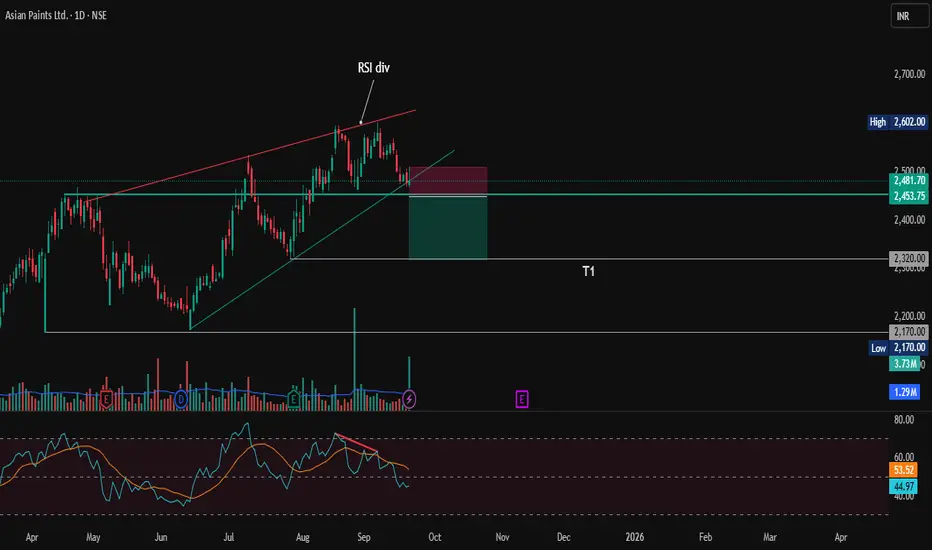
Asian Paints: Short Setup — Bearish Reversal SignalAsian Paints shows signs of a potential short opportunity after forming a bearish reversal pattern (Rising wedge) on the daily chart. The stock failed to sustain above the resistance near 2600, Formed a Double top pattern. The RSI is showing bearish divergence, signaling weakening momentum. hinting at a possible downtrend initiation.
Key Levels to Watch:
Immediate support at 2450 (swing low)
Further downside target around 2320 if support breaks decisively
Trade Plan:
Enter short below 2450 on confirmation of bearish candle close.
Stop loss above 2500 to limit risk from false breakdown.
Target 2320 for conservative exit or trail stop as price moves lower.
Disclaimer: Risk management is crucial in this volatile market, so keep position sizing appropriate. This analysis is intended for educational purposes and not financial advice.
INDIAN HOTELS🎯 TRADING PLAN 🎯
✔ Price Action shows strong support
At the trend line with a Bullish Harami
Candlestick Pattern.
✔ RSI being Oversold adds weight to the
Setup.

Zydus LifeScience Cmp 1037 Dark Cloud Cover @ topZydus LifeScience Cmp 1037 dated 19-9-2025
1. Dark Cloud Cover @ top
2. RSI breakdown
Sell below 1034 SL 1060 target 1030-1025-1015-1005-1000-990-980
It is just a view, please trade at your own risk.

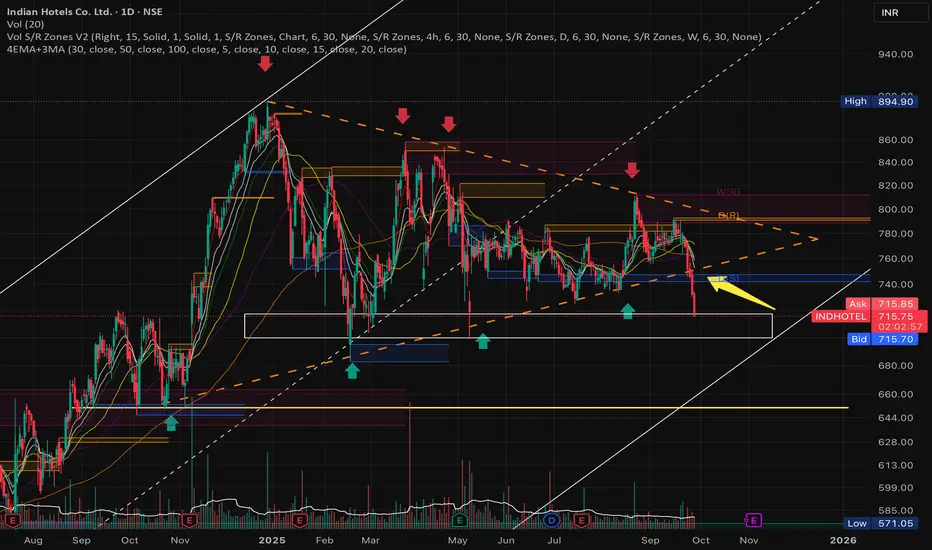
Trend Continuation or Breakdown? Technical Analysis OverviewThe chart has formed a symmetrical triangle pattern, which has taken shape over approximately 270 days. This pattern was recently broken, and a new support level has emerged around 713.
If the 713 support fails to hold, the next potential downside targets are 703, 695, and 685.
However, it's important to note that the stock remains in a broader upward trend, as illustrated by the ascending channel. As long as the price stays within this channel, any pullback toward the lower boundary could present a potential buying opportunity, suggesting a continuation of the uptrend.
Caution:
If the stock breaks below the channel, the current trend structure would be invalidated, and a fresh analysis would be required to reassess the setup.
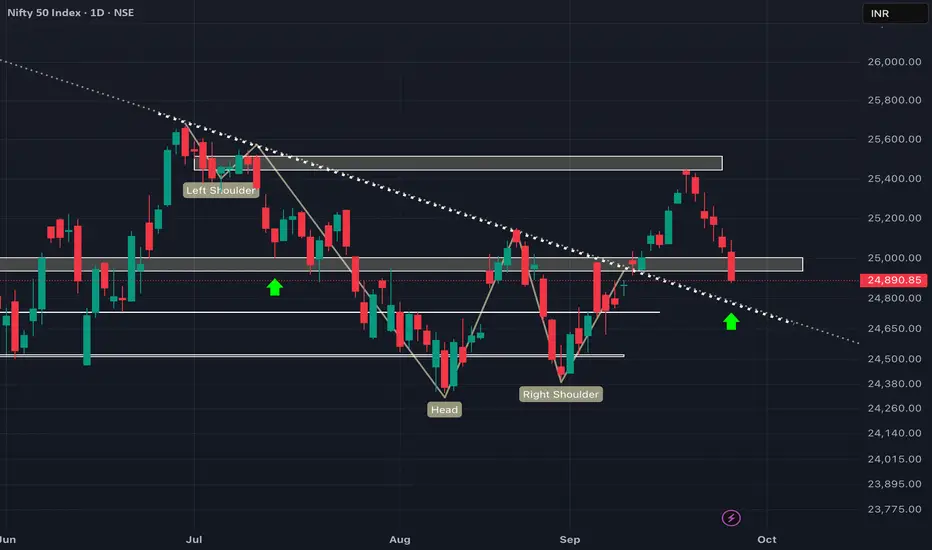
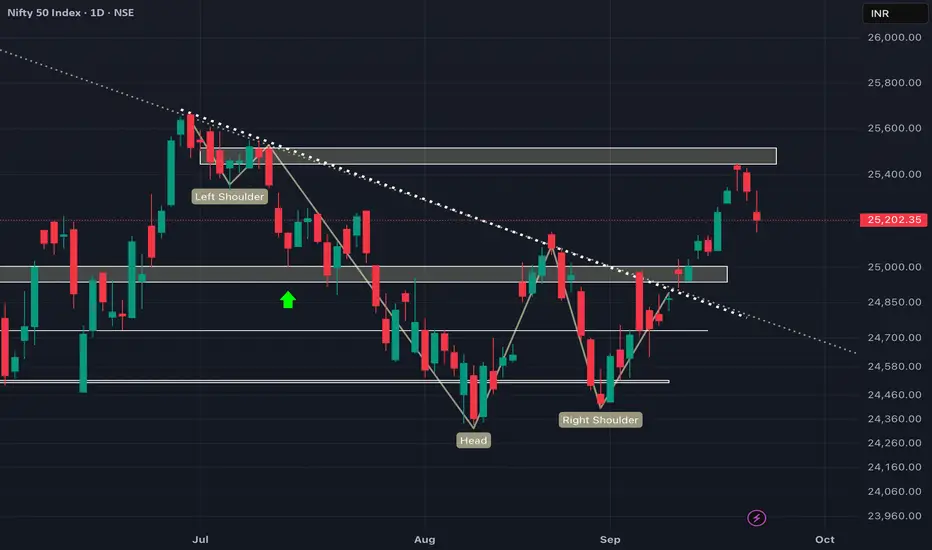
NIFTY will retest this broken Inverted H&S pattern!! As we can see NIFTY broke below the psychological level of 25000 and also strong demand zone. Despite breaking below the important demand zone, we can see it also closed below the demand zone making it weaker. Hence, we can expect NIFTY to take support at the breakout level or can be said as the neckline of the inverted head and shoulders pattern so one should wait for NIFTY to take support at the neckline for further reversal so plan your trades accordingly and keep watching everyone.
Master Inside Bar Strategy with this Twist ( Wtf edition )Learn how to create a simple strategy and simply backtest it on Trading view .

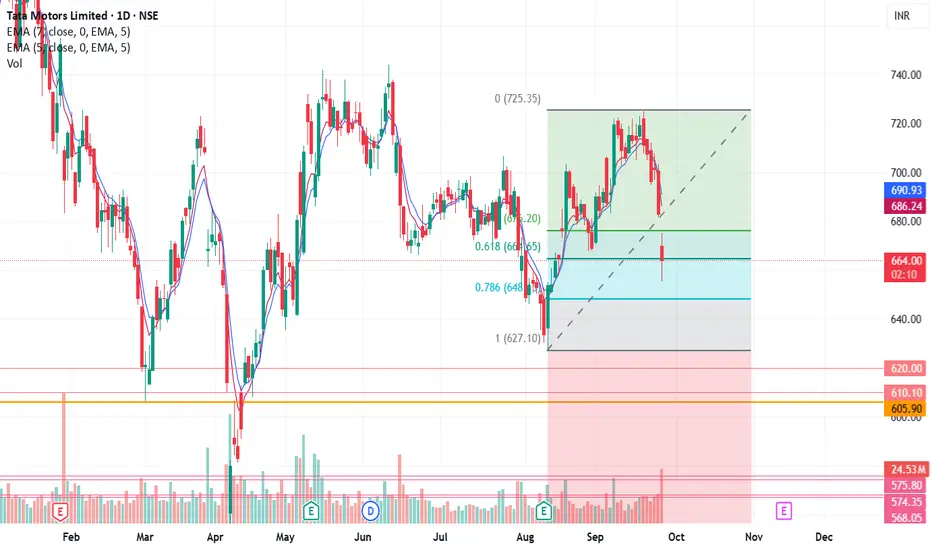
On Golden level of Fibonacci RetracementWith recent bullish momentum in the Auto industry, this looks like a good time to catch Tatamotors as it is on the Fibonacci Retracement golden level. I am bullish on this. Pinbar candle on the bottom on a daily basis gives me more confidence.
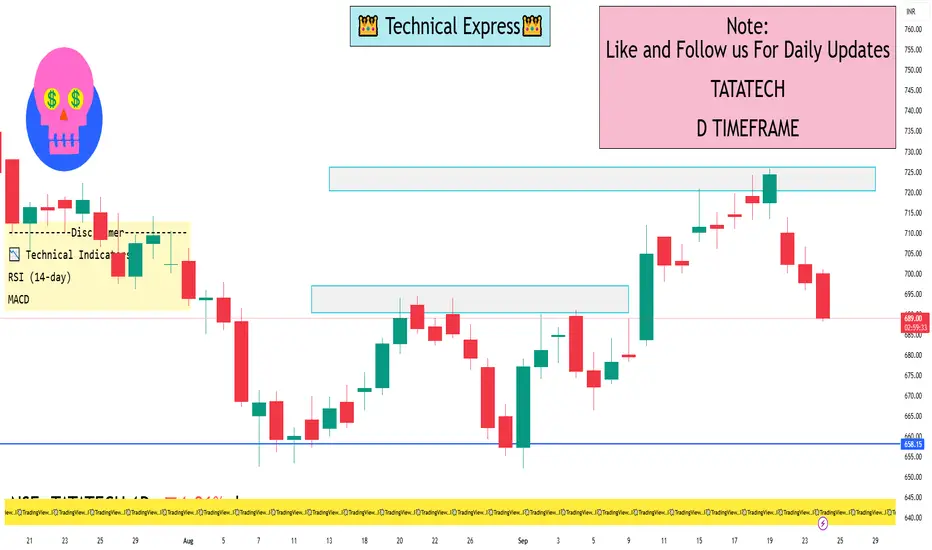
TATATECH 1 Day View📊 1-Day Technical Analysis
📈 Support and Resistance Levels
Immediate Support: ₹693.90
Immediate Resistance: ₹704.95
📉 Moving Averages
5-Day Moving Average: ₹696.90 (indicating a short-term bearish trend)
50-Day Moving Average: ₹710.72 (suggesting a bearish outlook)
200-Day Moving Average: ₹688.48 (indicating a long-term bullish trend)
📉 RSI (Relative Strength Index)
14-Day RSI: 33.53 (below 35, indicating an oversold condition and potential for a rebound)
📉 MACD (Moving Average Convergence Divergence)
MACD Value: -4.46 (below zero, confirming a bearish trend)
🔄 Overall Technical Indicators
Short-Term Outlook: Bearish
Medium-Term Outlook: Neutral
Long-Term Outlook: Bullish
🔮 Short-Term Forecast
The stock is expected to trade within a range of ₹690.89 to ₹704.61 on September 24, 2025, based on the 14-day Average True Range (ATR)
✅ Summary
Currently, Tata Technologies Ltd. exhibits a bearish short-term trend with potential for a rebound due to oversold conditions. Investors may consider monitoring for signs of stabilization or reversal before making trading decisions.
ETH BIG HAMMERAfter good correction ETH has made a hammer at the previous liquidity zone (Support).
One can look for Buy on dip from here on in ETH.
SL- 4070
Target- 4300, 4370, 4400
Disclaimer- This is just for Education Purpose.
Follow for mor such content and learnings.
Jai Shree Ram.

We are heading back to 25000 again!!! EXPLAINEDAs we can see NIFTY again fell strongly which was fueled by Trump's new policy for IT companies which led to this weakness. Further, viewing technically we can also see space for correction till 25000 level which is its next important demand zone which would also be a great area to buy for POSITIONAL view. so plan your trades accordingly as market is now trading at NO TRADING ZONE area which would lead to immense volatility. Better idea would be to wait for price to come at our demand and suppky zones and initiate trades accordingly.
SHRIRAM FINANCE LIMITED ( 1D ) 🔑 KEY LEVELS 🔑
✔ Fibonacci Retracement 50%
✔ Trend Line Act as Resistance.
✔ RSI Also Overbought Zone.
🎯 TRADING PLAN 🎯
✔ Near the key levels , Bearish Engulfing
Candlestick Pattern has formed.
✔ The Entry Point is @ 625.45
✔ The Stoploss Point is @ 638.00
✔ The First Target is @ 577.00
✔ The Second Target is @ 553.00
💡 A Trader must be Strategic , Patience ,
Confident , Discipline & Protective. Like
A Lion.
Disclaimer : All Information is for
Educational & Informational
Purpose Only. Not a Buy / Sell
Recommendation. You are
Solely responsible for your
Trading & Investment
Decisions.

Nifty weekly expiry analysis for 23/09/2025.Nifty has created 3 consecutive red candle on the daily charts and might touch its 20 EMA.
Market is around the All time high levels and chances of profit booking are there.
Today, nifty has closed 125 points lower than the pervious close.
Major Resistance levels :- 25311, 25438
Support levels :- 25094, 25010
On the hourly charts, the market seems to be taking rejection from the hourly 20 ema and it trading between 20 and 50 EMA.
It is trading in a close parallel channel range. If it remains in the range avoid trading or scalp as per the risk appetite.
Though nifty has taking down the 50 EMA and there are chance of it tested the higher moving averages soon.
Tomorrow is nifty weekly expiry. Wait and watch for the price action near the price levels before entering a trade.

Mazdock Long - Technical AnalysisMAZDOCK Technical Analysis Summary
Current Price : 2,985.00
Technical Reasons to Pick MAZDOCK
1 - Dow Theory Confirmation
- Higher Highs (HH) - Higher Lows (HL)
- Clear uptrend structure maintained
2 - EMA Support Structure - Took support from 100 EMA on a weekly Timeframe
- Trading above sorted EMA 100/200
- Strong momentum indication
- Bullish reversal from key moving average
4 - A clear Hidden RSI Divergence
- Indicates continuation of uptrend
- Target 1 : 3,240.00
- Target 2 : 3,502.30
- Target 3 : 3,774.00
- Grand Target : 4,094.00
Risk Management
Watch for sustained break below 100 EMA for trend reversal
Overall Bias : BULLISH
Strategy : Buy on dips near EMA support levels.

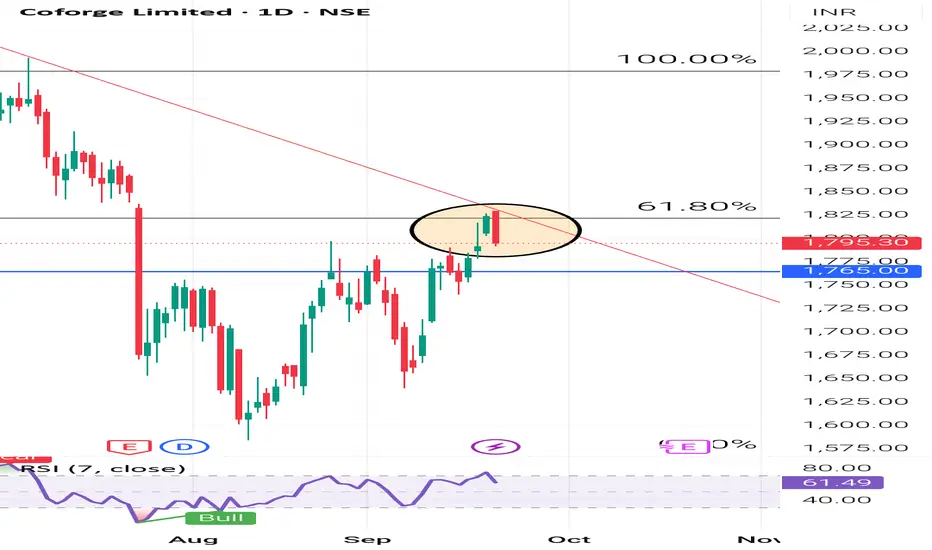
COFORGE LIMITED ( 1D ) 🔑 KEY LEVELS 🔑
✔ Fibonacci Retracement 61.80%
✔ Trend Line Act As Resistance.
✔ RSI Also Overbought Zone.
🎯 TRADING PLAN 🎯
✔ Near the key levels , Bearish Engulfing
Candlestick Pattern has formed.
✔ The Entry Point is Below @ 1792.10
✔ The Stoploss Point is @ 1830.00
✔ The First Target is @ 1681.00
✔ The Second Target is @ 1601.00
💡 Never, ever argue with your trading
System.
Disclaimer : Educational & Informational
Purpose Only. Not a Buy / Sell
Recommendation.