Candle Pattern Knowledge Limitations and Best Practices
Candlestick patterns alone should not be used as the only basis for trades. They are best combined with:
Moving averages
RSI or MACD
Support/resistance levels
Volume analysis
Best Practices
Wait for confirmation before entering.
Avoid trading patterns in choppy, sideways markets.
Use stop-losses under key levels.
Combine with market structure for higher accuracy.
Candlestickpattern

Candle Patterns ExplainedCandlestick patterns are one of the most powerful tools in technical analysis. They visually capture the battle between buyers and sellers and show you who is in control of the market at any moment. Each candle represents the market psychology of that particular timeframe—fear, greed, rejection, aggression, and hesitation. When you learn to read candles correctly, you understand the story behind price, not just the price itself.
A single candlestick is made up of four important points: Open, High, Low, and Close (OHLC). The body of the candle represents the distance between open and close. The wicks (also called shadows) show the highest and lowest points reached during the candle. Bullish candles close higher than they open, while bearish candles close lower than they open.
Candle patterns are broadly divided into three categories: Single-candle patterns, Double-candle patterns, and Triple-candle patterns. Each type gives different signals about trend continuation, reversal, or market indecision.

#UNIVPHOTO: Reversal Alert at Falling Channel Midline!CMP: 286
UnivPhoto found support ✅ & bounced strongly off the mid-line of the falling channel (245–266 zone), forming a textbook Morning Star on the weekly chart — a classic bullish reversal! ⭐️🔥
Now testing key resistance 310–337 + downtrend line. A breakout could fuel a rally to 484 → 747/818 → 988 (ATH) 🚀🚀
Could this be the end of the multi-year downtrend? Watch closely! 👀✨
#UNIVPHOTO #MorningStar #CandleStickPattern #PriceAction #LongTerm #Investing
📌 #Disclaimer: This analysis is shared for educational purposes only. It is not a buy/sell recommendation. Please do your own research before making any trading decisions.

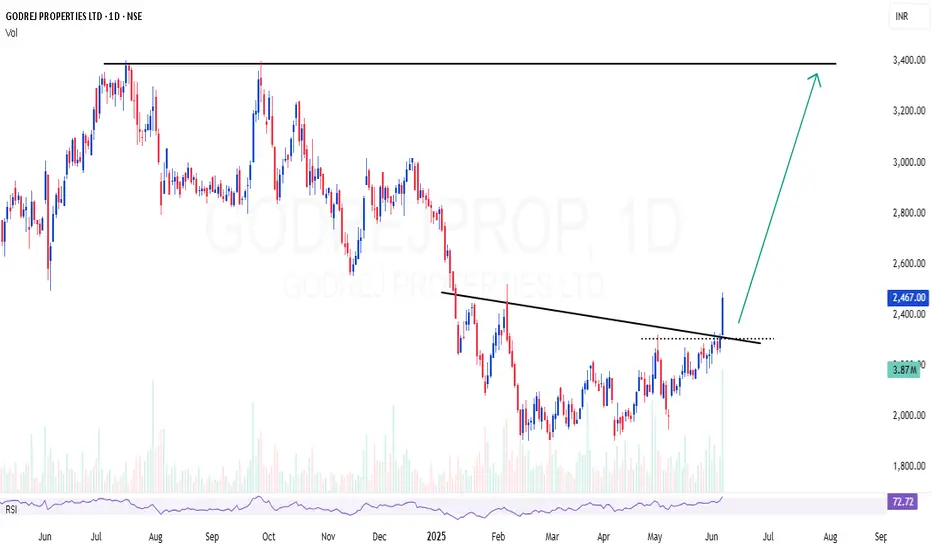
GODREJPROP | Nice breakout with volume, looks good for 40-45% GODREJPROP | Nice breakout with volume, looks good for 40-45%
CMP : 2467 (Dip : 2300)
SL : 2100
Target : 3400
Candle Patterns Explained Candlestick patterns are one of the most powerful tools in technical analysis. They help traders understand price movements, market psychology, and potential trend reversals. Each candlestick represents four key data points for a specific time frame: Open, High, Low, and Close (OHLC). The body shows the open and close, while the wicks (shadows) show the high and low. By studying these candles in combinations, traders can forecast upcoming market moves.
1. Bullish Candlestick Patterns
2. Bearish Candlestick Patterns
3. Continuation Candlestick Patterns
Why Candlestick Patterns Matter
Candlestick patterns work because they capture market psychology — fear, greed, indecision, and momentum. When combined with volume, support-resistance, and trend analysis, they become a highly effective decision-making tool for traders.

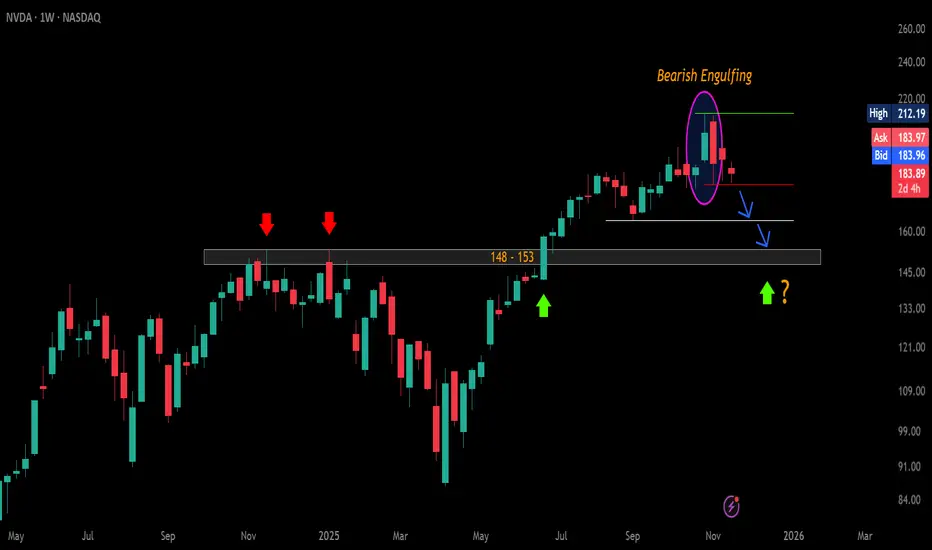
$NVDA – Weekly Bearish Signal Triggering?CMP: $184
NVDA has formed a Bearish Engulfing on the weekly chart and is currently trading inside the engulfed candle.
A WCB / sustained break below $178.91 will confirm the pattern → likely dragging price toward $164 and the major $153–$148 breakout-retest zone . 🔻
A WCB above the ATH $212.19 will invalidate the pattern and signal a fresh uptrend. 🚀
📌 Note: Q3 earnings to be announced post-market. 🕒
Bias: Short-term bearish, HTF bullish if $148–$153 holds. 💚
#USMarket #NVDA #Stocks #TechnicalAnalysis #PriceAction #BearishEngulfing
📌 #Disclaimer: This analysis is shared for educational purposes only. It is not a buy/sell recommendation. Please do your own research before making any trading decisions.
#ANGELONE: Big Swing Setup Inside Falling Channel#AngelOne | CMP: 2,793.40
Trading inside a falling channel , after a successful retest of the 1949–2022 breakout zone .
Dips toward 2,341 can be considered.
🛡 Supports: 2133–2101 / 2022–1949 (Major Zone)
🚧 Resistances: 3285 / 3503 / 3896 (ATH)
🎯 Falling Channel Target post Breakout: ~4,900 (+77% from CMP)
As long as 1,949 holds , structure stays bullish .
Massive swing opportunity forming. 🔥
#AngelOne #FallingChannel #ChartPattern #CandlestickPattern #PriceAction #SwingTrading
📌 #Disclaimer: This analysis is shared for educational purposes only. It is not a buy/sell recommendation. Please do your own research before making any trading decisions.

Candle Patterns 1. Buyers
Push price upward
Create green candles
Long wicks show rejection of low prices
2. Sellers
Push price downward
Create red candles
Long top wicks indicate weakening buying strength
3. Indecision
Appears in dojis and spinning tops
Market is waiting for direction
4. Reversals
Appear when buyers overpower sellers or vice-versa
Engulfing, hammer, shooting star signal possible turning points
5. Continuation
Patterns like Rising Three Methods show temporary rest before trend resumes

Real Knowledge of Candle Patterns Candlestick patterns are one of the most important tools in technical analysis. They help traders understand price movements, market psychology, and potential trend reversals or continuations. Each candlestick represents a battle between buyers (bulls) and sellers (bears). When you observe many candles together, you see patterns that reveal shifts in momentum. These patterns have been used for centuries—originating in Japan—and remain powerful even in modern algorithmic markets.
To understand candlestick patterns, you must first understand the candle structure. A candlestick has four major price points:
Open – the price at which the candle starts
Close – the price at which the candle ends
High – the highest price reached during the candle
Low – the lowest price reached during the candle
If the close is higher than the open, the candle is bullish (typically green or white). If the close is lower than the open, the candle is bearish (typically red or black). The body shows the open-close range, and the wicks (shadows) show the high-low range.

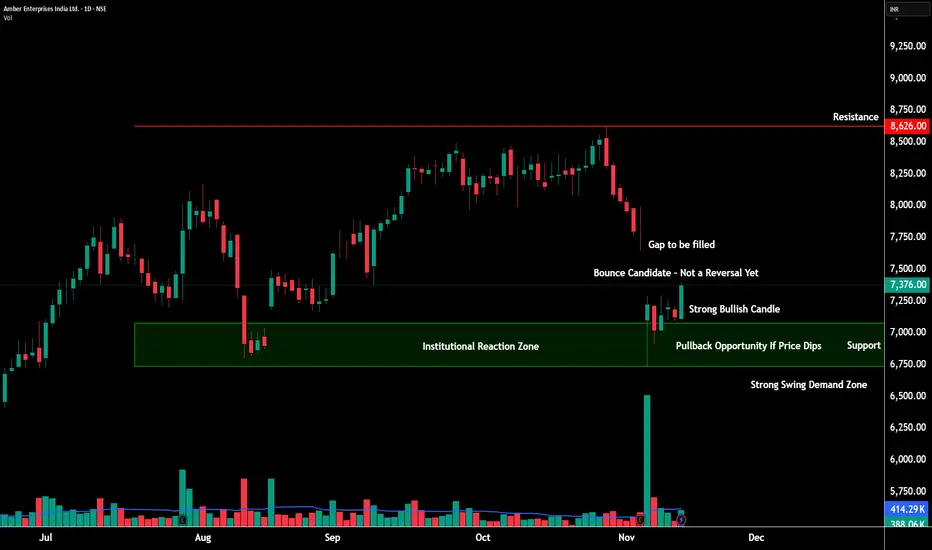
AMBER at a Critical Turning Point – Trend Shift or Just a Bounce💹 Amber Enterprises Ltd (NSE: AMBER)
Sector: Consumer Durables | CMP: 7376 | View: Early Reversal Attempt Inside Downtrend Structure
Chart Pattern: NA
Candlestick Pattern: Bullish Engulfing
📊 Price Action – What’s Really Happening?
Amber finally showed signs of life after a sharp slide from 8600 levels.
Buyers stepped in near 7180–7200, creating a clean intraday reversal base.
But — the larger trend is still down, so this bounce must prove itself above 7480–7536.
🧭 Support & Resistance
Resistances: 7484 | 7536 | 7592 | 7785
Supports: 7183 | 7090 | 6990 | 6882
Demand zones are strong → resistance zones are layered and heavy.
This is why confirmation matters.
📈 STWP Trading Analysis:
Bullish Breakout: 7400 | Stop Loss: 7180
A clean bounce developed from the swing demand zone after strong absorption of selling pressure. Despite this intraday strength, the daily chart remains in a downtrend with lower highs and lower lows. A possible close above 7480–7535 could shift bias to short-term bullish continuation. Below 7180, weakness can reappear quickly.
🧩 Final STWP Outlook
Momentum: Mild |Trend: Bearish | Risk: Moderate | Volume: Improving
⚠️ Disclosure & Disclaimer – Please Read Carefully
This content is strictly for educational and informational purposes.
It is not a buy/sell recommendation and should not be treated as investment advice.
I am not a SEBI-registered investment adviser.
Markets carry risk, and price can move unpredictably.
Always evaluate your risk, position size, and suitability before trading.
Consult a SEBI-registered adviser before making any financial decision.
Position Status: No active STWP position in AMBER at the time of analysis.
Data Source: TradingView & Market Data Snapshot.
💬 Found this breakdown useful?
🔼 Boost this post to help more traders learn structured analysis
✍️ Comment your views or setups — let’s grow together
🔁 Share it with traders who want clean, disciplined analysis
👉 Follow @STWP for more structured trade setups, zone-based insights, and disciplined trading approach.
🚀 Stay Calm. Stay Clean. Trade With Patience.
Trade Smart | Learn Zones | Be Self-Reliant 📊
#Silver Alert: Double Top Breakdown Incoming?🚨 Double Top on XAGUSD daily chart:
1️⃣ First Top: Bearish Engulfing
2️⃣ Second Top: Dark Cloud Cover
Pattern confirms DCB 🔻 below $45.55 , 🎯 targeting $36.71 .
🚧 Resistance: $52.32 - $54.49
🛡 Support: $50.62, $49.38 - $48.91, $47.17 - $46.90
⚠️ Major sell-off potential. Longs only above Double Top high after 2 consecutive closes.
#Silver #XAGUSD #DoubleTop #TechnicalAnalysis #BearishReversal #ChartPatterns #CandlestickPatterns #PriceAction
📌 #Disclaimer: This analysis is shared for educational purposes only. It is not a buy/sell recommendation. Please do your own research before making any trading decisions.

Part 2 Understanding the Master Candle ConceptWhat Are Options?
Options are derivative instruments, meaning their value is derived from an underlying asset. The underlying asset can be a stock, index, commodity, or currency.
There are two types of options:
Call Option:
Gives the buyer the right to buy the underlying asset at a specific price (called the strike price) before the expiry date.
Put Option:
Gives the buyer the right to sell the underlying asset at a specific price before the expiry date.
For example:
If you buy a NIFTY 50 call option at a strike price of 22,000, you are betting that the NIFTY will rise above 22,000 before expiry. If it does, your call option increases in value.
If you buy a NIFTY put option at 22,000, you’re betting the index will fall below 22,000 — and the value of your put option will rise as the index drops.

Explain: Candle PatternWhat is a Candlestick Pattern?
A candlestick pattern represents the price movement of an asset (like a stock) during a specific time frame. It shows open, high, low, and close prices in one candle.
Structure of a Candle
Each candle has:
Body: The range between open and close price.
Wick (or shadow): The lines above and below the body showing high and low prices.
Color: Green (bullish – price up) or Red (bearish – price down).

BRITANNIA - Falling Wedge + Bullish Engulfing Combo💹 Britannia Industries Ltd (NSE: BRITANNIA)
Sector: FMCG | CMP: ₹5,892.50 | View: Falling Wedge + Bullish Engulfing Reversal Setup
📊 Price Action:
Britannia is currently displaying a strong confluence setup where both a chart pattern and a candlestick pattern align perfectly to signal a potential trend reversal.
After weeks of consolidation within a downward-sloping structure, the stock has formed a Falling Wedge pattern — a classic bullish reversal formation.
Adding strength to this structure, a Bullish Engulfing Candle on 4 Nov 2025 emerged from the wedge’s lower boundary, confirming buyer dominance and hinting at a near-term trend reversal.
📉 Chart Pattern Analysis – Falling Wedge (Bullish Setup):
The Falling Wedge pattern is marked by two converging downward trendlines, each connecting a series of lower highs and lower lows.
This structure reflects seller exhaustion and early buying interest.
Britannia’s wedge formation is now reaching its apex, where breakout probability is highest.
Volume contraction throughout the wedge also supports the notion that supply is drying up, preparing for a breakout above the upper trendline.
📈 Candlestick Pattern – Bullish Engulfing Confirmation:
The Bullish Engulfing Candle formed on 4 Nov 2025 precisely at the lower support line of the wedge, validating the pattern with strong timing. It represents a shift in control from sellers to buyers, with the green candle completely engulfing the prior red body. Volume expansion on that session further confirmed active participation by institutions ahead of the upcoming news catalysts. This one-day reversal candle acts as the first technical confirmation, while a breakout above the upper trendline will serve as the structural confirmation for the wedge pattern.
📏 Fibonacci Analysis:
From swing low ₹5,298 to swing high ₹5,930:
78.6% retracement @ ₹5,795 → Key reversal level defended.
61.8% retracement @ ₹5,888 → Currently reclaimed zone.
100% extension @ ₹5,930 → Short-term breakout threshold.
The Fibonacci structure aligns beautifully with the wedge’s geometry, implying that the reversal zone is complete and buyers are regaining momentum.
🧭 STWP Support & Resistance:
Resistances: ₹5,940 | ₹5,987 | ₹6,055
Supports: ₹5,825 | ₹5,775 | ₹5,710
The ₹5,775–₹5,825 range is acting as a high-confidence accumulation base, while ₹6,090–₹6,150 represents the key breakout trigger zone.
📊 STWP Volume & Technical Setup:
Volume on 4 Nov surged to 363.4K vs 248.7K average, confirming institutional interest at lower levels. VWAP recovery and improving RSI (47→52+) show that momentum is gradually returning.
MACD is approaching a bullish crossover, while Stochastic and CCI have both turned upward — all aligning with a reversal confirmation setup.
Trend Direction: UPTREND (Transitioning) | Volume Confirmation: Possible Accumulation in Progress
🧩 STWP Summary View:
Final Outlook:
Momentum: Strengthening | Pattern: Falling Wedge + Bullish Engulfing | Risk: Moderate | Volume: Increasing
Britannia’s technical structure now showcases dual confirmation — a chart pattern (Falling Wedge) supported by a candlestick reversal (Bullish Engulfing).
This confluence enhances the reliability of the reversal signal and increases the probability of an upside breakout. As long as the price holds above ₹5,825, the bias remains bullish with potential continuation toward ₹6,150–₹6,250.
⚠️ Disclosure & Disclaimer – Please Read Carefully
This analysis is for educational purposes only and should not be treated as financial or investment advice.
I am not a SEBI-registered investment adviser. All views are based on technical observations and publicly available information.
Trading involves risk; please assess your financial suitability, position size, and stop-loss levels before entering any trade.
Always consult a SEBI-registered financial adviser for personalized guidance.
Position Status: No active position in (BRITANNIA) at the time of this analysis.
Data Source: TradingView & NSE India
💬 Found this useful?
🔼 Give this post a Boost if you value clean technical confluence studies.
💭 Comment your thoughts — does this wedge-breakout setup look convincing to you?
🔁 Share this post to help others understand pattern + candlestick synergy.
👉 Follow for more institutional-style technical breakdowns built on clarity and patience.
🚀 Stay Calm. Stay Clean. Trade With Patience.
Trade Smart | Learn Zones | Be Self-Reliant 📊

Candlestick Secrets Traders Never Tell YouDiscover candlestick patterns hidden in plain sight and master their true power like never before
Charts used in this Video are over 3 months old

Multi‑Timeframe RSI Divergence Strategy with CandlesticksA confluence-based setup combining higher timeframe levels, RSI divergence, and candle signals for high‑probability swing entries . Sharing how to Create and backtest strategies on Trading view platform .
Charts used are 3 months or older .

Part 2 Candle Stick PatternUnderstanding Call and Put Options
There are two basic types of options: Call Options and Put Options.
Call Option:
A call option gives the holder the right, but not the obligation, to buy an underlying asset at a specific price (called the strike price) before a specific date (called the expiry date).
Put Option:
A put option gives the holder the right, but not the obligation, to sell an underlying asset at a specific strike price before expiry.

Part 1 Candle Stick PatternRisks and Rewards in Option Trading
Option trading offers tremendous potential—but it comes with unique risks. Understanding these is essential:
Limited Time: Options lose value as expiry nears due to time decay (Theta).
Volatility Risk: Sudden drops in volatility can reduce option prices unexpectedly.
Liquidity Risk: Some options have low trading volume, making it difficult to enter or exit positions.
Leverage Effect: Options amplify both gains and losses.
Margin Requirements (for Sellers): Option writers must maintain sufficient margin, as potential losses can be large.

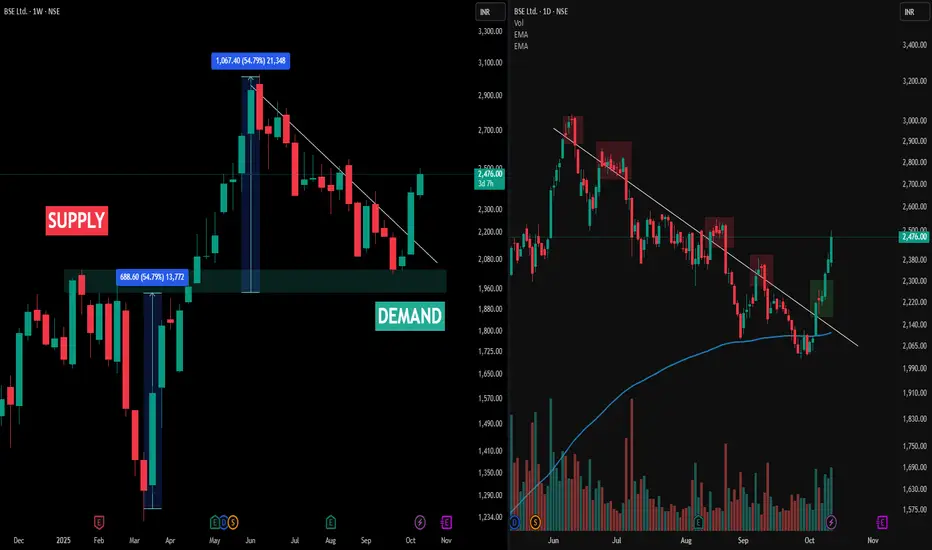
Multi-Timeframe Observation: BSE Ltd• The image above presents a multi-timeframe view of BSE Ltd (NSE), with the left side displaying the Weekly Timeframe (WTF) chart and the right side showing the Daily Timeframe (DTF) chart. The weekly chart highlights the main demand and supply zones, with large upward moves originating from demand and visible percentage swings marked for clarity.
• A key observation is the Change of Trend (CT) line. On the weekly chart (left), price action repeatedly challenged but never closed above the CT, indicating resistance at this structural level. This is confirmed on the daily chart (right), where each significant upward move into the CT region is marked by red boxes—showing failed attempts to sustain above the CT and repeated rejections.
• The green box on the daily chart points to a recent bounce from demand, but the price still faces resistance at the CT as per the weekly structure. Consistent volume activity and price response across both timeframes offer a crystal clear illustration of trend dynamics and supply-demand interplay. The post is strictly an analytical observation of price structure, not a prediction or recommendation.
Disclaimer
This post is intended for observational and educational purposes only. It does not constitute financial advice or recommend any trading action. Please consult a certified financial advisor and conduct your own research before making investment decisions.
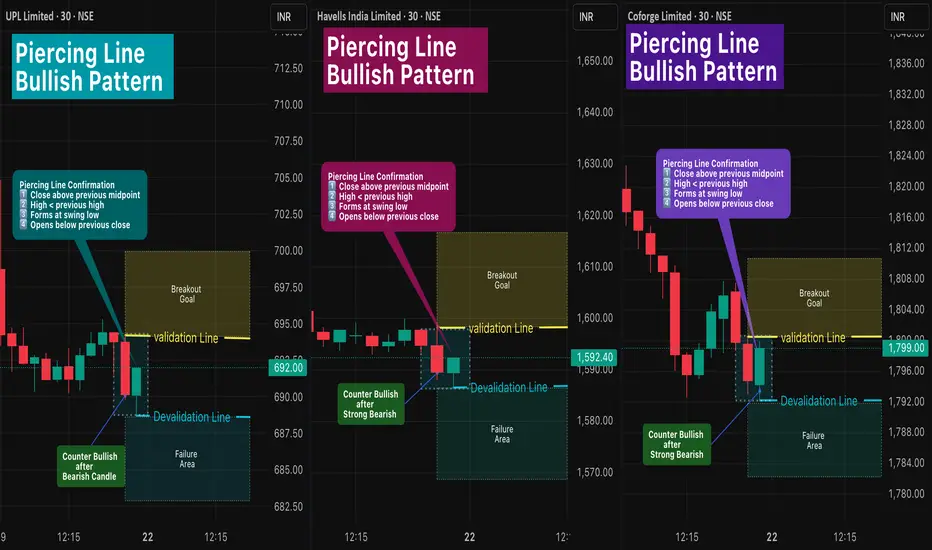
Piercing Line Bullish Pattern 🔎 Intro / Overview
The Piercing Line Pattern is a two-candle bullish reversal setup that forms after a downtrend.
- Sellers lose control → Buyers step in strongly.
- Entry and exit are rule-based using Validation and Devalidation lines to restrict false signals.
- Stop-loss is based on swing low, and Target is 1R (equal to risk distance).
This setup can be applied across any symbols and any timeframe (Just make sure it is after Downtrend or at Swing Low).
📊 Example symbols in this idea:
NSE:UPL · NSE:HAVELLS · NSE:COFORGE
___________________________________________________________
📌 How to Use
✅ Piercing Line Pattern – Confirmation Rules
1️⃣ Close Above Midpoint → The second candle must close above the midpoint of the first bearish candle.
2️⃣ Lower High Condition → The second candle’s high should be lower than the previous candle’s high, showing controlled recovery rather than immediate breakout.
3️⃣ Swing Low Context → The pattern forms after a swing low or decline, signaling potential reversal from bearish to bullish.
4️⃣ Gap/Open Condition → The second candle should open below the prior candle’s close, reflecting initial selling pressure before buyers take over.
When Pattern Confirm - Entry Rules -
📌 Validation → Close above the Pattern High .
📌 Devalidation → Close below Swing Low before validation.
When all conditions align, the Piercing Line confirms a bullish reversal opportunity.
__________________________________
🎯 Trading Plan
- Entry → Candle closes above the Validation line (Pattern high).
- Failure → If candle closes below Devalidation line before validation.
- Stoploss → Swing Low.
- Target → Equal to stoploss distance (1R).
___________________________________________________________
📊 Chart Explanation
All Patterns shown in 30-min timeframe :
1️⃣ NSE:UPL (UPL Limited)
- Entry @ 694.20 → Breakout Goal confirmed only on candle close above this level.
- Devalidation Level: If price closes below 688.70 , the Pattern shifts to the Failure Area.
2️⃣ NSE:HAVELLS (Havells India Limited)
- Entry @ 1598.20 → Breakout Goal confirmed only on candle close above this level.
- Devalidation Level: If price closes below 1586.50 , the Pattern shifts to the Failure Area.
3️⃣ NSE:COFORGE (Coforge Limited)
- Entry @ 1800.50 → Breakout Goal confirmed only on candle close above this level.
- Devalidation Level: If price closes below 1792.10 , the Pattern shifts to the Failure Area. .
📊 All three Patterns are live and active in the same timeframe.
___________________________________________________________
👀 Observation
- Piercing Line is most effective near swing lows after a clear downtrend.
- Strict validation/devalidation rules help avoid false entries.
- Works well across multiple symbols when conditions align.
___________________________________________________________
❗ Why It Matters?
- Defines entries and exits clearly with rule-based validation.
- Provides a structured framework to trade reversals confidently.
___________________________________________________________
🎯 Conclusion
The Piercing Line Pattern is a disciplined bullish reversal signal.
By combining Validation and Devalidation Rules, traders gain clarity and protection against false trades.
🔥 Patterns don’t predict. Rules protect. 🚀
___________________________________________________________
⚠️ Disclaimer
📘 For educational purposes only.
🙅 Not SEBI registered.
❌ Not a buy/sell recommendation.
🧠 Purely a learning resource.
📊 Not Financial Advice.
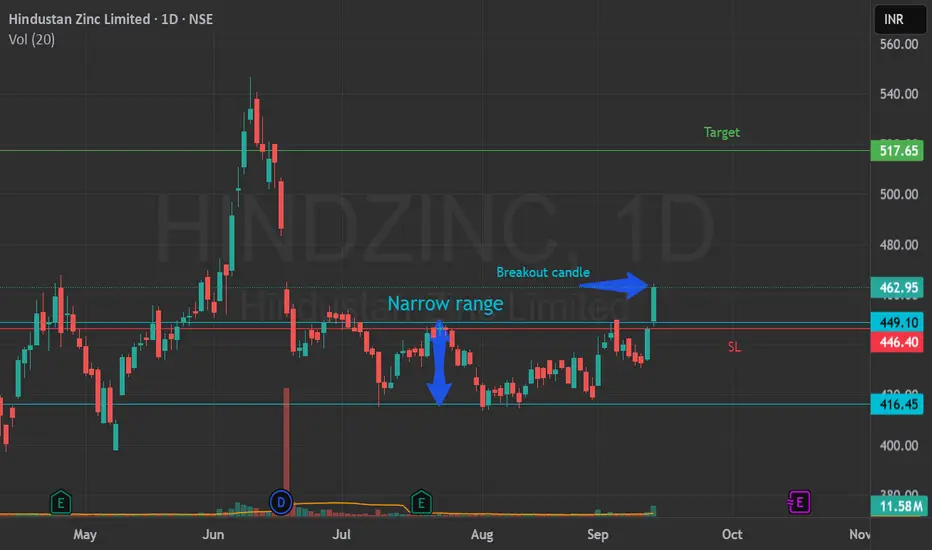
Narrow range breakout .Buy above 465A good breakout candle with high volume from narrow range could draw the price up.Follow with strict SL and target. Only for education purpose*.
CDSL 1hr chart 2025Firstly apologies for not posting regularly but as there's few restrictions on analysis for stock by SEBI & by trading view so we need to follow them & here's the chart on day time frame where price formed a spinning doji &https://www.tradingview.com/x/DidegdMn/
-->on weekly chart price formed "DOJI" candle shows indecisiveness,
-->on day chart a "Spinning Doji candle" & wicks of 10 points & body of 9 points but if takes close value it gets to 10 so we trade above or below it only.
-->on hourly basis {1hr & 2hr} price formed a "Descending candle pattern", so here's a probability of price giving a fake break .
for any buying or long position "1680" above candle closes & trades on day chart we can go long.
for Monday if price takes rejection from trendline sell or if price opens flat 1st candle green takes rejection from or near 1615-1620 then upon rejection candle we can sell & if flat & price goes below 1587 then 1578tgt can be seen, if further goes down then trail candle to candle,
1618-1586==> no trade zone
here's the hourly chart with path & scenarios pls follow it.

Bearish Hammer with EMA High-Low Band - Rule Based Entry 🔹 Intro / Overview
The Bearish Hammer candlestick is a signal of potential downside reversal.
It forms when buyers push price higher, but sellers regain control and close the candle near its low.
When combined with EMA High–Low Band confirmation, it creates a disciplined setup to identify short trade opportunities with clear rules.
---
📖 How to Use
✅ Validation → A valid signal occurs when the close price is below the low of the Bearish Hammer.
❌ Invalidation → If the close price crosses above the high of the Bearish Hammer, the signal is invalid. (Before validation )
EMA Band Confirmation:
- The Bearish Hammer must be above the EMA High–Low Band.
- The EMA High-Low band should not touch the Bearish Hammer.
- This ensures the setup aligns with bearish conditions.
✅ Bearish Hammar High must be swing high
---
🎯 Trading Plan
Entry → Enter short when the close price is below the Hammer’s low (validation line).
Stop-Loss (SL) → The high of the Bearish Hammer candle(Swing High)
Target (TP):
- First Target → 1R (equal to the risk defined by Entry–SL distance).
- Remaining Lots → Trail using ATR, Fibonacci levels, Box Trailing, or structure-based stops.
---
📊 Chart Explanation
- The Bearish Hammer shows rejection of higher prices, with a small body near the low and a long upper shadow.
- The EMA High–Low Band sits below the candle, and the Hammer forms above the band (no touch), confirming the setup.
- Validation occurs when the next close is below the Hammer’s low.
- Invalidation occurs if price closes above the Hammer’s high(before Validation)
---
👀 Observation
Bearish Hammer Behavior → Most effective after an uptrend or at resistance zones.
EMA Role → Ensures trade alignment with broader market bias.
Risk Management → SL above Hammer high, TP at least 1:1, with trailing options for extended downside moves.
---
❗ Why It Matters?
- Shows buyers losing strength.
- Sellers step back in and dominate.
- EMA Band ensures cleaner filtering of weak signals.
- Provides a strict framework for entry, SL, and targets.
---
🎯 Conclusion
The Bearish Hammer, combined with EMA High–Low Band confirmation, creates a structured short setup.
Using strict validation, devalidation, and risk management, traders can filter false signals and ride potential bearish moves with confidence.
🔥 Patterns don’t predict. Rules protect.
---
⚠️ Disclaimer
For educational purposes only · Not SEBI registered · Not a buy/sell recommendation · Not financial advice — purely a learning resource.
