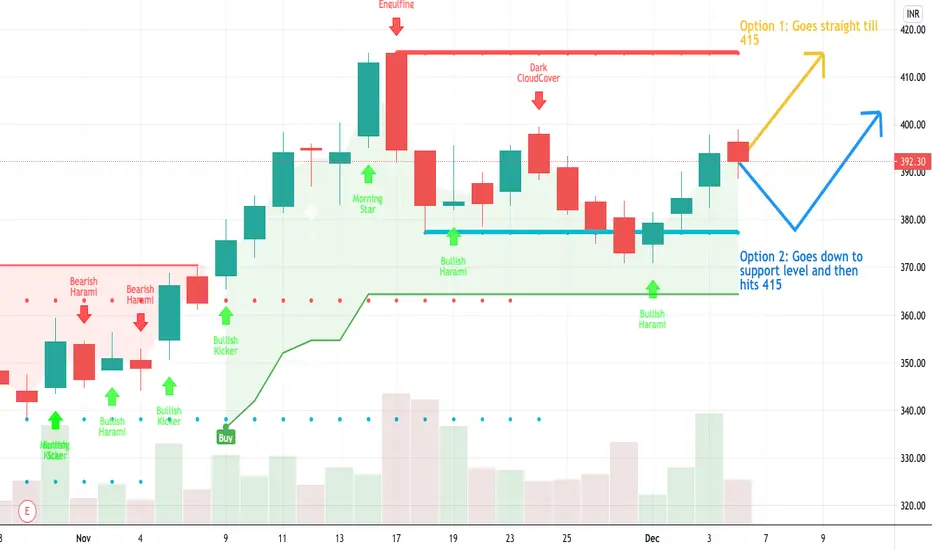
Support and Resistance Analysis for BPCL!Profitable swing trading opportunity for BPCL- NSE:BPCL
Chart has many support and resistance points. A recent channel has been broken for a new support and resistance plot to set.
Opportunity to Buy!
Buy-380. Target Price-415. Stop Loss-375
Candlestickpattern

Titan - are you willing to go against jhunjhunwala?Expected moves laid out on chart
Previous week close has given a hanging man candle, can be a good short candidate in near term if shows weakness, R:R is very good on short as price is near multi month resistance


Nifty50 Nifty follow RWP since 2018 now it was on it RT higher chances to retest the below 12000 levels before go up.

HDFCLIFE Looking BullishHDFCLIFE has retested its previous swing high and made a bullish candle for the day. It can make an up move from the current levels. The next resistance can be 1.272 Fib level, which is around 730.
Cheers! This is as per my Analysis. Feel free to share your view about this. Please do your analysis before trading/Investing.
Happy Trading.


Reliance UpmomentAfter A big sell of reliance is now bouncing back a strong bullish engulfing is a good time enter. bought this at 1950 shall I hold it or sell exit with profit? what

Bullish engulfing pattern.Go longBullish engulfing @ imp support,rsi up from oversold,good volumes.SL below the candles low.

Bullish engulfing.A big move upside is expected.Go longHuge bullish engulfing at the major support level in daily chart with very good volumes suggesting buying interest.Rsi also pointed upwards from oversold region.

Morning star pattern.Go longBullish view as morning star pattern appeared, daily rsi pointing upwards,slight increase in volumes with previous candle.


[Short Term] Morning Doji Star Bullish Candlestick Pattern Morning Doji Star bullish candlestick pattern formed near support level in BHEL. Go long after breakout of downtrend resistance for the target of 29.50 and 32.30+.

Nifty may breach 12000 this timeNifty made a good bullish candle after trapping all the seller (who sold below doji). It respected the level 11800-11850.
Looking at momentum Nifty may breach 12000 in coming session. First target 11250. A profit booking may be seen here. Second target is 12400.

Banknifty is looking good to go long for swingBanknifty is looking good to go long
(Plz go through my previous weekly idea of bn)
1. BN retraces after touching 24100 (yellow marked line)
2. Took support and bounced from 23150 level
(previously marked; green line)
3. It has breahed 200 dma convinsingly in PDS
making a bullish engulfing.
4. A good rally may be seen from here. First target 25100.
This is supply zone as well, so bn may show some
profit booking. When this level (25100) will breach
next target is 26500

RANGE BREAK DOWN IN ESCORTS 15MIN TIME FRAMEPure Downtrend and consolidation are present and there was restest thereby further downtrend can be seen in the next market session.

FANTASTIC RETURN OF 10% IN 3 DAYS APOLLO HOSPITALPEOPLE
.
LOOK AT THE IDEA I SHARED ON TRADING VIEW FEW DAYS BACK
.
CHECK LEVELS AND DO SOME LESRNING FROM IT

#LETSTALKABOUTMARKETS - Tech MahindraTech Mahindra seems exhausted now and is not participating in the Amazing IT rally that we have seen. It can be considered the weak link in the It index even though it has given a wonderful return. Technically TechM has closed with a graveyard candlestick which indicates a reversal in the uptrend. One can enter into a short position around 870-875 with a strict SL of 910 and for a target of 800. It also has a negative RSI divergence as marked in the charts.
Do like and comment your views. This is my personal opinion and purely for educational purposes.


SAIL TRADING NEAR ITS GOOD SUPPORT Sail is trading near its long term support 33. A bounce from here is possible till 43-44 (where three resistance lines are meeting) if breaks 36.
SL will be below support (33)

