Bullish Engulfing Pattern: Spotting Reversals with Discipline🔎 Intro / Overview
Managing risk is just as important as finding an entry. The Bullish Engulfing is one of the most effective candlestick patterns to identify potential reversals. When traded with discipline, it signals a shift from seller pressure to buyer control, helping traders time their entries with confidence.
📔 Concept
A Bullish Engulfing occurs when:
The first candle is a small red candle that continues the downtrend.
The next candle is a large green candle whose body completely engulfs the red candle’s body .
👉 This shows a clear psychological shift — sellers push lower (red candle), but buyers step in strongly (green candle) and reclaim control.
📌 How to Use
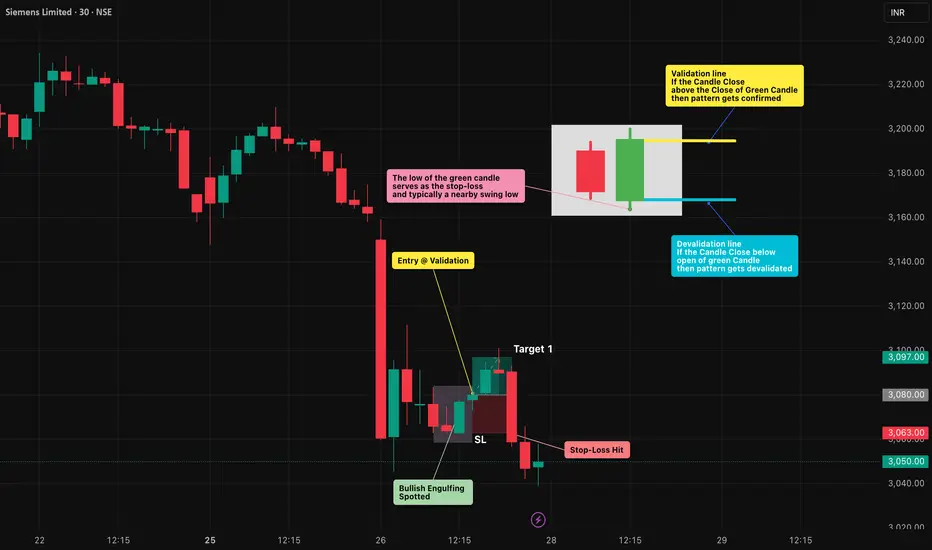
✅ Validation → The candle must close above the close of the green candle.
❌ Invalidation → If price closes below the open of the green candle before confirmation.
Trading Plan:
Entry → After confirmation of the green candle’s close.
Stop-Loss (SL) → Below the low of the green candle.
Take-Profit (TP) :
Conservative → 1R (Entry → SL distance)
Moderate → 2R
Aggressive → Book partial at 1R and trail the rest using tools like ATR, Fibonacci levels, or structure-based stops to ride any extended upside move.
📊 Chart Explanation
On the chart, the first small red candle shows sellers continuing the downtrend. The next large green candle completely engulfs the red candle’s body and closes higher — signaling that buyers have taken control.
The pattern was validated at the close of the green candle , where the long entry was taken. The low of the green candle is used as the stop-loss level, while the targets are mirrored in reverse using the same distance.
In this example, Stop-loss was quickly achieved . From there, traders can apply trailing stop methods to lock in profits and manage further upside targets.
👀 Observation
Most effective at support zones or after a prolonged downtrend .
A high-volume green candle adds conviction to the signal.
In sideways/choppy markets , it can produce false signals — always filter with structure and indicators.
❗ Why It Matters?
The red candle shows seller pressure .
The green candle shows buyer strength .
This clear shift in control creates a rule-based setup with defined entry, SL, and TP.
🎯 Conclusion
The Bullish Engulfing is a strong sign of reversal — but only when combined with structure, confirmation, and disciplined risk management.
🔥 Patterns don’t predict. Rules protect.
⚠️ Disclaimer
For educational purposes only · Not SEBI registered · Not a buy/sell recommendation · No investment advice — purely a learning resource
Candlestickpattern
Bearish Engulfing Pattern: Spotting Reversals with Discipline🔎 Intro / Overview
Managing a trade after entry is just as important as finding the right setup. The Bearish Engulfing is one of the most reliable candlestick patterns to spot potential reversals. When traded with discipline, it helps you recognize momentum shifts early and manage risk objectively.
📔 Concept
A Bearish Engulfing occurs when:
The first candle is a small green candle that continues the uptrend.
The next candle is a large red candle whose body completely engulfs the green candle’s body .
👉 This shows a clear psychological shift — buyers push higher (green candle), but sellers step in aggressively (red candle) and erase those gains.
📌 How to Use
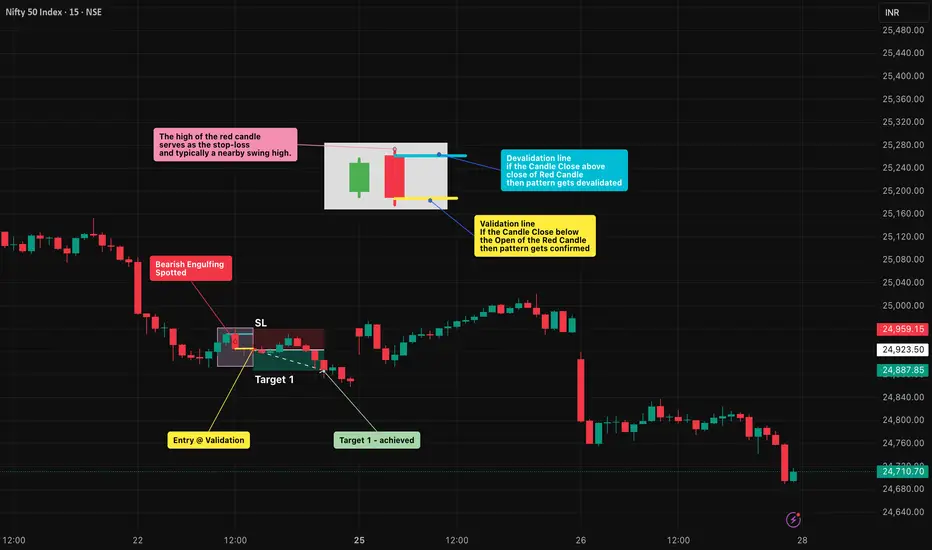
✅ Validation → The candle must close below the open of the red candle.
❌ Invalidation → If price closes above the close of the red candle before confirmation.
Trading Plan:
Entry → After confirmation of the red candle’s close.
Stop-Loss (SL) → Above the high of the red candle which is also a swing high.
Take-Profit (TP) :
Conservative → 1R (Entry → SL distance)
Moderate → 2R
Aggressive → Book partial at 1R and trail the rest using tools like ATR, Fibonacci levels, or structure-based stops to ride any extended downside move.
📊 Chart Explanation
On the chart, the first small green candle represents buyers continuing the uptrend. The next large red candle completely engulfs the green candle’s body and closes lower, signaling that sellers have taken control.
The pattern was validated at the close of the red candle , where the short entry was taken. The high of the red candle is used as the stop-loss level, while the targets are mirrored in reverse using the same distance.
In this example, Target 1 was quickly achieved . From there, traders can apply trailing stop methods to lock in profits and manage further downside targets.
👀 Observation
Works best when the pattern forms at major resistance levels or after a sustained uptrend .
A high-volume red candle strengthens the reliability of the signal.
In sideways or choppy conditions , false signals are common — always confirm with structure and indicators before acting.
❗ Why It Matters?
The green candle shows buyer optimism .
The red candle shows seller dominance .
This clear flip in control creates a rule-based setup with defined entry, SL, and TP.
🎯 Conclusion
The Bearish Engulfing is a strong sign of reversal — but it’s powerful only when combined with structure, confirmation, and disciplined risk management.
🔥 Patterns don’t predict. Rules protect.
⚠️ Disclaimer
For educational purposes only · Not SEBI registered · Not a buy/sell recommendation · No investment advice — purely a learning resource
Observing Charts Smarter: Learning Price Action Made EasyIn this video, I share how simple trading observations and “talking to the charts” can improve your understanding of price action and trade movements. By reviewing Apollo’s chart, we explore how breakout patterns, retracements, and higher highs unfold in real time. The goal is not prediction, but sharpening your ability to read market structure, avoid wrong entries, and reduce big drawdowns—ultimately helping you become a more disciplined trader.

Nifty 50 - Technical Chart Pattern Analysis, With LevelsNifty 50 - Technical Chart Analysis (as per Daily chart)
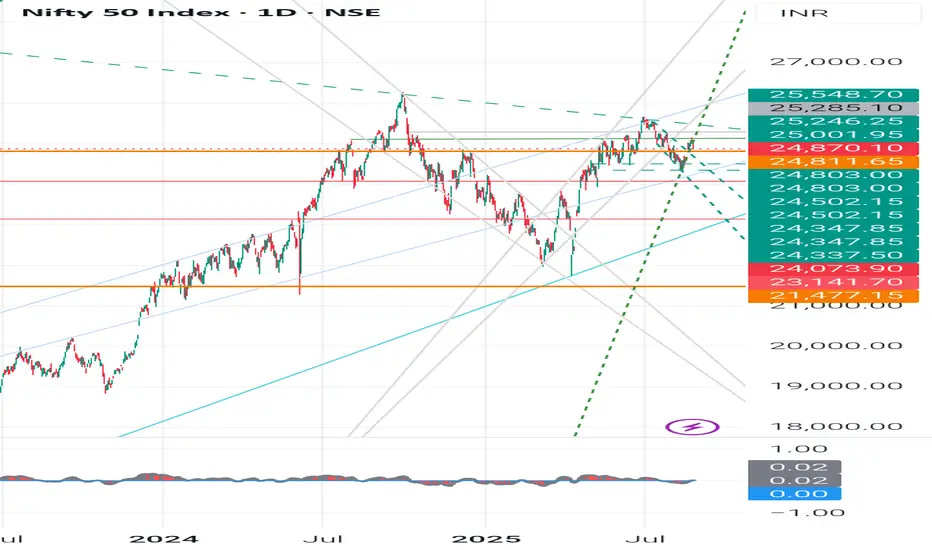
Current Price (CMP): 25,070
Trend: Sideways consolidation between 24,500 - 25,500 levels.
Chart Pattern:
Multiple tests of 25,500 - strong resistance.
Multiple supports around 24,500 - 24,800 - strong demand zone.
The broad pattern looks like a Rectangle / Range-bound movement.
Swing Analysis:
Higher swing lows visible after 24,000 - bullish undertone.
Lower swing highs at 25,500 - supply pressure.
Key Levels
- Immediate Resistance: 25,250 - 25,550 - 26,000
- Immediate Support: 24,800 - 24,500 - 24,073
Major Support: 23,141 - 21,477 (long-term trend support)
👉Candlestick Learnings (Recent Pattern)
Recent candles show long wicks both sides - market indecision (buyers & sellers fighting).
A strong green bullish engulfing candle near 24,500 support - sign of buyers stepping in.
Current candles forming inside bars - breakout move expected soon (either above 25,500 or below 24,500).
✍️Student Learning Point:
When candles show long wicks near support - it signals accumulation.
When candles cluster near resistance - expect breakout/reversal.
Always confirm with volume before taking position.
Fundamental Comparison - Nifty Competitors (Index Peers)
Since Nifty 50 is an index, let’s compare with other global indices (macro investing perspective):
Index P/E Ratio Dividend Yield 5Y CAGR Returns Volatility
Nifty 50 -22-23 -1.2% -13% Moderate
Sensex -24 -1.1% -12% Moderate
Dow Jones -21 -1.7% -9% Lower
Nasdaq 100 -28 -0.9% -15% High
Shanghai Comp -17 -2.0% -5% Moderate
Learnings:
Nifty has a healthy P/E (not cheap, not too expensive).
Growth rate is higher than global averages - India is attractive long-term.
Volatility is moderate, making Nifty good for SIP investors & long-term compounding.
Investment Learnings for Students
1. Candlestick Patterns: Learn basics like Doji, Engulfing, Hammer, Shooting Star - they often show reversal/continuation.
2. Swing Analysis: Markets move in swings (higher highs/lows in uptrend, lower highs/lows in downtrend). Recognizing them helps in entry/exit.
3. Support & Resistance: Always mark key levels before trading/investing.
4. Fundamentals: Don’t just look at charts - check P/E, dividend yield, EPS growth, sector weightage.
5. Risk Management: Use stop-loss in trading. For investing, use SIP & diversify.
⚠️ Disclaimer
This analysis is for educational purposes only. Not a SEBI-registered advisory. Students & investors should do their own research or consult a financial advisor before making decisions.
#Nifty50 #StockMarketIndia #TechnicalAnalysis #InvestingForBeginners #CandlestickPatterns #SwingTrading #SupportAndResistance #StockMarketEducation #MarketLearning
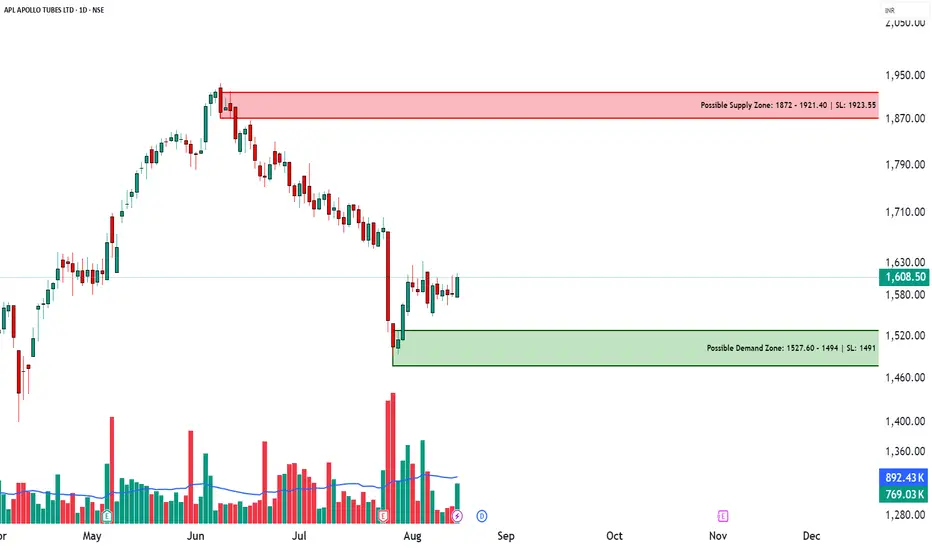
APLAPOLLO – Technical & Educational Snapshot📊 APLAPOLLO – Technical & Educational Snapshot
Timeframe: Daily / Weekly / Monthly
Overall Bias (for learning): ⭐⭐⭐⭐ Moderately Bullish – supply & demand zones identified, breakout study in progress
🔹 Candlestick Observations
Daily Bullish Piercing → Bullish Engulfing Buyers showing short-term strength
Weekly Three Black Crows → Bullish Engulfing Bearish pressure absorbed; case study of reversal attempt
Monthly NA No clear signal on higher timeframe
🔹 Supply & Demand Zones (Learning Reference)
Supply Zone (Resistance area): ₹1872 – ₹1921.40
(Stop Loss Ref: 1923.95 → possible invalidation if breached)
Demand Zone (Support area): ₹1494 – ₹1527.60
(Stop Loss Ref: 1491 → possible invalidation if broken)
🔹 Technical Observations
✅ Strong bullish candles forming
✅ Bullish Engulfing → buyer dominance visible
✅ Open = Low → intraday bullish bias illustration
✅ Double Wick → rejection from lower levels
✅ Breakout probability higher if weekly channel is cleared
📊 Volume Study
Any breakout is more reliable when supported by higher-than-average volume.
Traders typically wait for volume confirmation alongside bullish candlestick follow-through before validating a breakout.
📌 Summary (Learning View Only)
APLAPOLLO is a useful case study in demand-supply dynamics and bullish engulfing setups.
Lesson: Breakouts above consolidation + volume confirmation often strengthen trend continuation.
⚠️ Disclaimer (SEBI-Compliant)
This post is for educational & informational purposes only. It is not a buy/sell recommendation, not research, and not investment advice.
I am not a SEBI-registered advisor. Examples are for learning through chart patterns and public market data. Please consult a SEBI-registered financial advisor before making investment decisions.
💬 Found this useful?
🔼 Tap Boost so more traders can learn from structured analysis.
✍️ Share your views in the comments — let’s grow together.
✅ Follow @simpletradewithpatience for clean, zone-based setups & beginner-friendly market education.
🚀 Stay Calm. Stay Clean. Trade With Patience.
Trade Smart | Learn Zones | Be Self-Reliant 📊
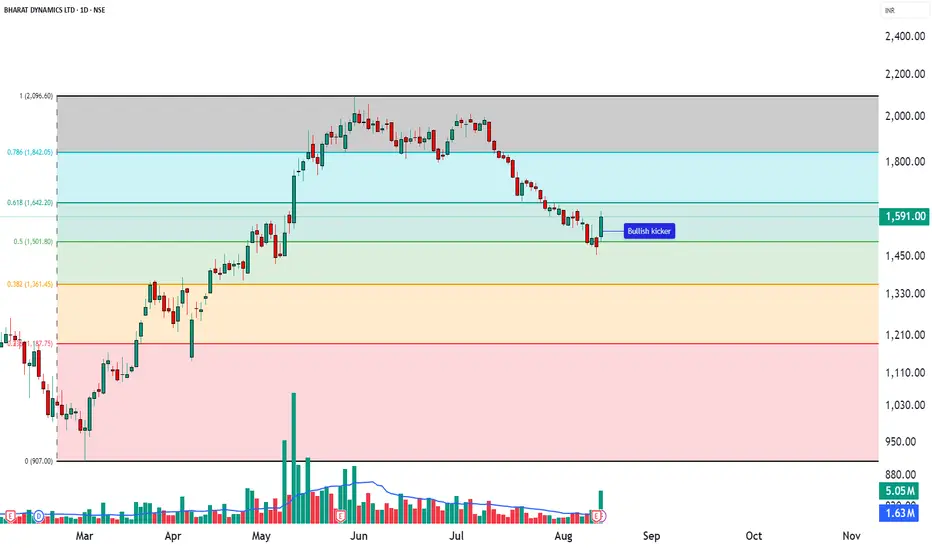
BDL - “Bullish Kicker Candlestick – Educational Analysis” ________________________________________
📊BDL – Technical & Fundamental Educational Snapshot
Ticker: NSE: BDL | Sector: 🏭 Defence & Aerospace
CMP: ₹1,591 ▲ (as of 13 Aug 2025)
Rating: ⭐⭐⭐⭐ (Moderately Bullish Setup – Educational Purposes Only)
Pattern Observed: 📈 Bullish Kicker Candlestick Pattern
________________________________________
Bullish Kicker Candlestick – Educational Analysis (BDL, NSE)
The Bullish Kicker is a strong reversal candlestick pattern, signaling a sudden shift from bearish to bullish sentiment. Studying this pattern helps traders understand price action and momentum dynamics.
________________________________________
Key Features:
Gap up from previous candle → sudden change in market sentiment.
No overlap between candle bodies → shows aggressive bullish control.
Bears initially in control, but strong buying pushed the price higher.
________________________________________
💡 Volume Confirmation
Kicker candle volume: 5.05M, compared to 20-day average of 1.63M.
Higher-than-average volume indicates strong participation and validates momentum from an educational perspective.
________________________________________
Support & Resistance Zones
📈Support Zones: 1525, 1460, 1417
📉 Resistance Zones: 1633, 1676, 1741
Patterns near strong support or after a downtrend are typically more reliable for educational analysis.
________________________________________
🔍 Indicator Insights
RSI: 42 – recovering from oversold levels.
VWAP: Bullish – indicates intraday support and momentum.
These indicators provide additional context for studying the pattern, not for direct trading decisions.
________________________________________
⚖️ Trade Planning Concepts (Educational Only)
Entry Concept: Observe the close of the kicker candle, or wait for the next candle to break above its high.
Stop Loss Concept: Slightly below the low of the kicker candle (~1502).
Reference Levels: Nearby resistance zones (1633, 1676, 1741) or risk-reward frameworks.
________________________________________
💡 Risk Management Concepts
Limit risk per study trade (e.g., 1–2% of capital).
Patterns may fail if subsequent price action invalidates the momentum.
________________________________________
Note: Bullish Kickers often follow impactful news or earnings. Observing volume and confirmation indicators is essential to understand price action dynamics.
________________________________________
⚠️ Disclaimer – Please Read Carefully
The information shared here is meant purely for learning and awareness. It is not a buy or sell recommendation and should not be taken as investment advice. I am not a SEBI-registered investment advisor, and all views expressed are based on personal study, chart patterns, and publicly available market data.
Trading — whether in stocks or options — carries risk. Markets can move unexpectedly, and losses can sometimes be larger than the money you have invested. Past performance or past setups do not guarantee future results.
If you are a beginner, treat this as a guide to understand how the market works — practice on paper trades before risking real money. If you are an experienced trader, remember to assess your own risk, position sizing, and strategy suitability before entering any trade.
Data, prices, and analysis are based on information available as of 12 August 2025, and market conditions can change at any time. Always verify with reliable sources and consult a SEBI-registered financial advisor before making any real trading decision.
By reading, watching, or engaging with this content, you acknowledge that you take full responsibility for your own trades and investments.
________________________________________
💬 Found this useful?
Drop your thoughts, questions, or setups in the comments — let’s grow together!
🔁 Share this post with fellow traders and beginners to spread clean, structure-based learning.
✅ Follow simpletradewithpatience for beginner-friendly setups, price action insights, and disciplined trading content.
🚀 Stay Calm. Stay Clean. Trade With Patience.
Trade Smart | Learn Zones | Be Self-Reliant 📊
________________________________________
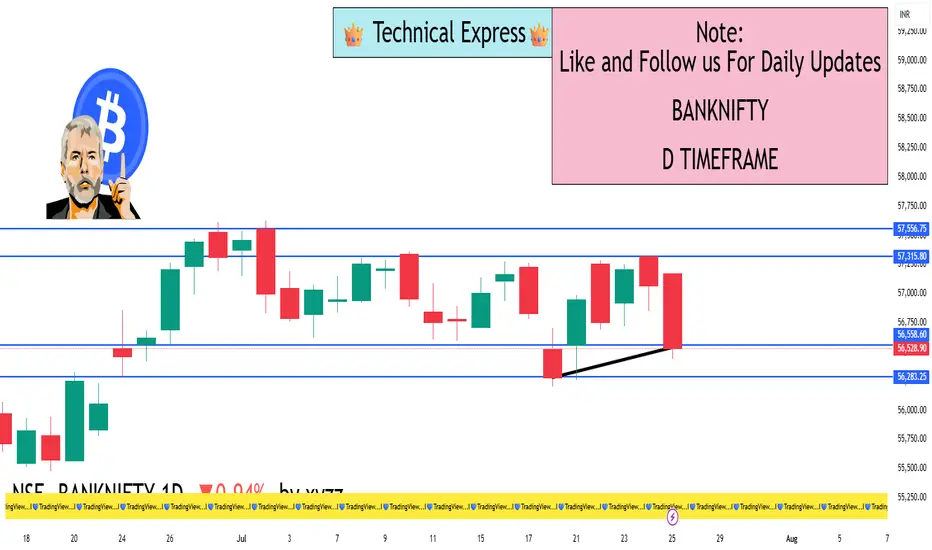
BANKNIFTY 1D TimeframeClosing Value: 56,528.90
Net Change: −537.15 points (−0.94%)
Opening Price: 57,034.40
Day’s High: 57,170.70
Day’s Low: 56,439.40
Trend: Bearish
📊 Technical Analysis
✅ Candle Pattern:
A strong bearish candle was formed.
Price opened higher but failed to sustain and closed near the day’s low — a sign of heavy intraday selling.
🔻 Support Zones:
56,400 – Immediate support (also the day's low)
56,000 – Psychological round number
55,750 – Medium-term support (from earlier price consolidation)
🔺 Resistance Zones:
56,800 – Near-term resistance
57,000 – Critical level; needs to be reclaimed for bullish reversal
57,300 – Stronger resistance zone based on recent highs
📈 Indicator Summary:
RSI (Relative Strength Index): Likely below 50, signaling weakening bullish momentum
MACD (Moving Average Convergence Divergence): Bearish crossover remains intact
Volume: Higher than average, suggesting institutional selling pressure
🧠 Market Sentiment:
Bearish sentiment prevailed across major banks including HDFC Bank, ICICI Bank, Axis Bank, Kotak Bank, and SBI
Pressure also visible in PSU banks (like PNB, Bank of Baroda, Canara Bank)
Overall market mood was risk-averse due to global uncertainty and potential interest rate impact
Foreign Institutional Investors (FIIs) continued their selling streak
Traders remain cautious ahead of upcoming quarterly bank results
✅ Conclusion:
Bank Nifty is currently in a short-term downtrend.
If 56,400 breaks decisively, it may head toward 56,000 and 55,750.
For bulls to regain strength, Bank Nifty must cross back above 57,000 with strong volume and momentum.
High-Probability Scalping Techniques🔍 What Is Scalping?
Scalping is a fast-paced intraday trading style where traders aim to take multiple small profits throughout the trading day. Instead of holding trades for hours or days, scalpers may be in and out of trades within minutes or even seconds.
Scalping is all about:
Quick entries and exits
High accuracy
Controlled risk
Small but frequent gains
The core idea? “Many small wins add up to a big win.”
Scalping works best in liquid markets, like Nifty, Bank Nifty, large-cap stocks, or high-volume futures and options.
💡 Why Do Traders Choose Scalping?
Scalping is perfect for traders who:
Have limited capital but want to grow it steadily
Prefer not to hold positions overnight (no gap-up/gap-down risk)
Love short-term action and decision-making
Want to trade professionally in 1-2 hours daily
Also, scalping can reduce your exposure to market news, global events, or overnight uncertainty.
But remember: scalping isn’t easy. It’s a skill. You need discipline, speed, and a proven strategy.
🎯 Key Characteristics of High-Probability Scalping
To make scalping successful, your strategy must include:
Factor Requirement
Speed Fast entries and exits with minimal slippage
Liquidity Trade only stocks/indexes with high volume
Precision Narrow stop losses, clear targets
Discipline No emotions, stick to plan
Risk Management Small risk per trade, compounding over time
🧠 Scalper's Mindset: Think Like a Sniper, Not a Machine Gunner
You’re not shooting randomly. You’re waiting patiently for high-probability opportunities where the odds are clearly in your favor.
Scalping is not about trading more—it’s about trading better.
🔧 Tools Every Scalper Needs
Before we dive into strategies, here’s what you must have in place:
Fast internet connection
Live market depth / Level 2 data
5-min, 1-min, and tick charts
Hotkeys for fast order placement
Broker with low brokerage per trade
Scalping involves dozens of trades per session, so costs matter!
🛠️ High-Probability Scalping Techniques (Explained in Human Language)
Let’s now explore some proven techniques that many experienced scalpers use.
🔹 1. VWAP Bounce Strategy
VWAP = Volume Weighted Average Price. It tells you the average price where most volume happened during the day.
📌 Concept:
In a trending market, price often bounces off VWAP before continuing the trend.
You trade that bounce.
✅ Rules:
Identify trend (price above VWAP = uptrend, below = downtrend)
Wait for a pullback to VWAP
Look for confirmation (like a bullish candle in uptrend)
Enter trade with tight SL below VWAP
Target = 0.5% to 1% move
🔍 Chart Timeframe:
1-minute or 5-minute candles
Ideal for: Nifty/Bank Nifty, Reliance, HDFC, SBIN, INFY
🔹 2. Opening Range Breakout (ORB)
This is a classic scalping setup used in the first 15–30 minutes of market open.
📌 Concept:
First 15-min range defines the initial battle between buyers/sellers.
Breakout from this range = strong momentum.
✅ Rules:
Mark high and low of 15-min candle from 9:15 to 9:30
Buy when price breaks above the high + volume rises
Sell when price breaks below the low + volume rises
SL = below/above opposite side of the range
Target = 1:1 or trail profit
💡 Tip:
Works best on trending news days or earnings release days.
🔹 3. Scalping Breakouts with Volume Confirmation
A breakout is only real if volume supports it. Otherwise, it’s a trap.
✅ Rules:
Use 5-minute chart
Identify consolidation (flat price action with narrow range)
Watch for breakout with spike in volume
Enter with SL just outside the range
Exit with a 1:1 or 1.5:1 risk-reward
🎯 Indicators:
Bollinger Bands tightening
Volume histogram
Price breaking upper/lower band
🔹 4. RSI Divergence Scalping
You can scalp reversal points using RSI divergence.
✅ Rules:
Use 5-min or 3-min chart
RSI near 70 or 30 signals overbought or oversold
If price makes higher high but RSI makes lower high → Bearish divergence
If price makes lower low but RSI makes higher low → Bullish divergence
Enter for quick reversal scalp
SL = recent swing high/low
Target = VWAP or recent pivot
🔹 5. News-Based Scalping
Scalping on earnings releases, news events, or market-moving headlines can be profitable—but risky.
✅ Approach:
Stick to high-volume large-cap stocks
Avoid holding more than a few minutes
Use Level 2 order book to watch supply/demand shifts
Trade the initial burst, exit quickly
📈 Ideal Indicators for Scalping
VWAP
RSI (5 or 14-period)
Bollinger Bands
EMA crossover (e.g., 8 EMA vs 21 EMA)
MACD (fast settings for short-term signals)
But remember: indicators are tools, not guarantees. Always combine them with price action and volume.
📉 Risk Management: The Scalper’s Shield
This part matters even more than the strategy itself.
Rule Explanation
Risk only 0.5% to 1% of capital per trade Protects you from wipeout on a bad day
Always have a stop-loss No SL = no survival
Don’t average losing trades You’re scalping, not investing
Exit on SL or target—no emotion Don’t hope, don’t pray
Track your win-rate Aim for 60%+ with 1:1 risk-reward
🧮 Sample Scalping Day Plan
Time Action
9:15–9:30 AM Watch first 15-min candle for ORB
9:30–11:00 AM Take 2-3 high-quality trades (VWAP bounce, RSI scalp)
11:00–2:00 PM Avoid choppy markets or only scalp consolidations
2:00–3:00 PM Look for afternoon breakouts
3:00–3:20 PM Avoid taking fresh trades, exit open ones
🔁 Scalping Checklist
Before you place any trade, ask yourself:
✅ Is the setup clear and backed by volume?
✅ Am I trading with the trend or against it?
✅ Is my SL defined and within risk limit?
✅ Am I emotionally calm and focused?
✅ Is this a high-probability or random trade?
📊 Example of a High-Probability Scalping Trade
Stock: Reliance
Chart: 1-min
Setup: VWAP bounce + bullish engulfing candle
Entry: ₹2,950
Stop-Loss: ₹2,944
Target: ₹2,958
Result: Profit of ₹8 per share in 3 minutes
This may look small—but scalpers do 5–10 such trades a day, scaling with quantity.
🚨 Common Mistakes to Avoid
❌ Overtrading (more is not better)
❌ No plan or random entries
❌ Chasing trades late
❌ Holding scalps like swing trades
❌ Trading during news without preparation
❌ Ignoring transaction costs
🧾 Final Words: Is Scalping Right for You?
Scalping is not for everyone. It requires:
High focus and speed
Strong discipline
Quick decision-making
Excellent risk control
But if you develop the skill, it can provide:
Daily consistency
Limited overnight risk
Quick compounding
Full control over trades
✅ Start small.
✅ Practice on paper or low quantity.
✅ Use one strategy, track results, then scale up.
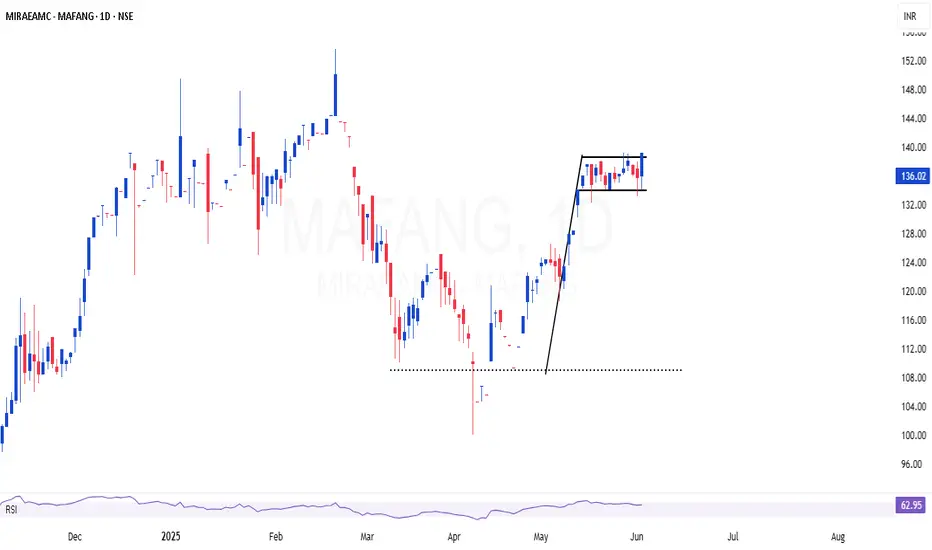
MAFANG | Excellent bull flag setup in top class index fundMAFANG 🏁| Strong buy in top class index fund 👌
-Strong uptrend supported by volume
-Consolidation near all-time highs — bullish structure
-Global tech dominance + AI tailwinds
MAFANG (Meta, Apple, Facebook, Amazon, Netflix, Google) is showing solid momentum and forming a strong technical base in a top-tier index fund.
Inside Bar Ignites a Clean Breakout🟢 Simple Breakout Structure | Supply-Demand Flip
✅ Strong demand zone formed after multiple rejections
🔻 Previous supply zone clearly respected
📉 One active counter-trendline broken
🔍 Breakout of mother candle with an inside bar setup
📈 Volume expansion on breakout
🟠 Also broke a hidden resistance line, adding confluence
🧭 Chart structure remains smooth and clear, respecting zones well
No predictions. Just structure.
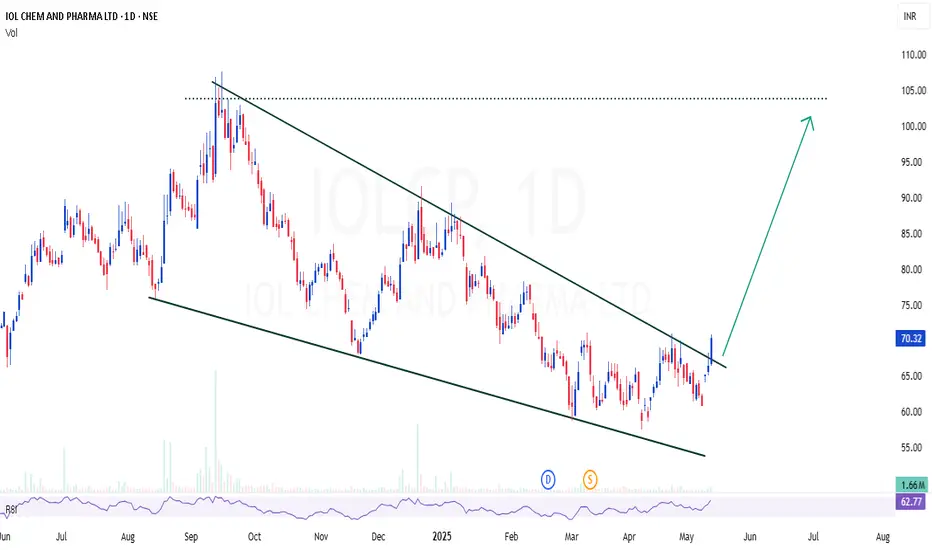
IOLCP | Perfect channel / wedge breakout - Looks good for 50%IOLCP | Perfect channel / wedge breakout - Looks good for 50%
CMP : 70
SL : 60
Target : 100
TRENT LTD – INTRADAY ZONE ANALYSIS________________________________________________________________________________
📈 TRENT LTD – INTRADAY ZONE ANALYSIS
📆 Date: July 1, 2025 | ⏱ Timeframe: 15-Minute Chart
🔍 Educational Analysis for Learning Purposes Only
________________________________________________________________________________
📊 Zone Breakdown:
• 🔴 Top Range Resistance – 6,261
Marked in Red: This is a key supply zone where the price has previously stalled. Traders should watch for bearish reversal candlestick patterns like a bearish engulfing, evening star, or long upper wick rejection. A lack of follow-through volume here may indicate exhaustion.
• 🟠 Neutral Zone – Avoid Trade Area (6,155 – 6,210)
Marked in Orange: Price tends to be indecisive here. This is a “no trade zone” unless supported by a strong trend direction and setup. Historically, it has shown sideways movement and choppy behaviour.
• 🟢 Demand Zone – 6,105 to 6,066.50 | SL: 6,058.10
Marked in Green: Price reacted sharply from this zone with rising volume. A bullish engulfing candle confirmed demand here. Ideal for watching pullback opportunities on re-tests, supported by bullish confirmation candles.
• 🟩 Bottom Support – 5,968
A strong base level. A breakdown below this zone may signal a shift in short-term structure. Look for volume spike and wide-bodied red candle for bearish confirmation.
________________________________________________________________________________
🔍 Candlestick Observation:
At the Top Resistance Zone (6261), recent candles show upper wicks and indecision, but no strong bearish reversal yet. Volume is elevated, signaling activity, but candles show hesitation.
🧠 Interpretation: This could be an early sign of supply pressure. A follow-up bearish engulfing or strong rejection candle may validate a reversal. Until then, price may consolidate within the zone.
________________________________________________________________________________
⚙️ Educational Trade Ideas (Study Purpose Only)
▶️ Reversal Setup – Bearish Bias
• Entry: Below ₹6,190 on confirmation candle from resistance zone
• Stop Loss: Above ₹6,265
• Risk-Reward: 1:1 | 1:2 +
• 🧠 Ideal for learning how price reacts to supply after a sharp rally
________________________________________________________________________________
▶️ Pullback Setup – Bullish Bias
• Entry: Near ₹6,100–₹6,110 on bullish confirmation from demand zone
• Stop Loss: ₹6,058
• Risk-Reward: 1:1 | 1:2 +
• 🧠 A classic “Breakout–Retest–Continuation” setup with proper risk management
________________________________________________________________________________
⚠️ Disclaimer (SEBI-Compliant):
This content is shared strictly for educational and informational purposes only. It does not constitute investment advice or a trading recommendation. Always consult a SEBI-registered financial advisor before making investment decisions.
STWP | Learn. Trade. Grow.
________________________________________________________________________________
💬 What do you think about this TRENT setup?
Did you observe any volume divergence or trendline reaction?
👇 Drop your insights in the comments — let’s grow together!
________________________________________________________________________________
Bonus:

MARUTI SUZUKI INDIA LTD. – INTRADAY ZONE ANALYSIS________________________________________________________________________________📈 MARUTI SUZUKI INDIA LTD. – INTRADAY ZONE ANALYSIS
📆 Date: June 29, 2025 | ⏱ Timeframe: 15-Minute Chart
🔍 Educational Analysis for Learning Purposes Only
________________________________________________________________________________
📊 Zone Breakdown:
• 🔴 Top Range Resistance – 12,848
Marked in Red: This area has previously acted as a supply zone, where prices were rejected sharply. It is a potential region to watch for bearish reversal patterns, especially if price rises into this zone on weak volume or shows rejection candles like shooting star or bearish engulfing.
• 🟠 Neutral Zone (No Trade Zone) – Between ~12,720 to ~12,680
Marked in Orange: This is an indecision zone, where price has shown choppiness in the past. It is advisable to stay cautious and avoid trades here, as clear momentum is often missing in this range.
• 🟢 Support Zone – 12,617
Marked in Green: This is the demand zone, where price previously reversed on higher volume. It is a good region to observe for bullish candlestick confirmation patterns (e.g., hammer, bullish engulfing, morning star) on intraday timeframes.
________________________________________________________________________________
🔍 Candlestick Pattern Observation:
At the support zone (12,617), the most recent candle (the last one) shows a long lower wick with a bullish body, forming a bullish hammer-like structure.
• 🧠 Interpretation: This suggests possible buying interest at lower levels, especially since it coincides with volume spike, indicating potential reversal.
• 📌 However, confirmation from the next candle (closing above 12,670 with decent volume) would be required before validating it as a bullish reversal.
________________________________________________________________________________
⚙️ Educational Trade Idea (For Study Purpose Only):
▶️ Potential Long Trade Setup (Bullish Bias)
• Entry (Low-Risk Learner Zone): Around 12,670–12,675, only if next candle shows bullish strength
• Stop Loss: Below 12,617 (zone low) → e.g., 12,600
🧠 Reasoning:
• Price is reacting from a well-identified demand zone
• Volume spike confirms possible accumulation
• Candle with rejection wick hints at reversal interest
• Risk-reward approx. 1:2 or better depending on exit point
________________________________________________________________________________
⚠️ Disclaimer (SEBI-Compliant):
This analysis is shared strictly for educational and informational purposes. It does not constitute investment advice or a recommendation to trade. Viewers are encouraged to use this for learning technical chart reading and should consult a registered advisor before making any financial decisions.
STWP | Learn. Trade. Grow.
________________________________________________________________________________
What do you think about this setup?
Did you spot any other patterns or zones?
👇 Drop your comments below — let’s grow together!
________________________________________________________________________________

Weekly CT Breakout + 200EMA Flip | GALAXYSURF Structure📉 Main CT Line (Dotted White)
A well-defined counter-trendline finally gave way after weeks of price compression. The breakout was clean, with a strong bullish candle closing decisively above it.
📊 Volume Confirmation
Breakout candle posted a solid spike in volume — the highest weekly volume in months. 💥
📈 200 EMA Broken (Blue Line)
Price has also cleared the 200-week EMA, a key dynamic resistance, now potentially flipping to support. 📉
🟧 Higher Timeframe Supply (Orange Line) / ⚪ (White Lines)
The breakout candle has also stepped into a tight zone between Weekly + Monthly supply, marked by the orange line.
📌 As always, the chart tells the story. No predictions. No assumptions, just structure.

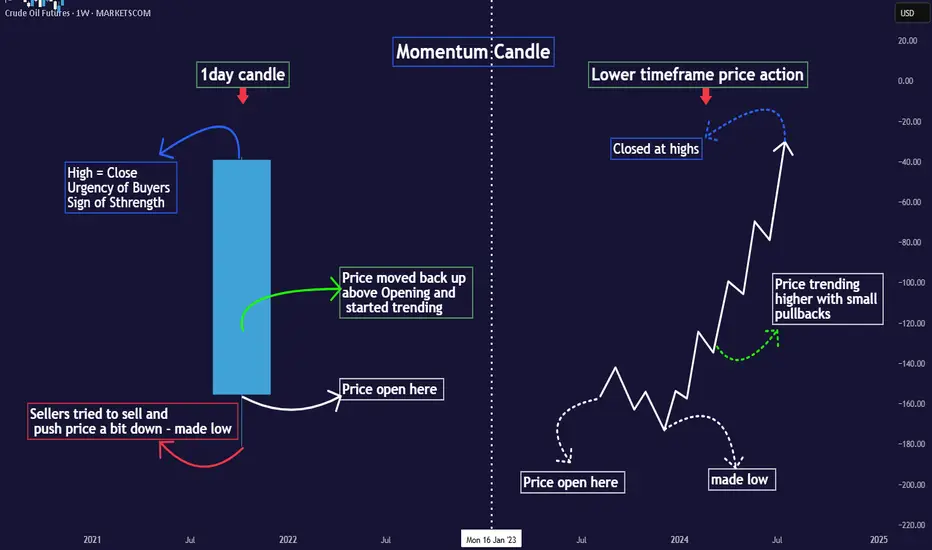
Simplified Approach to read Candlesticks -Easy Candles ~ Part 1MARKETSCOM:OIL
Introduction
⦿ Candles form the basis of chart creation and analysis.
⦿ A weak foundation can destabilise your entire structure. This thread will clarify and simplify your understanding of price candles.
I use two types of candles on charts:
1. Momentum/trending candles
2. Ranging/trading candles
Understanding these eliminates the need to memorize complex candle names (e.g., Marubozu, Harami bullish) cause every candlestick pattern is formed with combination of these 2 candels only.
Definitions:
⦿ Momentum candle: Body >50% of total size
⦿ Range candle: Body <50% of total size
Decode Momentum Candle
⦿ Only Buyers here - Clear Trend
Decode Range Candle
⦿ Both Buyers & Sellers here - No Trend
⦿ Indecision mode among participants.
⦿ Understand what major players did in the last candle to predict their next move.
⦿ Don't just memorise candle names; grasp the psychology behind them.
⦿ I'll share the levels of candle strength to elevate your candle reading.
♦️Stay tuned and follow for more educational
content.
HYUNDAI | Channel breakout ahead - Looks good for 30%HYUNDAI | Channel breakout ahead - Looks good for 30%
CMP : 1861
SL : 1700
Expecting breakout in this channel,
Has good support to take measured risk - small stoploss
The previous swing high is also works as Fib support

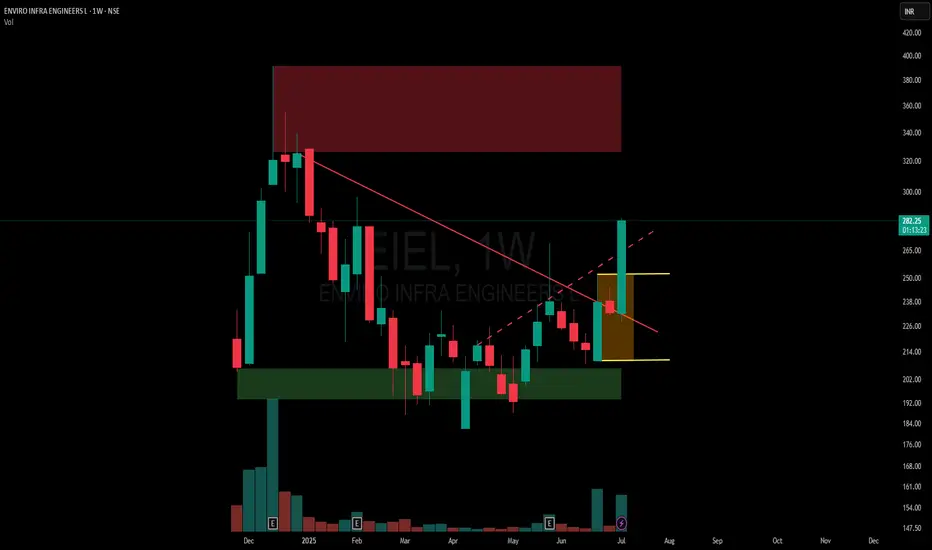
BEPL | Yet another good monthly candle at excellent areaBEPL | Yet another good monthly candle
Excellent area of value at this location
Breakout after 7 years consolidation and retesting
High probable setup for doubling
CMP : 119

KOTAKBANK | Full 5+ years range consolidation and breakoutKOTAKBANK | Full 5+ years range consolidation and breakout in monthly time frame
CMP : 2074
Stable bluechip stock - can expect atleast 40% ROI from here

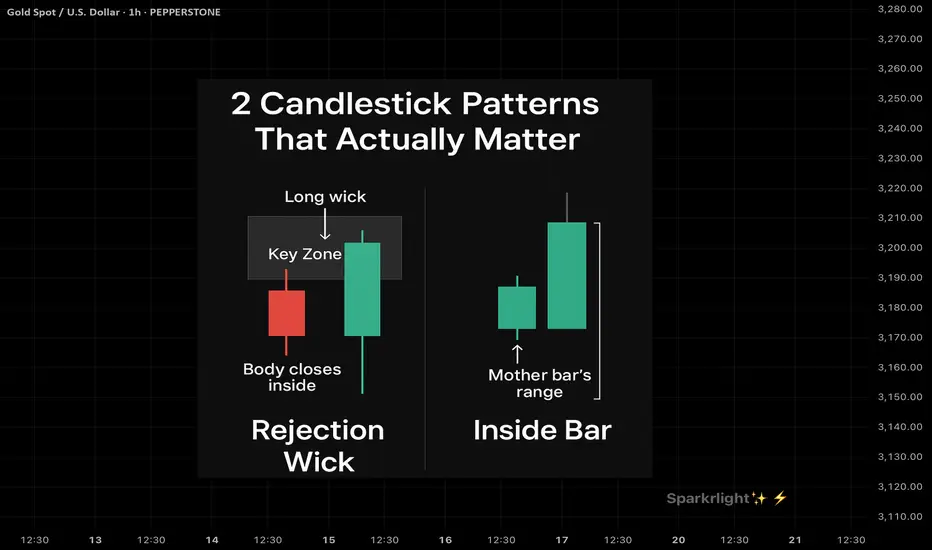
2 Candlestick Patterns That Actually Work — when used right !Intro:
Most traders learn candlestick patterns from cheat sheets —
Engulfing, doji, hammer, shooting star…
But not all patterns are created equal.
The key isn’t memorizing names — it’s understanding which ones hold real weight when used with structure.
Here are 2 powerful candlestick patterns that can shift the game — if you know when to trust them.
⸻
1. The Rejection Wick with Body Close Inside Structure (a.k.a. Rejection Candle)
What It Looks Like:
• A long wick that pierces above/below a key zone
• Candle body closes back inside the range
• Usually forms at OB, FVG, or liquidity sweep zones
Why It Works:
• It shows trapped traders and smart money rejection
• Confirms a false breakout and reclaim of intent
• Often leads to strong reversals or clean follow-throughs
When To Use It:
• After liquidity sweep
• Near HTF zone (OB / supply-demand)
• When followed by structure shift or BOS
Pro Tip: Combine with session awareness (NY / London open) for killer confluence.
⸻
2. The Inside Bar (Breakout Continuation Bar)
What It Looks Like:
• A small candle completely inside the range of the previous candle
• Price consolidates within one bar’s high-low range
• Often signals coiled pressure
Why It Works:
• It shows price resting before continuation
• When it forms near structure (OB or demand), the breakout that follows is often explosive
• Stop-loss is easy to place (above/below the mother bar)
When To Use It:
• After a BOS or clean impulse
• As a continuation signal on HTF
• Inside compression → expansion zones
Pro Tip: Trade the breakout of the inside bar with bias confirmation — not in both directions.
⸻
Final Word:
Candlestick patterns don’t work on their own.
They work when:
• Context is clear
• Liquidity has been handled
• Market structure aligns
If you trade candles without logic, you’re reacting to emotion.
But when you pair them with narrative and zones?
They become weapons.
Reliance - Price action channel + Candlestick + RSIKey Observations from the Chart
Channel Structure -
Both resistance and support lines have been tested multiple times with precise reactions
The most recent price action shows a strong rejection at the lower channel boundary
Candlestick Formation-
This month printed a textbook strong lower wick rejection candle:
Long lower wick indicates buyers aggressively stepping in at support
RSI Confluence-
The RSI tells a compelling complementary story:
Recently retested COVID-era levels (historic oversold territory)
Has since established higher highs and higher lows (bullish structure)
Shows positive divergence with price (RSI making HHs while price tests support)

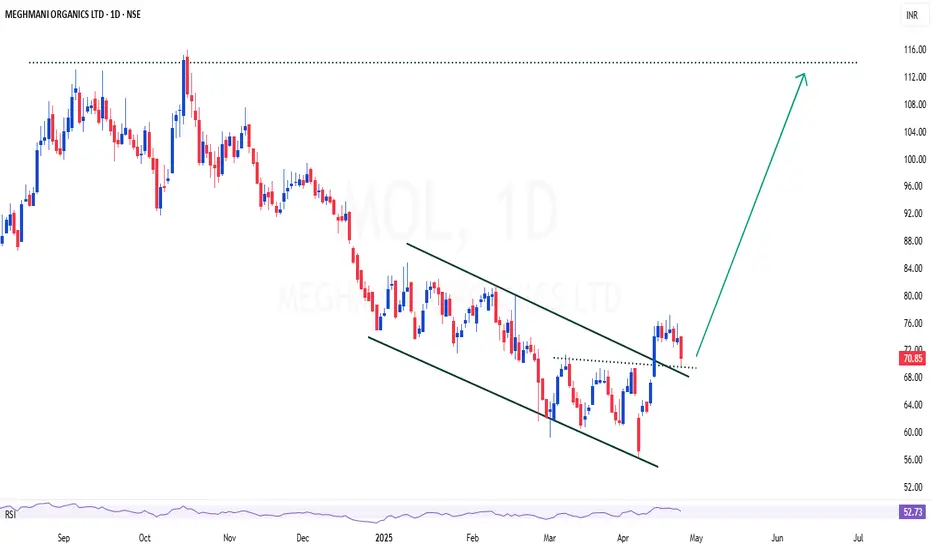
MOL | One more time - trying to take position with stoplossMOL | One more time - trying to take position with stoploss
As this is my favorite stock, but its under performing for a long time. This setup looks good for 50-60% for short term.
Trendline + Small channel breakout
CMP : 70
SL : 65
Target : 110
XAUUSD Next Move 2800 ? 🪙 FUNDAMENTALS:
✅China on Friday struck back at the U.S tariffs imposed by Trump with a slew of counter-measures including extra levies of 34% on all U.S. goods and export curbs on some rare-earths, deepening the trade war between the world's two biggest economies.
✅ More than 50 nations have reached out to the White House to begin trade talks since Trump rolled out sweeping new tariffs, top officials said on Sunday as they defended levies that wiped out nearly $6 trillion in value from U.S. stocks last week.
✅ Federal Reserve Chairman Jerome Powell said tariffs increased the risk of higher inflation and slower growth, highlighting the difficult path ahead for policymakers at the U.S. central bank
________________________________________
🔍 4H Hour Timeframe Analysis
📊 Trend & Price Action :
• Previous Trend: Clear uptrend inside a rising channel (marked by red lines).
• Recent Price Movement: Price broke down below the ascending channel, signaling trend weakness or possible reversal.
• Strong bearish candles show increased selling pressure recently.
📉 Key Technical Levels:
• Support Zone: Around $2,979–$2,957 (green and grey lines) — price bounced here, showing buyer interest.
• Resistance Zone: Around $3,057–$3,077 — a previous support zone now acting as resistance after the breakdown.
• Moving Averages:
o Red Line (likely 50 EMA): Recently broken down, now acting as dynamic resistance.
o Blue Line (likely 200 EMA): Around $2,990, price tested and bounced — this is often a key support in a trend.
🧠 Interpretation:
• Price broke structure (channel and EMAs), signaling a shift from bullish to bearish bias.
• The bounce from the 200 EMA and support zone suggests a potential short-term retracement or consolidation.
• If price fails to reclaim $3,057–$3,077, sellers may re-enter.
________________________________________
🔍 15-Minute Timeframe Analysis
📊 Trend & Price Action:
• Sharp intraday recovery from the low of around $2,957 to the current $3,033.
• But price is now facing resistance from a supply zone (highlighted in red).
• You’ve marked an Order Block (OB) around $3,125–$3,140 — a zone where institutional selling might have started.
📉 Key Levels:
• Resistance Zones:
o $3,076 (blue line) – likely 200 EMA, strong resistance.
o $3,057–$3,076 – supply area and previous breakdown zone.
o Order Block (OB) near $3,125–$3,140 – strong institutional resistance zone.
• Support Zones:
o $3,000, $2,978, and $2,957 – these are lower supports where price previously bounced.
🧠 Interpretation:
• Short-term, the price is retracing from a heavy drop.
• Watch how price behaves at $3,057–$3,076:
o Rejection = possible short setup.
o Break & close above = retracement could continue toward OB ($3,125).
• The OB is a potential reversal zone, where price could get heavily rejected if tested.
________________________________________
📌 Beginner Takeaways:
Trend is weakening – the uptrend broke, and the market is forming lower highs and lower lows.
Price is trying to recover from key support zones but facing resistance overhead.
Volume is increasing near support — shows interest from buyers but not a confirmed trend reversal yet.
The Order Block is a great place to watch for reversal trades (supply zone = potential sell).
________________________________________
✅ Suggested Actions for Practice:
Mark key support/resistance zones on your own chart to develop your structure-reading skills.
Scenario 1: Short if price rejects at $3,057–$3,076 zone.
Scenario 2: Long only if price closes above $3,077 and holds support.
Observe how price behaves near moving averages and OB zones
.
________________________________________
👉 Always follow TP/SL to protect your capital and maximize profits!
Disclaimer: This is for educational purposes only.
Always trade responsibly and manage your risk effectively

Gold Next Move 3100?4-Hour Chart (Mid-Term View)
🔑 Key Observations:
Uptrend Remains Intact:
Price is still above the 50 EMA, indicating continued bullish strength.
Key Resistance at $3,038:
A break above this level could trigger further upside momentum.
Support Levels:
$3,011 and $3,007: First support zone.
$2,983: Stronger support.
Potential Scenario:
Bullish Breakout: If price breaks above $3,038 , the next target would be $3,048 and beyond.
🔸 Failure to Breakout : If rejected at resistance, price might retrace to $3,011 or lower.
1-Hour Chart (Short-Term View)
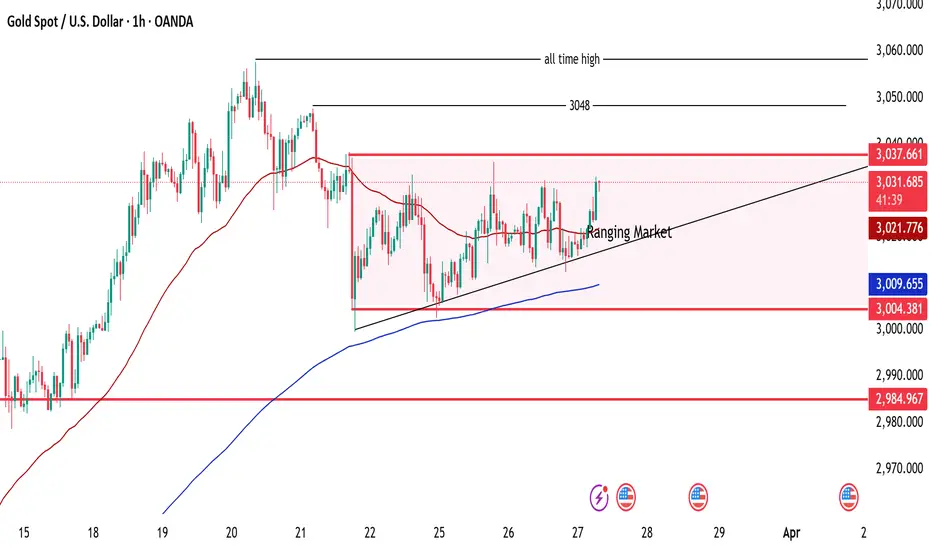
🔑Key Observations:
✅ Ranging Market: Gold is consolidating within a horizontal range between $3,009 and $3,037, forming a sideways movement.
✅ Ascending Trendline : The price is gradually increasing with a rising trendline acting as dynamic support.
🔸Key Resistance Levels:
$3,037-$3,048: Strong resistance zone.
All-Time High Above $3,057.5: Major resistance if the price breaks above $3,048.
✅Support Levels:
🔹$3,021 - 3,009: Key intraday support zone.
🔹$3,004 and $2,985: Stronger support zones below.
Moving Averages:
Price is above the 50 EMA (red line), indicating bullish strength.
The 200 EMA (blue line) is far below, showing overall long-term bullish sentiment.
💡 Potential Trade Setup:
🔹Breakout Strategy: A breakout above $3,037-$3,048 could lead to new highs.
Range Trading: If the price remains within the range, traders can buy near support ($3,009) and sell near resistance ($3,037-$3,048).
15-Minute Chart (Intraday/Scalping View)
🔑Key Observations:
Recent Breakout Attempt: Price has tested the $3,030-$3,038 resistance zone.
200 EMA & 50 EMA Cross:
The red (50 EMA) is above the blue (200 EMA), signaling bullish sentiment.
Support Zone Identified (~$3,007-$3,022):
Price reacted strongly from this level, indicating strong buyer demand.
Trade Plan for Scalpers:
✅ Long Entrie s: Look for pullbacks near $3,022 with stop-loss below $3,007.
✅ Short Entries : If price rejects $3,038, look for short trades targeting $3,022 or lower.
🌟 Final Conclusion & Trading Plan:
📌 Bullish Scenario:
🔹A break above $3,038 will confirm a bullish breakout.
🔹Potential target = $3,048, then all-time high $3,060+.
🔹Best strategy: Buy the breakout with proper stop-loss below $3,022.
📌 Bearish Scenario:
If price fails to break $3,038, expect a pullback to $3,011 - $3,007.
Possible short opportunities below $3,007 targeting $2,983.
📌 Neutral/Ranging Market:
Until price breaks $3,038 or drops below $3,007, expect sideways movement.
🔹 Recommended Trading Approach:
✅ Breakout traders: Watch for a confirmed break and retest above $3,038.
✅ Range traders: Buy near $3,009-$3,022 and sell near $3,038.
✅ Scalpers: Look for quick trades within the range of $3,007 - $3,037.
📉 Risk Management:
🔸 Keep a stop-loss below $3,007 if buying.
🔸 Keep a stop-loss above $3,038 if shorting.
👉 Always follow TP/SL to protect your capital and maximize profits!
Stay tuned for updates once the confirmations are in place!
Please support me with your likes and comments to motivate me to share more analysis with you and share your opinion about the possible trend of this chart with me !
📢Best Regards , Silver Wolf Traders Community
Disclaimer: This is for educational purposes only.
Always trade responsibly and manage your risk effectively