Candlestickpattern

Indusind BankAfter Down Move stock went in consolidation so one can trade this stock on support and resistance basis

HDFCBANK Update Here, is the chart or projection of HDFC BANK for the future as usual as a part of update on our earlier projection....
I hope this will definitely help you a lot so we just expect your love by boosting our ideas to strengthen and energize to post such a valuable content for you guyz ..
use this as educational purpose...

Broken Out StockAfter Huge rally in the Market and most of the stocks are at all time high and given decent return what next? Sectoral Change is most important aspect to keep in the mind.
Here, is one of the most potential stock with decent upside of 40% around as stock was slide almost 60% from ATH and now we can see the in the chart it has bottomed out and also brokenout and ready to rally as mentioned it in the chart
the view is just educational purposes only.
Investment and Trading is Highly risky in nature so please take independent advice before investing.

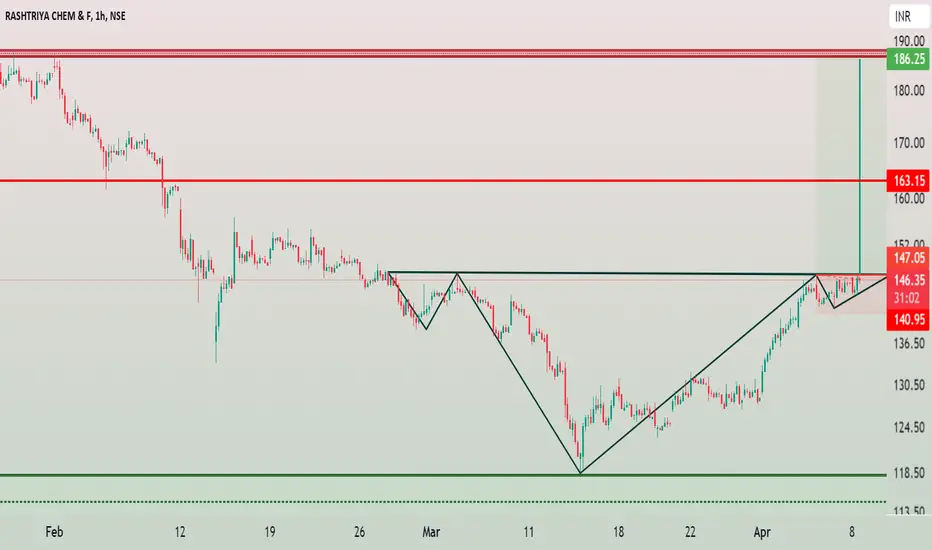
RCF - Head and Shoulder Chart PatternRashtriya Chemicals and Fertilizers Limited (RCF) has formed a bullish chart pattern called Head and Shoulder. Chart structure is bullish in every point of views like in a daily chart pattern you found RSI above 60 and also above 200 EMA is a very positive signal of uptrend.
Head is formed at very important zone which act as a resistance for than a decade almost (14 years). After successfully breakout of important resistance now price retest that level and formed strongest support zone with bullish piercing candlestick in daily timeframe. Change of Polarity, Prior resistance become support.
RCF buy above 148
Stop Loss below 142
Target 163 and 186
The candlestickUnderstand the buying and selling pressure:
You see, every candlestick that is formed tells you a story about the battle between the bulls and the bears-who dominated the battle, who won at the end, who is weakening etc. All that is reflected in any candlestick you see. The length of the body of the candlestick as well as the shadow (or wick) tells you a story about the buying and selling pressure.
Look at the first green candlestick on the left chart, it’s a bullish candlestick right? Yes. But you can see that it has a very short body and very long wick (tail).
It tells you the sellers (bears) were dominant. If this candlestick was to form after hitting a resistance level, it will be considered a bearish signal even though it’s a bullish candlestick.
Now, you can apply the same sort of logic to all the other candlesticks above and read the story each one is telling you.
⦁ If the upper wick is very long, it simple tells you that there’s a lot of selling pressure. It means price opened and got pushed higher by the buyers but then at the highest price, sellers got in and drove it back down.
⦁ If the lower wick is long, it tells you that there’s a lot of buying pressure. Sellers drove the price down but buyers got in and drove the price back up.
⦁ If the lower wick is short, it tells your there’s very minimal buying pressure.
⦁ If the upper wick is short, it tells you that there’s very minimal selling pressure.
What about the length of the body of candlesticks?
⦁ The longer the body of the candle indicates very strong buying or selling pressure.
⦁ A short body of a candlestick indicates little price movement and therefore less buying or selling pressure.
⦁ Sometimes the candles will have no upper or lower shadows but with very long bodies. These are interpreted the same way as standard candlesticks but are an even stronger indication of bullish or negative market sentiment.
⦁ In the case of bullish candle, prices never decline below the open. In the case of bearish candle, price never trade above the open. See below:
⦁ Next WL – 2 …what if you combine more than one candlesticks? What does it show you?

PSP Projects AnalysisHey Guys,
Here is the analysis of PSP Projects. An undervalued firm, it's a small-mid cap stock however, as per the analysis conducted by my team and I, we've picked this stock.
We've got a view from Short term to Long term for this one.
Here are the details-CMP- 632.45
Targets:
Short Term (upto 2 months)- 701
Medium Term (6 Months to 1 year)- 742
Long Term (more than 1 year)- 805
It would be ideal to have a Trailing Stoploss of 557. (Trailing refers to changing your stoploss as targets are achieved).
Let me know what you think about this one.

TCI (Transport Corp. of India)Here's another potential multibagger on our radar today.
This stock has an upside potential (Based on various fundamental and technical factors) till 960.
However, every analyst (Team of Analysts) have a different opinion.
Thus, here we bring to you TCI, aka, the Transport Corporation of India.
Here is the detailed analysis-
CMP- 803.10
Targets:
Short Term (Upto 6 months)- 832
Medium Term (6 Months to 1 Year)- 899
Long Term (More than 1 Year)- 956
Trailing Stoploss- 741
Let me know what you think about this.

Nifty future price action.Nifty future form evening star pattern.
Nifty next up move rally will come, when it close above 22600.
There is major resistance 22490-544.
As per chart, Nifty can short on any rise and stay short till target of 22250 and final target for down side would be 22022.
There is angular trend line support at 22022 with previous GAP.
The level 22022 would act at major support and market may reverse from this level.

Intellect Design There is a one more stock Which is showing a great opportunity in this type of market showing great strength, stock is now at a resistance in Intellect Design. what is your view please comment it down. We are NISM Certified. All views shared on this channel are my personal opinion and is shared for educational purpose and should not be considered advise of any nature.

How to identify a multibagger stock?Ways to identifty a multibagger and a good stock for positional trade:
The stock should fulfill the following criteria
1.It should be from a booming sector and the broader index should be uptrending
2.The relative strength of the stock to Nifty 50 should be in uptrend
3.RSI should be above 40
4.The stock should be in a stage 2 uptrend structure (breakout with good volumes + consolidation --> breakout with good volumes as shown in the structure of sun pharma)
5.The stock should have low volume consolidation.
Many more examples are there from the realty sector and few from the financial sector and I will be uploading them very soon FOLLOW me to get notified when i upload a new idea
Till then,
Happy Trading :)

NZDUSD 4H short position | fvg entry updateThis is the update of my previous post on NZDUSD 4H sell setup , beautiful 1:3.5 RRR trade

NZDUSD 4H short idea | FVG setup Confirmations:-
1] market structure shift
2] order block
3] fvg entry
4] trend continuation
5] engulfing bar candlestick confirmation
Target:- 1:3.5 RRR

Grasim Looing GoodGrasim Was running under pressure in past many years and a year ago it gave a quite good breakout but still it was in the range for a whole year and finally we can see that the with the good quarterly results it gave breakout..
Fundamentally we can see the increasing capex in the budget and which will help to infrastructure development and that is why the Grasim Sales book looking attractive in the long run ...
Educational purpose only....

Railtel LongAfter given upside rally, stock price is taking rest.
Daily Time Frame
As shown in chart, price took support and making a upside reversal pattern.
for study purpose only.

INVERTED HEAD AND SHOULDER BO (CANBK)Stock gives breakout of inverse head and shoulder on weekly timeframe and later price retested its BO level.
CMP : 312
Target 1 : 417
Target 2 : 462
Stoploss : 256
This is not a buy or sell call, this analysis is shared for educational purpose.

BRNL / Bharat Road Network - Pre Covid High / Consolidation B/OBRNL
1) Time Frame - Monthly.
2) The Stock has been consolidating since January, 2020 and has given a pre covid high breakout & Closed with strong bullish momentum & Huge volume in monthly time frame.
3) BRNL may reach its previous Life Time High in the Long Term.
4) Recommendation - Strong Buy

VAIBHAVGBL / VAIBHAV GLOBAL - 5 Months consolidation Breakout.VAIBHAVGBL
1) Time Frame - Monthly.
2) The Stock was in downtrend since 2021 and had a breakout in August, 2023.
3) It has been consolidating since August, 2023 and has given a breakout with bullish momentum & Huge volume.
4) The stock may reach its previous Life Time High (1050) in the long term.
4) Recommendation - Strong Buy

PAKKA / PAKKA LIMITED - All Time high - BreakoutPAKKA
1) Time Frame - Weekly.
2) Stock has given a breakout with huge volume & strong bullish candle close in weekly.
3) The next target would be around the price (460 - 19%) from the current price 385.45.
4) Recommendation - Strong Buy

MANAKSKIA STEELS LTD - Triangle Pattern & Previous ATH BreakoutMANAKSTEEL
1) Time Frame - Weekly.
2) Previous Life Time High was 64. It has been consolidating in a triangle pattern since 2022 & given a breakout in weekly time frame currently.
3) It's a Triangle pattern & All Time High breakout with strong bullish candle & Good volume.
4) Stock will find its next resistance around the price 80 (17%).
5) Recommendation - Strong Buy

HPAL / HP ADHESIVES LTD - 1 Yr Consolidation / IPO base breakoutHPAL
1) Time Frame - Weekly.
2) Previous Life Time High was 109.30. It has been consolidationg since 2022 January & given a breakout in weekly time frame currently.
3) It's a consolidation / IPO base breakout with strong bullish candle & Good volume.
4) Recommendation - Strong Buy

CESC - All Time High BreakoutCESC
1) Time Frame - Monthly.
2) Previous ALL TIME HIGH breakout in monthly with good volume.
3) Stock will find an Immediate resistance around the price 142.80 / Retrace and breakout further in the upcoming days.
4) Recommendation - Quite risky but still it is a Good buy.

Capri Global-A breakout you shouldn't miss!Stock has been consolidating in a range from many days.Volume breakout has happened today.
Stock should sustain above 850 for couple of days for confirmation.
Levels mentioned on chart. Highly risky trade.
