Learn from the Charts: Educational Stock Watchlist (Aug 29, 2025Here’s today’s carefully selected Watchlist of Stocks. Each stock has been shortlisted based on its chart structure, indicators, and candlestick behavior. These are not trade tips — the goal is to help you learn how to analyze live setups.
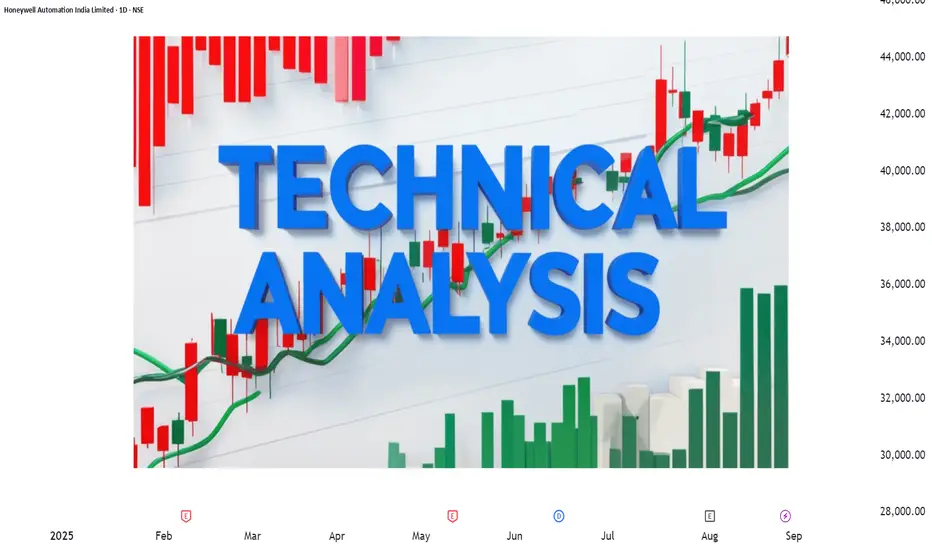
🔹 HONAUT (Honeywell Automation)
💼 Industrial Automation Leader
About: A leader in industrial automation and engineering solutions, known for stable long-term growth.
Technicals: The stock shows strong bullish momentum with high volume participation. RSI and Stochastic confirm strength, while candlesticks are forming higher highs and higher lows.
👉 Why Track This? Excellent case study to see how large-cap, fundamentally strong companies sustain momentum rallies. It will help you understand the role of volume confirmation in bullish breakouts.
🔹 ASTRAZEN (AstraZeneca Pharma)
💼 Global Pharma Giant
About: A global pharma major focused on medicines for oncology and chronic diseases.
Technicals: The stock is showing short-term bearish pressure with MACD and CCI negative, though volumes remain high. Candles are showing signs of volatility and possible reversal attempts.
👉 Why Track This? Great learning to watch how heavy volumes can precede potential reversals even in weak phases. Pharma stocks often give sharp swings — observing this helps in spotting bottoming-out patterns.
🔹 WAAREE ENER (Waaree Energies)
💼 Renewable Energy – Solar Solutions
About: A key player in renewable energy, specializing in solar PV modules and solutions.
Technicals: The stock is in strong bullish momentum. RSI is in overbought territory, CCI also signals strength, and candlesticks point toward continuation of trend.
👉 Why Track This? Perfect example of how high-momentum renewable stocks can keep trending despite overbought indicators. A good study for understanding extended rallies in growth sectors.
🔹 JUBILANT CPH (Jubilant Pharmova)
💼 Diversified Pharma
About: Diversified pharma and life sciences company.
Technicals: High momentum stock but currently undergoing a bearish phase. Charts show lower highs forming, and candlesticks suggest pullbacks.
👉 Why Track This? Useful for studying retracements within otherwise strong momentum stocks. This teaches how to differentiate between temporary corrections and deeper reversals.
🔹 CAPLIPOINT (Caplin Point Laboratories)
💼 Fast-Growing Export Pharma
About: A fast-growing pharma company with strong presence in exports.
Technicals: Stock is trending bullish with low risk. Indicators are supportive, and candlesticks are showing higher lows, confirming accumulation.
👉 Why Track This? A good case study for observing how a stock consolidates before making higher moves. Helps you understand the concept of “low-risk bullish entries” on charts.
🔹 MALLCOM
💼 Safety Gear Manufacturer
About: Manufacturer of industrial safety gear and protective equipment.
Technicals: Despite strong past moves, momentum has turned bearish. Charts show indecision with candles testing support levels.
👉 Why Track This? Great example to learn how indecisive candlestick patterns (dojis, small-bodied candles) can signal either breakdowns or reversals. Watching closely here will help you understand market psychology.
🔹 TTKHLTCARE (TTK Healthcare)
💼 Healthcare & Consumer Products
About: A diversified healthcare and consumer products company.
Technicals: Bullish momentum with low risk. RSI and MACD are supportive, and candles show steady accumulation.
👉 Why Track This? A classic case to learn how accumulation patterns look before bigger price movements. Tracking this will build your ability to spot early entry setups.
📊 Each of these stocks showcases different market phases — strong rallies, corrections, consolidations, and reversal attempts. Observing them today will sharpen your technical analysis skills.
Happy Learning & Observing,
STWP
⚠️ Disclaimer – Please Read Carefully
The information shared here is meant purely for learning and awareness. It is not a buy or sell recommendation and should not be taken as investment advice. I am not a SEBI-registered investment advisor, and all views expressed are based on personal study, chart patterns, and publicly available market data.
Trading — whether in stocks or options — carries risk. Markets can move unexpectedly, and losses can sometimes exceed the money you have invested. Past performance or past setups do not guarantee future results.
If you are a beginner, treat this as a guide to understand how the market works — practice on paper trades before risking real money. If you are experienced, always assess your own risk, position sizing, and strategy suitability before entering trades.
Consult a SEBI-registered financial advisor before making any real trading decision. By engaging with this content, you acknowledge full responsibility for your trades and investments.
💬 Found this useful?
🔼 Give this post a Boost to help more traders discover clean, structured learning.
✍️ Drop your thoughts, questions, or setups in the comments — let’s grow together!
🔁 Share with fellow traders and beginners to spread awareness.
👉 “If you liked this breakdown, follow for more clean, structured setups with discipline at the core.”
🚀 Stay Calm. Stay Clean. Trade With Patience.
Trade Smart | Learn Zones | Be Self-Reliant 📊
CAPLIPOINT
CAPLIPOINT - 75% RETURNS!!!BUY - CAPLIPOINT
CMP - Rs. 677
Target - 1: Rs. 822
Target - 2: Rs. 940
Target - 3: Rs. 1200
.
.
Technicals - Bullish Flag BO
.
This is just a view, please invest at your own risk.
.
Follow me for more!

CAPLIPOINTNSE:CAPLIPOINT
Note :
1.One Can Go long with a Strict SL below the Trendline or Swing Low of Daily Candle.
2. Close, should be good and Clean.
3. R:R ratio should be 1 :2 minimum
4. Plan as per your RISK appetite
Disclaimer : You are responsible for your Profits and loss, Shared for Educational purpose!

CAPLIPOINTNSE:CAPLIPOINT
One Can Go long with a Strict SL below the Trendline or Swing Low of Daily Candle.
Close should be good, and Clean.
R:R ratio should be 1 :2 .
Disclaimer : You are responsible for your Profits and loss, Shared for Educational purpose

Caplinpoint strong breakout#caplin
#caplinpoint
Caplin point is a strong breakout today.
Have added partial qty at 825.
Wil add more if Todays close>807
Kindly DYOR
#vr


Caplin point, nice breakoutCAPLIPOINT Has given nice breakout on weekly charts.
Also it has broken daily small resistance (Blue line) and closed above that this week.
Recent quarter results have been good.
Can be added till breakout levels.

#CAPLIPOINT,1MNSE: CAPLIPOINT, 1M CHART(Long Term)
If breakout in upside then can take advantage and long position
Buying Level 700+
Stoploss 577
Target 1200+ levels


CAPLIPOINT - CMP: 507Caplin Point Laboratories - Has given channel breakout on the daily chart with a good delivery volume. we Expect price movement till 575. Any drop in price near 475/485 will be a good opportunity to enter.

Good patterncaplipoint was in consolidation phase for almost 7-8 months . It has come out of the traingle pattern .
We can expect a big move . If there is big positive candle with good volumn it can give long rally.

Caplin - Perfect Falling Wedge Breakout #Caplipoint It is a perfect falling wedge Breakout for target 680 as shown on chart. Cmp 507 sl 475


CAPLIPOINT - CUP & HANDLE - 17 SEP,2020CUP & HANDLE Formation on 1 Hr chart. Price is above Moving average of 144 days.
Disclaimer : The opinions and analysis expressed herein are for informational and educational purposes only and should not be considered as individual investment advise or recommendations. I am not your financial advisor. Risk it for Biscuit.

CAPLIPOINT POTENTIAL MULTIBAGGER?? Multi Time Frame Analysis Elliot Wave - Potential 3rd wave in Monthly Chart
Weekly Chart -
Daily Chart -

CAPLIPOINT (Caplin Point Laboratories Ltd) BUY ABOVE 425CAPLIPOINT (Caplin Point Laboratories Ltd) BUY ABOVE 425
