AlbertDavid - At supportsCMP 752.70 on 05.01.26
All important levels are marked on the chart. The stock price is on the 5-year-old support levels. If it bounces from these levels, it may go into a bullish phase. Possible targets may be 900/1000/1100, and even more, depending on forthcoming parameters.
The setup fails if the price sustains below the 720-710 levels.
The risk-reward ratio is quite good at the moment.
One must determine the position size according to the risk capacity. Always keep your stop-loss confirmed.
All these illustrations are only for educational and learning purposes, it should not be considered as a buy or sell recommendation. Please do your research before any trade or consult your financial advisor.
All the best.
CASH

Zyduslife - Near Breakout LevelsCMP 1013.85 on 07.09.25
All important levels are mentioned on the chart.
For a year, the level of 1030 has been acting as a resistance zone.
The price has formed a Cup & handle pattern. Presently nearing the level of breakout.
If it sustains above 1030, it will gain strength.
If it sustains below 980-970, the setup will weaken, and the exit plan should be exercised.
Possible targets are 1120/1170+.
All these illustrations are only for educational and sharing purposes. It should not be considered as a buy or sell recommendation.
All the best.

Bajaj Finance - Seems to be on SupportCMP 853 on 12.08.25
In the last 15-20 days, the stock price has come down to 853 from 970. Present level may act as support again, as can be seen on the chart.
If it bounces back, it will form a Double bottom pattern.
Stochastic RSI is showing a reversal sign too.
Targets may be 885/915+.
If it sustains below 840-835 levels, the setup will go weak.
The risk-reward ratio is good at this point.
This illustration is for educational and sharing purposes; this should not be taken as a buying or selling recommendation.
All the best.

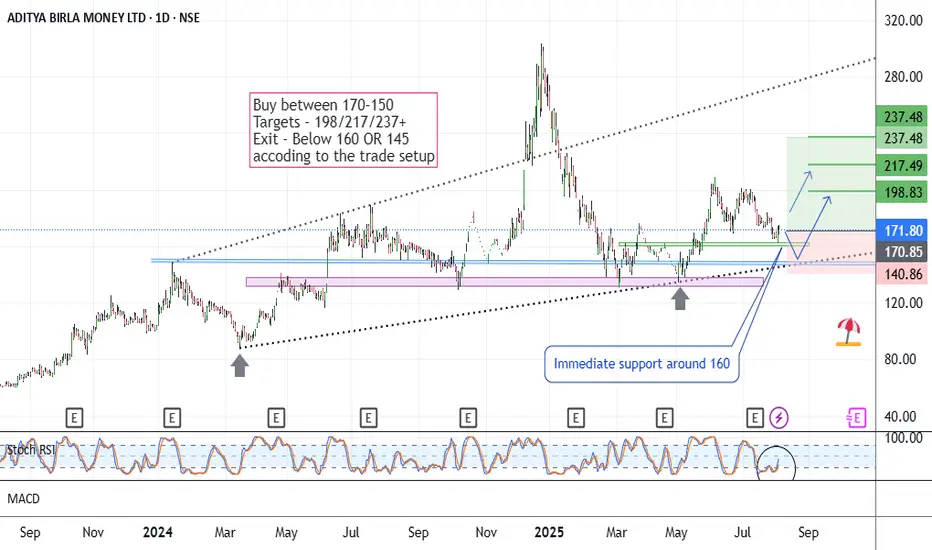
AB Money - Positional LongCMP 171.80 on 04.08.25
The chart is self-explanatory. Resistances and supports are mentioned according to the setup. Immediate support seems to be around 160, whereas the lower support area is around 148.
Stochastic RSI is trying to rise at present.
If it goes upward, targets may be 217, 237, or more.
Entry-level and position size should be considered according to the exit price (if going at a loss).
If it sustains below 145, this setup will go weak.
This illustration is purely my own view, for learning and sharing purposes only. This is not buying or selling advice, as I am not a registered analyst.
All the best.
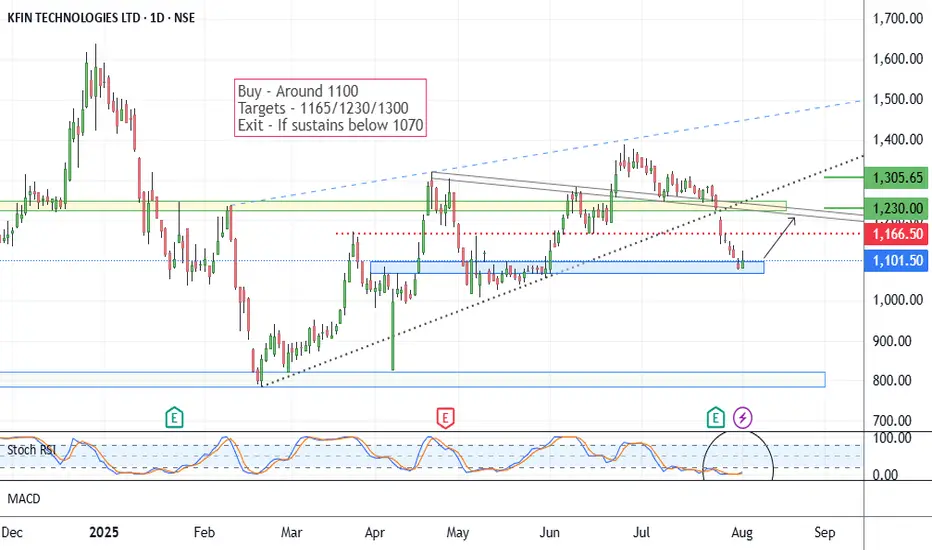
Kfintech - Positional Long SetupIn the last month of July, the stock price fell from 1380 to 1100. Presently seems on a support area. As you may see on the chart. This setup is based on a reversal possibility from the support range around 1080.
Stochastic RSI shows a reversal sign.
Possible targets may be 1165/1230 and 1305.
If it sustains below 1070-1050 levels, the setup will go weak. Below 1070, the exit plan should be considered.
One has to keep the position size according to the risk management.
All these illustrations are my personal view, only for learning and observation purposes; this is not buying or selling advice.
All the best.
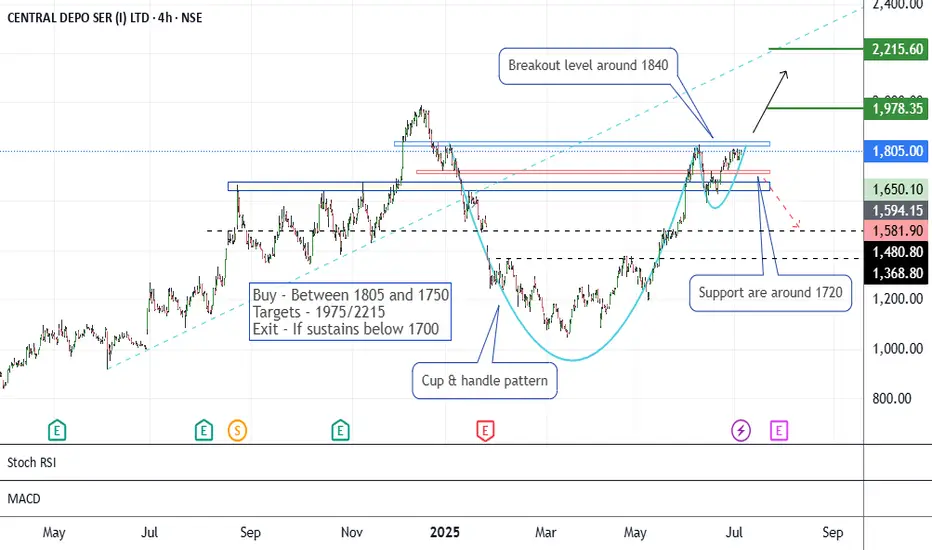
CDSL - An AnalysisThe stock price has formed a Cup & Handle-like pattern since January 2025. This moment is reaching near the breakout levels of 1820-1840.
If it sustains above 1840, it may go bullish to see the levels of 1975/2215.
Support levels are around 1710.
One has to maintain risk management according to the exit levels below 1700.
Second view -
If it does not sustain above the levels of 1840-1860, and slips down below 1700, the setup will show weakness and a bearish view. Then it may go lower to the levels of 1480 and 1365.
All these illustrations are for learning and knowledge-sharing purposes. It should not be considered as a buying or selling recommendation.
All the best.
Titan - Keep On WatchCMP 3652 on 26.06.25
The chart itself is self-explanatory. The price has formed a Cup & Handle-like pattern since February 2025. This time, it is reaching the breakout levels.
MACD shows a likely reversal, too.
If it breaks out, it may go bullish to reach the levels of 3850, 4050, and potentially higher, depending on the market conditions.
In case of any correction, support levels are around 3510.
One may plan entry on different levels while considering risk management and position size.
All these illustrations are only for learning and sharing purposes; it is not buy or sell advice. Please do your research before taking any trade.
All the best.

AHL -Bottom FishingThe stock price has dropped around 60-70% in the last 6 months. From an all-time high to an all-time low in just 6 months.
This time, it is consolidating at the lowest prices for a month.
If it gives a bounceback, it could be a good trade setup with a good risk-reward ratio.
The projected targets are 260/350 or more.
The setup remains active above the price of 180. It loses significance if sustained below 160.
All these illustrations are only for learning and sharing purposes. not a buy or sell recommendation.
All the best.

Maha Apex - Very Low-Risk setupThe stock price has come to its half in the last 6 months.
This time comes to a crucial low level at multiple support, as seen on the chart.
If it reverses from these levels, it can be a good trade setup with a small risk and big rewards.
The projected targets may be 130/160 or even more.
One has to keep the position size in accordance with the risk management.
All these illustrations are only for learning and sharing purposes, not a buy or sell recommendation.
All the best for your trading journey.

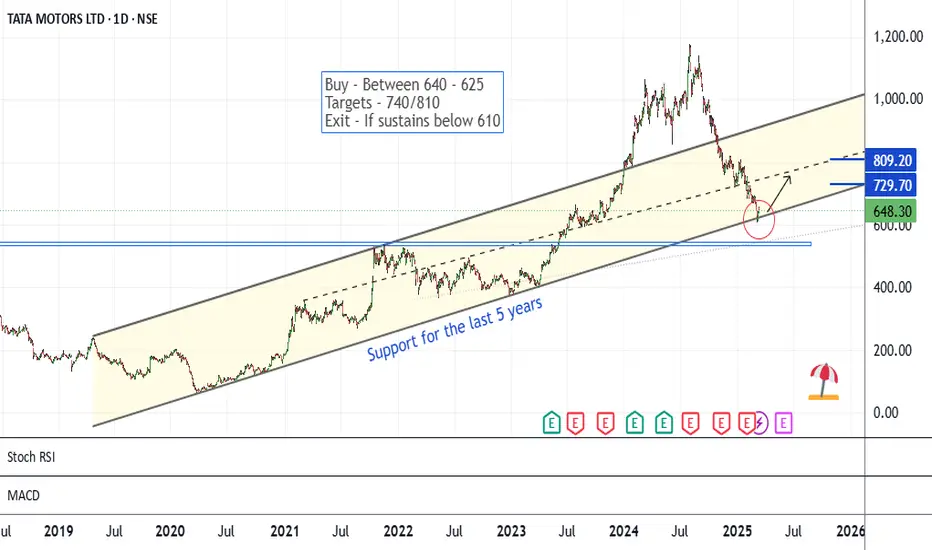
Tata Motors - Simple Long SetupThe chart is self-explanatory. The price has been travelling in a higher high-higher low pattern for the last 5 years. This time comes to the lower levels.
In the recent 5-6 sessions, it has shown a bounce back.
If momentum continues, a bullish move may be seen ahead.
The risk-reward ratio is quite good for positional trading at these levels.
If it sustains below 610 levels on a closing basis for 2-3 days, the setup will lose significance.
All these illustrations are only for learning and sharing purposes; it is not a buy or sell recommendation.
All the best.
Aarti Ind - Low Risk OpportunityIn the last 6 months, the stock price has come down around 40%. This time has been consolidating in a small range in recent days.
MACD is showing a possible reversal on a weekly basis.
If it gives a reversal, it may go into a bullish phase again.
Possible targets are 485/570/620++.
If it sustains below 370, the setup goes weak.
One has to keep the position size in accordance with risk management.
This illustration is my own view. It is only for learning and sharing purposes. It is not a buying recommendation.
All the best.

Sarla Poly - Low Risk SetupCMP 98.42 on 17.01.25
Since March 2024, the stock has been moving in a parallel channel-like pattern. This time touched the lower edge of the channel and showed a bounceback too. If the momentum continues, it may go to 105/120 or even more depending on the conditions.
MACD is showing a likely reversal too.
If it sustains below 88, the setup will go weak.
This illustration is only for learning and sharing purposes, not buying or selling advice. Please do your research before making any trades.
All the best.

Navin Fluorine - Positional SetupThe chart shows the possible supports and resistances. At present, the price is about to cross a predefined resistance area around 3450-3500. If crosses the zone and picks some momentum, we may see upper targets according to the setup.
Also, the gap area upside is to be filled in due time, of course in a bullish phase.
If sustains above 3500, may go to 4000/4200 or even more.
If sustains below 3200, this setup will go weak.
Decide your entry and exit levels and position size in accordance with your risk management.
All this illustration is only my view, just for learning and sharing purposes, not trading advice in any form.
All the best.

Maha Apex - Bottom Fishing The chart shows that the stock price has been moving in a parallel channel since August 23. This moment, again comes to the lower edge of the channel. If the pattern continues and gives a bounceback, it could be a good opportunity with a good risk-reward ratio.
The stock has been consolidating in a narrow range in recent sessions.
MACD shows a likely reversal too.
All important levels are mentioned on the chart.
One should keep the position size according to risk management.
This illustration is only for learning and sharing purposes, not trading advice in any way.
All the best.

Himatsingka Weekly - Keep On watchThe stock price has formed a Cup & Handle-like pattern in recent years. In recent sessions, gave a breakout and on the retest levels now.
If it bounces back from these levels, may go into a bullish phase again which may carry the price to 255/305/ 450.
This setup is valid unless the price sustains above the purple trendline as shown on the charts.
In this kind of trade, one has to keep the position size and stop loss according to risk management.
This is only for learning and sharing purposes, not a piece of trading advice.
I wish you a very HAPPY NEW YEAR 2025 & All the best for your trading journey.

Angelone - Keep On WatchThe chart is self-explanatory. After retracing 100%, from 3900 to 2000 in July 2024 it has resumed upside movement in the last 6 months.
At present consolidating at the important resistance around 2800.
If it reverses from these levels, it may go into a bullish phase again.
Further targets are mentioned on the charts.
If sustains below the 2680 level, the setup will go weak. Do not hesitate to exit any trade when hits the risk capacity.
one should keep the position size and entry levels following risk management.
All this illustration is only for learning and sharing purposes, not trading advice in any form .
All the best for your trading journeys.

Abans Holdings - Low Risk IdeaThe stock price has dropped more than 50% in the last 3 months. And 25% in the last 10 days.
This time, it is close to the long-time support levels of 250-260.
If it shows the reversal this time, it will be a good risk-reward trade. It may reach the levels of 310/340 or even more.
The setup remains active above the level of 255-260. If sustains below 248, the setup will go weak.
One should keep the position size following risk management.
This illustration is only for learning and sharing purposes, not a piece of trading advice in any form.
All the best.

LT - Long SetupCMP 3947 on 09.12.24
Since January 2022, the stock has been traveling in a rising wedge pattern. For the last many days, the price has been moving in a range (shown as a rectangular shape). This time looks like breaking the upper levels.
Immediate supports seem to be around 3860 and 3740.
One may start buying from the current price to as low as 3860, multiple times.
Always keep the position size in accordance with risk management.
The setup fails if the price sustains below 3730.
All this illustration is my own view, shared only for learning and observation purposes. It is not a piece of trading advice in any form.
All the best.

Asian Paints - Seeing the OpportunityThe stock price has dropped more than 30% in the last 3 months—this moment resting on a multiple support area, as seen on the charts.
If it bounces back from the support levels, may go into a bullish phase again. That could push the price up to the levels of 2520/2690 and 2950+.
One should wait for the reversal signs and then make an entry. Also, mind the position size.
Do not hesitate to exit the trade when hitting the stop loss.
All this illustration is only for learning and sharing purposes, not a trading recommendation in any form.
All the best.

Birlasoft - Positional setupCMP 599 on 12.10.24
A Pole and Flag pattern-like formation is in progress on the chart. But a trade setup should be backed by other parameters too.
The range of 550-580 has been acting as a good support zone for a long time. This time, it reversed from the zone again—a good time for a buy setup with a favorable risk-reward ratio.
Immediate targets seem 670, 710, and 740.
The setup fails if the price sustains below 550-540 levels.
Position size should be following risk management.
This is only for learning and sharing purposes, not trading advice in any form.
All the best.

Tata Motors - Positional SetupCMP 780 on 22.11.24
The chart is self-explanatory. It shows the consolidation in recent sessions at support levels. If it gives an upward move, it may go to 880.
A reversal in MACD is awaited now.
One has to keep the position size according to the risk management.
This illustration is my own view, shared only for learning purposes. It is not a piece of trading advice in any form.
All the best.

ABB - Keep An EyeAll points are mentioned on the charts.
In the last session, the stock has shown a bounce back from the multiple support levels as indicated on the above chart.
If momentum continues, may go to 8150/8650.
Above 8800, a breakout of flag pattern will be there.
The setup remains active until the price sustains above 7200.
This illustration is only my view, only for learning and sharing purposes, not a trading advice in any form.
All the best.

Moil - Low Risk Setup
CMP 334.60 on 02.11.24
The price has been corrected by around 40% from the higher levels.
All important levels are marked on the charts. If crosses the area of 340-370 and sustains above, may go into a bullish phase again. targets may be 380/480 and even more.
If sustains below 310 and sustains below, the setup goes weak.
At present point, the risk-reward ratio is quite good.
This is my view only for learning and sharing purposes, not trading advice in any form.
All the best for your trading journeys.
