diwali call buy CDSL on CMP forming symmetrical triangle pattern wait for breakout buy above 1400 and also CDSL shown very good result on 30th october 1st target 1600 last one 2000
CDSL

Simple Positional Long/Buy trade setup | CDSL | Short-Mid TermNSE:CDSL
Observations:
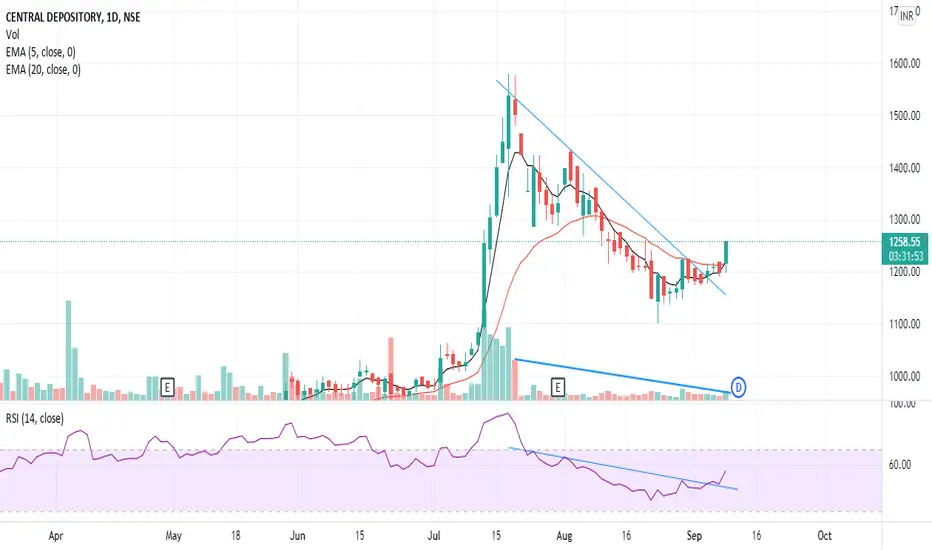
1) On daily time frame, we can see 50DMA is working as support.
In last session, It took support from it closed with bullish candle.
So Major support range is 1290-1300 level.
Please refer below chart : 1day Time Frame.
2) Also on daily time frame, we can see that it is taking support from major support trendline.
And also it has formed symmetrical triangle pattern.
If it breakout upward then it will be bullish.
If it gives breakdown of support trendline then it will be bearish.
Please refer below chart : 1day Time Frame.
-------------------------------------
In this stock it is better to take positional trade. Below is the levels and setup for only long positional trade setup.
Please refer below chart for levels.
Hope I made it easy to understand it.
Do comment your doubt or suggestion.
Note: Trade with Strict SL.

CDSL - Seems ready for the next burst up?Category: Triangle Breakout
Key Highlights:
1. Bullish market structure on HTF.
2. Bullish flag and pole/triangle pattern consolidation happening.
3. Bullish volume is higher and weak non-patient hands are getting out.
4. Direct beneficiary of the increased equity share.
Disclaimer: This is NOT investment advice. This chart is meant for learning purposes only. Invest your capital at your own risk.
Abhishek Singh (@Abhishek_TradersSin)
~ Middle-class IT Employee trying to simplify Technical Analysis.
~ Do follow and like if you like the work.


CDSL to take long entryLong CDSL between 1380-1390. All levels given on charts. let;s wait for the right entry. Stock forming higher highs & lower lows & very high probability to BO from the zone very soon. This is for your educational purpose only.

CDSL Symmetric Trangle PatternCDSL is formed symmetric trangle pattern. We can keep eye on this stock for breakout.
Very Soon breakout expected.

CDSL symmetric triangle breakoutBreakout retest done
Good Zone to Accumulate :- 1340-1360
Short term target :- 1550-1600
Long term target:- 2000
Short term stop:-1250
Long term stop :- 1100
Disclaimer :- Chart is only for educational purpose.

BUY at current levelseems like downtrend is over
macd is also given buy signal
moving averages are also supporting

BUY CDSL FOR 1530BUY CDSL FOR THE TARGET OF 1530.
KEEP SL AT 1275
Very strong stock to hold for long term as well.

CDSL- TRYING TO GIVE TRIANGULAR BO.CDSL - Good stock to consider for long term investment.
One can do SIP also in this stock.
For the targets "SKY IS THE LIMIT.

CDSL Next TargetCDSL Next Target, Long above 1600 DCB It will clearly give a 400 to 500 Points Up Move as per its uptrend from 500 to 900, 1050 to 1400 next 1600 to 2100

CDSL-BE ready for another breakout !!!!As we can see in daily chart after a superb rally upto 1577, price has stuck in triangle. recently company has offered handsome dividend of rs 9.
now price is still getting strength and trading near lower level, above 1320 level will take price to the 1400 level soon, and above that level price will be unstoppable, and we can assume tgt of 1550 in coming months.

CDSL BreakoutCDSL breaking out of TL of this symmetrical triangle pattern. Swing traders can plan their positions.
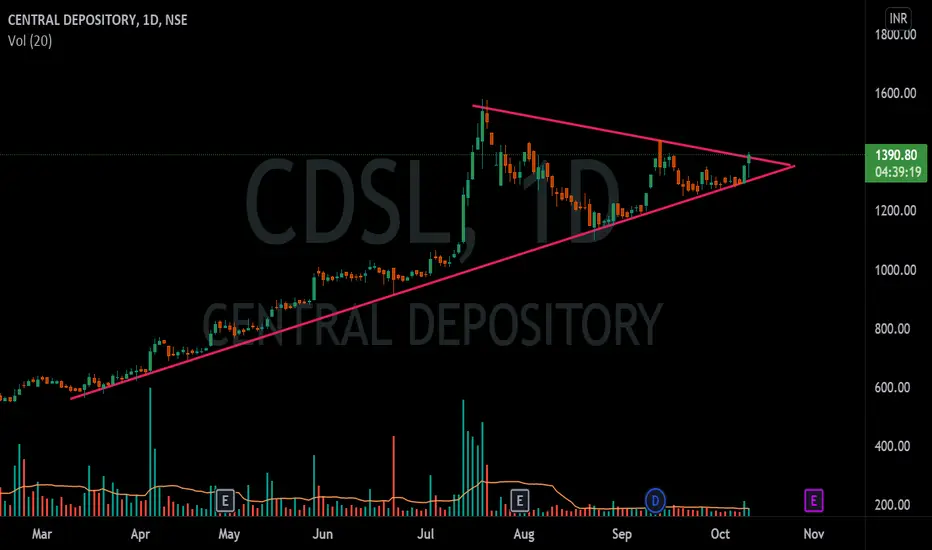
Symmetrical Triangle about to break.CDSL has shown some good uptrend in the past six months, now it is in a consolidation phase after a good price correction. We can see while correcting the volume is very low which is a good sign and shows that sellers are weak. Latest candle formed is a strong bullish candle with an above average volume gives a hint of buying interest. A unique thing is that for the past half a month the deliveries are 100%.
Other indicator's signals:-
Momentum = RSI above 60 on all time frames (monthly,weekly,daily).
Trend = Price is respecting the trend line since retest.
Relative Strength Comparison = Outperforming nifty50 as well as midcap index.
ENTRY= above 1380
SL= below 1290
Target= 1580

CDSL is about to breakout in Ascending triangle pattern.CDSL is about to breakout in Ascending triangle pattern.

Central Depository Services LtdTriangle breakout pattern with high volume in Central Depository Services Ltd

CDSLNote:
1. Views are personal and for educational purposes only. Recheck and take the trade as per your RR.
2. Always remember SL is your lifeline, not the big target...
3.Follow us for more patterns and like, share so that we feel it is helpful to many and share more patterns...
3. Views given here is not a tip rather it is for educational purpose... Aftermarket opens, the condition might change so learn to handle different conditions...
4. To learn more about patterns, Psychology behind the trade, and price action trading... contact us... Thanks...
Keep an eye ladies and gentlemen. Cheers and Happy Trading

CDSL_Buy #CDSLBuy #CDSL immediately once the market opens tomorrow..Keep the SL of 1266 for the Target of 1580 and then ATH (min ~30% upside from the current level)

Converging TriangleA close look at the chart of CDLS and BSE reveals that both price charts are making the similar patterns OF CONVERGING TRIANGLES. There was also a similar price and volume breakout in the prices of BSE and CDSL charts a few months back. Both the charts are converging, so a breakout in the near future is expected.
The companies such as CDSL and MCX perform similar functions. They serve as depositories. While CDSL is primarily for equities, MXC serves this purpose for commodities. When equities rise, gold will lose value as a good hedge, subsequently trading in commodities will reduce, thus bringing down the turnover in MCX and bringing down its price. In effect, the price charts must show an inverse relation in the charts of MCX AND CDSL. Its surprising to see both the prices rise and hit new highs
Another interpretation is that since the financial and capital markets is garnering never before seen attention, its possible that the increase in both the companies may imply the rising belief and participation of the common man in the markets of both equities and commodities.


Cdsl is again ready to fly CDSL is looking good to go long after forming a small red candle a bullish hammer green candle is formed and close at day high which is a good single to go long again for 100 to 200 points.
Disclaimer:- This is only for educational purposes do your own analysis before investing hard-earned money.
