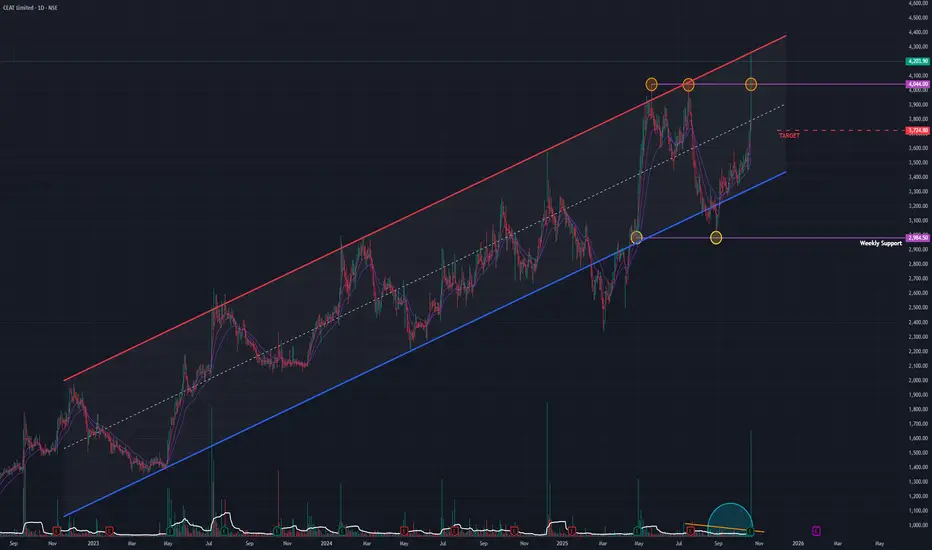
CEAT (D) - Critical Crossroads: Breakout vs. Channel ReversalAfter a multi-year uptrend, CEAT Ltd has arrived at a major inflection point. While it has broken a key horizontal resistance and hit a new all-time high, it has also run into the upper boundary of a long-term channel, a point that has historically marked a reversal. This creates a classic standoff between two powerful technical signals.
The Bullish Case: The Breakout
The primary argument for the bulls is the recent show of strength and the clearing of a significant hurdle:
- New All-Time High (ATH): The stock has successfully pushed into new territory, which is an inherently bullish sign.
- Horizontal Breakout: It has decisively broken out and closed above the horizontal resistance line formed by both the previous ATH and the upper limit of its recent consolidation phase.
- Consolidation & Dry Volume: Prior to this move, the stock was in a healthy consolidation phase since April 2025, during which volume was drying up . This is a classic sign that selling pressure was diminishing, often setting the stage for an upward move.
The Bearish Case: The Channel Resistance
Despite the breakout, the stock is still operating within the rules of a much larger, long-term pattern:
- The Parallel Channel: Since April 2020, the stock has been trading within a well-defined ascending parallel channel . It has consistently respected the upper trendline as a point of strong resistance and the lower trendline as support.
- Rejection at the Top: Today, by hitting its new ATH, the stock has also simultaneously hit the upper resistance trendline of this channel . Historically, every time the price has reached this boundary, it has reversed and trended back down towards the channel's support.
Conclusion and Key Scenarios to Watch
The price action in the next few trading sessions is critical and will likely resolve this technical conflict.
- Bullish Breakout Scenario: For the uptrend to accelerate, the stock must do something it has never done: achieve a decisive, high-volume close above the upper trendline of the parallel channel . If this occurs, it would invalidate the channel pattern and could signal a powerful new leg up, with a potential target of ₹5,100 .
- Bearish Reversal Scenario: If history repeats itself and the channel resistance holds, the stock will likely be rejected from this level. A failure to stay above the recent horizontal breakout would be the first sign of weakness, potentially leading to a reversal back down to the channel's median, around the ₹3,725 level.
In short, the market is at a "prove it" moment. The bulls have broken a minor resistance, but the bears are defending a major long-term boundary. The winner of this battle will likely dictate the trend for the coming months.
CEATLTD
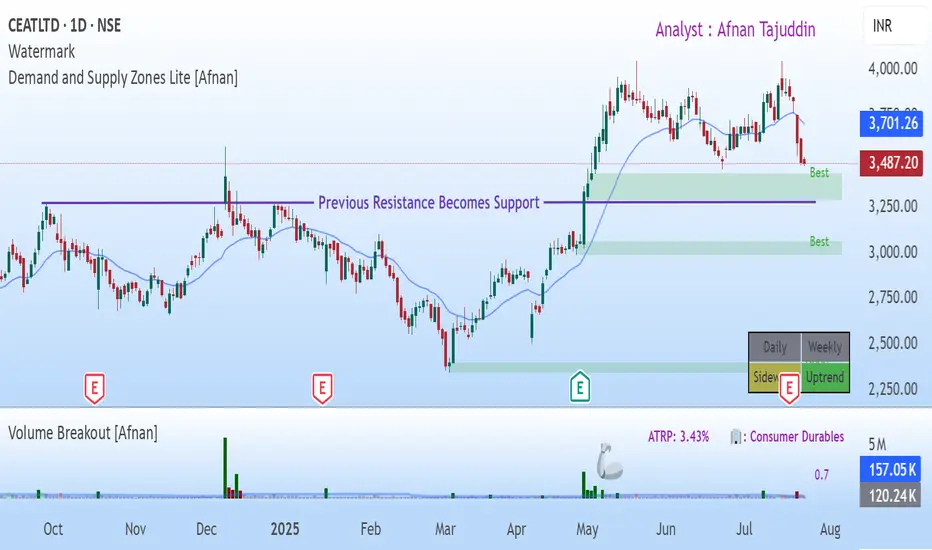
CEAT Ltd: Is a Rebound on the Horizon? A Confluence of TechnicalTraders — let’s dig into CEAT Ltd NSE:CEATLTD . where both demand-supply dynamics and classic technical signals are flashing something worth watching. What’s setting up here isn’t just noise — there’s real structure underneath the surface.
Demand Zone & Institutional Footprints
Let’s start with the core of this setup: the Demand Zone. CEAT’s price is inching toward a daily timeframe Rally-Base-Rally zone — and not just any zone, but one that stands out in terms of quality.
Why does this matter? Because these aren’t retail-driven bounces. These are often the hidden footprints of institutions quietly building positions.
On June 23rd, price came close to this very demand zone — and without even touching it, we saw a sharp bounce. That’s a strong tell. There’s clear demand waiting just below.
Institutions don’t throw their entire order book at the market in one go. They scale in. So when price comes back to this area, it’s likely to trigger those leftover buy orders — potentially leading to another move higher.
Zooming out to the broader view : Both weekly and monthly charts are still in an uptrend. There are no obvious supply zones on the higher timeframes That clears the runway for bullish continuation.
💡 Traditional Technical Analysis Perspective 💡
Now let’s switch gears for a moment and take a look through the lens of classic technical analysis. What’s the chart telling us in plain sight?
CEAT spent months coiling within a consolidation range — nothing impulsive, just sideways chop.
But that changed on April 30th with a decisive breakout. And this wasn’t on light volume — it came with strong participation, a real sign of conviction.
Post-breakout, we’ve seen consistent volume buildup alongside price progression. This isn’t a one-day wonder — it’s been developing.
Act of Polarity at Work: The breakout level had previously acted as firm resistance multiple times. Now that price is retesting it from above, it’s doing exactly what we expect — flipping that resistance into potential support.
Interestingly, this retracement is happening on declining volume. That’s key. It often suggests a healthy retest rather than a breakdown — a potential “buy the dip” scenario, if you will.
🤝 The Confluence: Where Two Worlds Meet 🤝
Here’s where things get really compelling — that demand zone we highlighted? It aligns perfectly with the same level that’s being retested post-breakout. That overlap — this confluence — is no coincidence.
It dramatically increases the odds of a strong bounce, because we’re getting validation from two independent analytical frameworks. When price, psychology, and institutional footprints all point to the same zone — you pay attention.
We could consider a tactical Stop Loss just below the demand zone. And in terms of upside? The previous swing high near ₹4000 stands out as a logical first target.
"Success in trading is a marathon, not a sprint. Consistency, discipline, and effective risk management are your true North Stars."
Stay sharp. Even the cleanest setup can fail — and that’s why managing risk isn’t optional. If price violates the zone and closes below your SL, step out without hesitation.
Thanks for reading — your support, feedback, and questions always help drive this community forward. Let’s keep sharpening our edge together.
🚀 Trade smart, stay disciplined, and let your journey be one of continuous learning! 🚀
Disclaimer: This analysis is intended purely for educational purposes. It does not constitute investment advice or a trading recommendation. I am not a SEBI-registered advisor.
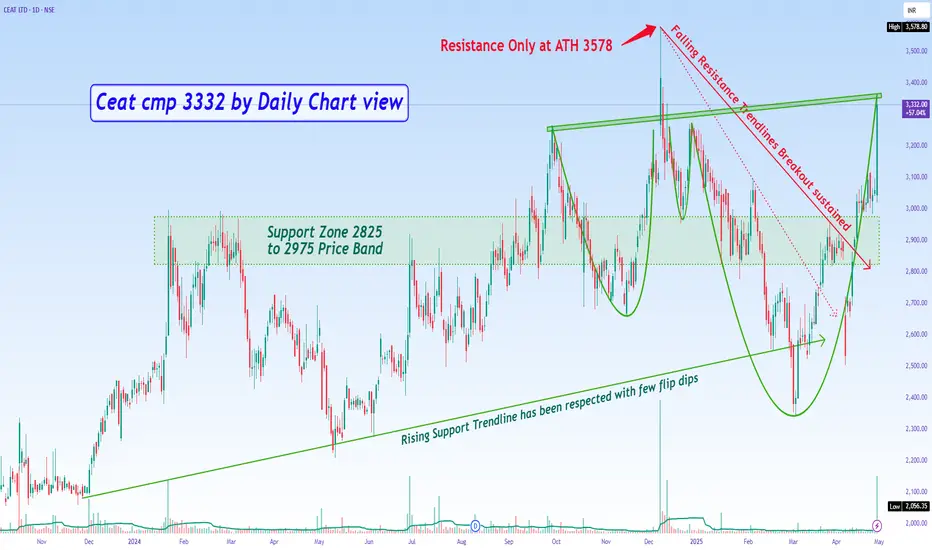
Ceat cmp 3332 by Daily Chart viewCeat cmp 3332 by Daily Chart view
- Resistance Only at ATH 3578
- Support Zone 2825 to 2975 Price Band
- Falling Resistance Trendlines Breakout sustained
- Back to Back Bullish Rounding Bottoms completed
- Rising Support Trendline has been respected with few flip dips
- Heavy Volumes surge on 30-April and in sync with Avg Traded Quantity
CEAT LTD Hits 52-Week Breakout CEAT LTD just hit a 52-week high and looks set for more gains! 📈 Strong technical signs suggest the stock could keep rising, so it’s worth keeping an eye on for potential opportunities! 🚗💨
⭕️Price Action Analysis Alert !!!⭕️
💡Equity Stocks Trading📉📈📊
✍️Technical Reasons to trade or Strategy applied :-
✅ Bullish Trendline Breakout
✅ Trapped Buyers Strategy
✅ Supportive Moving Average
✅Strong Chart Pattern (Rounding Bottom & Inverted H&S)
✅Parallel Channel Breakout
✅All-Time-High Breakout
✅Strong Volume seen
💡Check out my TradingView profile to see how we analyze charts and execute trades.
🙋♀️🙋♂️If you have any questions about this stock, feel free to reach out to me.
📍📌Thank you for exploring our idea! We hope you found it valuable.
🙏 FOLLOW for more content!
👍 LIKE if you found it useful!
✍️ COMMENT below with your thoughts and feedback!

CEAT LTD - Swing Trade Analsyis - 29th June #stocksCEAT LTD. (1W TF) - Swing Trade Analysis given on 29th June, 2024
Pattern: FALLING WEDGE BREAKOUT
- Weekly Resistance Trendling Breakout - Done ✓
- Weekly Support Zone Retest & Consolidation - Done ✓
- Strong Pullback candle with volumes after consolidation - Done ✓
- Demand Zone retest for a Small SL and a better RR - In Progress
* Disclaimer

CEAT Short Trade Setup - Ceat is currently trading at a crucial supply
- I think once the market starts retracing Ceat can soon start to retrace as well
- Ceat can drop anytime after absorbing some more orders
- The risk here on this trade stays around 3-4%
#CEAT

CEATLTD | Positional Trade📊 DETAILS
Sector: Auto Ancillaries - Tyres & Rubber Products
Mkt Cap: 10,199 cr
CEAT, established in 1958, is one of the largest tyre manufacturers and one of the fastest-growing tyre companies in India. CEAT became a part of the RPG Group in 1982. It is amongst the Top 25 best workplaces in Manufacturing by GPTW for 2022.
TTM PE : 19.55 (Average PE)
Sector PE : 53.42
Beta : 0.73
📚 INSIGHTS
Strong Performer
Stock with good financial performance alongside good to expensive valuation, but lacks price momentum as suggested by technical indicators
4.56% away from 52 week high
Outperformer - Ceat up by 3.89% v/s NIFTY 50 up by 0.2% in last 1 month
📈 FINANCIALS
Piotroski Score of 7/9 indicates Strong Financials
Disclaimer: This analysis is for educational purposes only, and I'm not a SEBI registered analyst.
If you found this analysis helpful, I encourage you to like and share it. Your observations and comments are also welcomed below. Your support, likes, follows, and comments motivate me to consistently share valuable insights with you.
🔍 More Analysis & Trade Setups 🔍
For more technical analysis and trade setups, make sure to follow me on TradingView: www.tradingview.com

Intraday 26 April_ Ceat Tires_ LONGIntraday Trade setup for 26 April
I have selected 4 stocks for intraday, not all the trades will get executed.
I always place Stop Loss Market Buy order above or below (for LONG and SHORT) the high/low of the reference candle to make an entry.
Entry: 1449
SL: 1434
Target: 1479
Disclaimer: The analysis or trade setup is of my own. Please do your own analysis before jumping into the trade. I shall not be responsible for the profit/loss in either way.

CEATLTD | Swing Trade📊 Details
CEAT, established in 1958, is one of the largest tyre manufacturers and one of the fastest-growing tyre companies in India. CEAT became a part of the RPG Group in 1982. It is amongst the Top 25 best workplaces in Manufacturing by GPTW for 2022.
Disclaimer: This analysis is solely for educational purposes and does not make me a SEBI registered analyst.
If you found this analysis helpful, I encourage you to like and share it. Your observations and comments are also welcomed below. Your support, likes, follows, and comments motivate me to consistently share valuable insights with you.
🔍 More Analysis & Trade Setups 🔍
For more technical analysis and trade setups, make sure to follow me on TradingView: www.tradingview.com

Ceat - Long Setup, Move is ON...#CEATLTD trading above Resistance of 2019
Next Resistance is at 2366
Support is at 1715
Here are previous charts:
Chart is self explanatory. Entry, Resistances and Support are mentioned on the chart.
Disclaimer: This is for demonstration and educational purpose only. This is not buying or selling recommendations. I am not SEBI registered. Please consult your financial advisor before taking any trade.

Ceat Cup & Handle Beakout Ceat Cup & Handle Beakout
Target 3000/3200++
Auto / Auto Anxillary / Tyre Stocks in Focus

Ceat - Long Setup, Move is ON...#CEATLTD trading above Resistance of 1715
Next Resistance is at 2019
Support is at 1378
Here is previous chart:
Chart is self explanatory. Entry, Resistances and Support are mentioned on the chart.
Disclaimer: This is for demonstration and educational purpose only. This is not buying or selling recommendations. I am not SEBI registered. Please consult your financial advisor before taking any trade.

Breakout in Ceat...Chart is self explanatory. Levels of breakout, possible up-moves (where stock may find resistances) and support (close below which, setup will be invalidated) are clearly defined.
Disclaimer: This is for demonstration and educational purpose only. This is not buying or selling recommendations. I am not SEBI registered. Please consult your financial advisor before taking any trade.

CEAT Tyres gives breakout above 61% Fibonacci Retracement Ceat Tyres above 61% Fibonacci Retracement with good volumes. Next Target at 78.6%

CEATLTD Bullish Rectangle and Range BreakoutSwing Trade Stock Idea. CEATLTD has given Bullish Rectangle and Range Breakout. Accumulate between the range 1465-1535. Good Buying can be seen soon.

CEAT LTDCEAT LTD:- double bottom pattern breakout. keep on radar.
Hello traders,
As always, simple and neat charts so everyone can understand and not make it too complicated.
rest details mentioned in the chart.
will be posting more such ideas like this. Until that, like share and follow :)
check my other ideas to get to know about all the successful trades based on price action.
Thanks,
Ajay.
keep learning and keep earning.

Ceat - Long viewCeat is looking technically strong with CMP above all major moving averages.
If we have a closing above the top trend line we ma see prices moving higher and creating a fresh new high.
Any closing above 1564 should help our cause.


CEAT LTD for swing tradingStrong pullback in weekly charts we may expect rally will continue for short term.
DISCLAIMER:
Trading in Stock Market, Currency or Commodity markets is risky and there is every chance of losing money. One should only trade with a small portion of his or her money which he can afford to lose. Never put all your money in trading and never borrow money to trade.

CEAT 1DCeat has given fresh breakout and sustaining, looking good for positional/swing/investment trades

Ceat Looks BullishCeat Tyres looks bullish on daily and weekly charts.
Levels approx all time high in long term.
Trade at your own risk and analysis.

CEAT LTD TRADE SETUP FOR TOMORROWSo as you see in the chart, there is a strong resistance at the level of 1399,
.
And stock is following thr trendline now, so if the goes above 1399,
.
We can buy this trade for target of 1435, if stock break the trendline in a down side.
.
We will totally ignore this trade.
.
What's your view comment below in the box.

CEAT Ltd for swing tradeLook out for a trendline breakout as it is forming a descending triangle pattern on daily chart.
Enter above 1375.
Other important levels are given in the chart.
