Coromandel Channel BreakoutThe Coromandel stock formed a continuous Channel Pattern and gave a breakout from it. The upcoming targets that come are marked using Trend bases Fib Extension.
Channelbreak

BITCOIN NEED BREATHE CRYPTO:BTCUSD
BTC need take relief of selling because selling is continuously happened so one little bounce is possible and that bounce works as retest of channel breakdown.
Reverse Scenario:
Formation of any bottom pattern
V shape recovery
Long consolidation after with volume brake out.
All chances is possible but there are low possibility
🧠 Always DYOR (Do Your Own Research)
⚖️ This is not financial advice or suggestion
👉 “Risk Is Real 💸 Stay Practical🚀”
💬 Please feel free to ask any questions (It's Free)

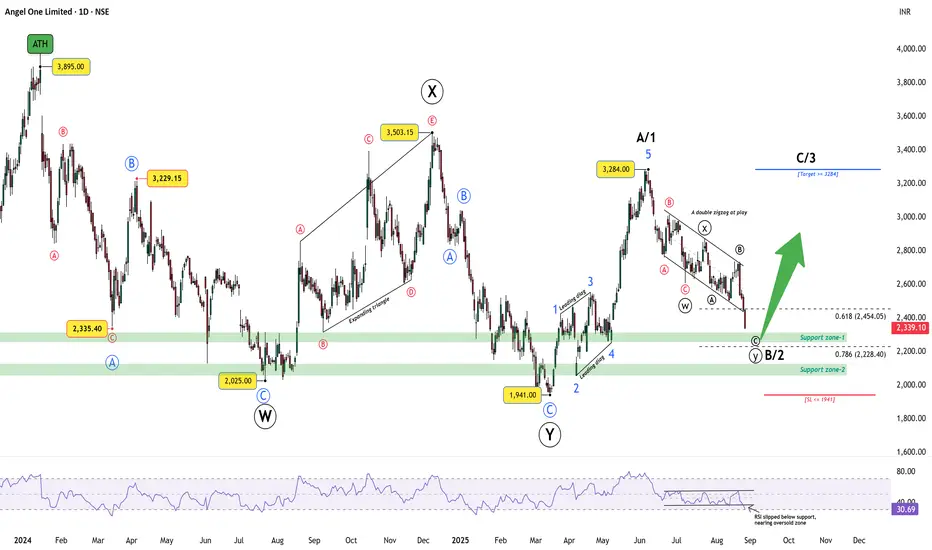
Angel One: Corrective pattern aligning for bounceAngel One topped at an all-time high of 3895 before entering a corrective phase. The decline into 2025 marked Wave W, followed by a rally into 3503 as Wave X, and then a fall to 1941 completing Wave Y. From there, the stock advanced to 3284, counted as Wave A/1 with a leading diagonal.
The decline since 3284 has unfolded as a double zigzag (W–X–Y) within a parallel bearish channel. Wave Y is testing key supports at 2454 (0.618 Fib) and 2228 (0.786 Fib). RSI is near the oversold band around 30, setting up the possibility of bullish divergence if price makes a marginal new low. The bullish view remains valid above 1941; a close below this level invalidates the count.
Trade Plan:
Bias: Expecting Wave B/2 to complete around 2228
Trigger: Watch for bullish divergence or reversal candles near support
Target: A break above 3284 would confirm Wave C/3
Risk: Stop loss at 1941
Disclaimer: This analysis is for educational purposes only and does not constitute investment advice. Please do your own research (DYOR) before making any trading decisions.
Laurus Labs (LAURUSLABS)Pattern: Flag Pattern
Breakout Zone: Above ₹927
Structure: The stock is consolidating in a narrow flag after a strong impulsive rally. EMAs are positively aligned; price respecting 20 EMA.
Momentum: RSI > 60 with MACD crossover supporting trend continuation.
Plan:
Buy Trigger: Close above ₹927
Stoploss: ATR-based (~₹900)
Targets: ₹990 → ₹1,030
View: Momentum and EMAs supportive; fresh breakout could lead to trend continuation in Pharma sector.

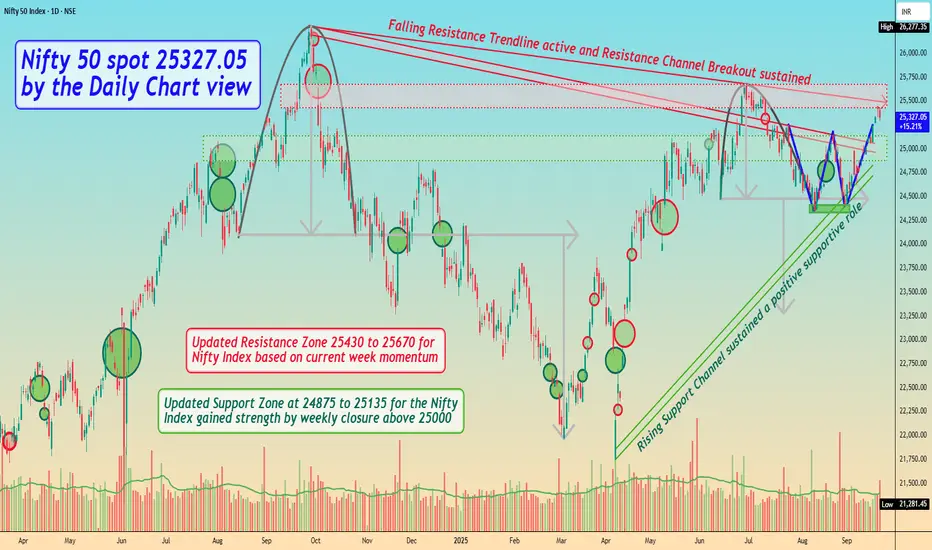
Nifty 50 spot 25327.05 by Daily Chart view - Weekly updateNifty 50 spot 25327.05 by Daily Chart view - Weekly update
- Rising Support Channel sustained a positive supportive role
- Bullish "W" Double Bottom uptrend momentum yet on strong ground
- Falling Resistance Trendline active and Resistance Channel Breakout sustained
- Updated Resistance Zone 25430 to 25670 for Nifty Index based on current week momentum
- Updated Support Zone at 24875 to 25135 for the Nifty Index gained strength by weekly closure above 25000
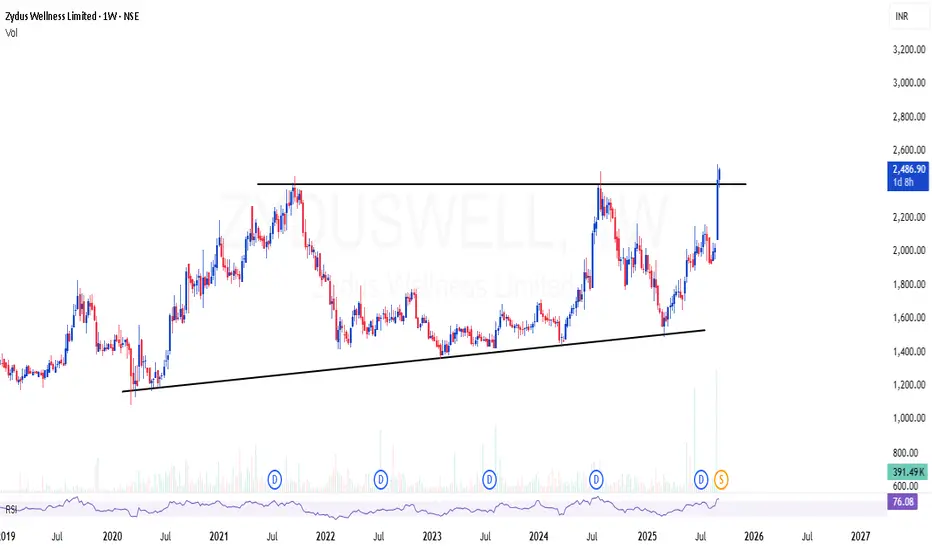
ZYDUSWELL | Simple channel breakout - Looks potential 60-70%ZYDUSWELL | Simple channel breakout - Looks potential 60-70%
CMP : 2486 (Dip : 2200)
SL below : 2000
Target : 4000+
TATA MOTORS – Technical & Educational Snapshot📊 TATA MOTORS – Technical & Educational Snapshot
Ticker: NSE: TATAMOTORS | Sector: 🚗 Automobiles
CMP: ₹ ▲ (as of 20 Aug 2025)
Rating (for learning purpose): ⭐⭐⭐⭐
Pattern Observed: 📈 Channel Breakout
Tata Motors is showing strong bullish signals across multiple technical indicators. The RSI has broken out to 62, reflecting healthy buying momentum without being overbought, while the MACD remains bullish, confirming upward momentum. The SuperTrend and VWAP are both bullish, supporting the upward trend, and the CCI at 98 along with a Stochastic of 96 indicate strong near-term strength. Additionally, the Bollinger Band squeeze has released, suggesting increased volatility and a likely breakout. Altogether, these signals point toward a potential continuation of the bullish move in the near term.
Key Levels:
Resistance: 711 | 722 | 742
Support: 681 | 662 | 651
Pullback Area: 671–685
Invalidation level: 654
STWP Trade Analysis:
Entry (Long): Above 703.35
Stop Loss: 656 or below
Reference Levels: 750 | 796
⚠️ Disclaimer – Please Read Carefully
The information shared here is meant purely for learning and awareness. It is not a buy or sell recommendation and should not be taken as investment advice. I am not a SEBI-registered investment advisor, and all views expressed are based on personal study, chart patterns, and publicly available market data.
Trading — whether in stocks or options — carries risk. Markets can move unexpectedly, and losses can sometimes be larger than the money you have invested. Past performance or past setups do not guarantee future results.
If you are a beginner, treat this as a guide to understand how the market works — practice on paper trades before risking real money. If you are an experienced trader, remember to assess your own risk, position sizing, and strategy suitability before entering any trade.
Consult a SEBI-registered financial advisor before making any real trading decision.
By reading, watching, or engaging with this content, you acknowledge that you take full responsibility for your own trades and investments.
💬 Found this useful?
🔼 Give this post a Boost to help more traders discover clean, structured learning.
✍️ Drop your thoughts, questions, or setups in the comments — let’s grow together!
🔁 Share with fellow traders and beginners to spread awareness.
✅ Follow simpletradewithpatience for beginner-friendly setups, price action insights & disciplined trading content.
🚀 Stay Calm. Stay Clean. Trade With Patience.
Trade Smart | Learn Zones | Be Self-Reliant 📊

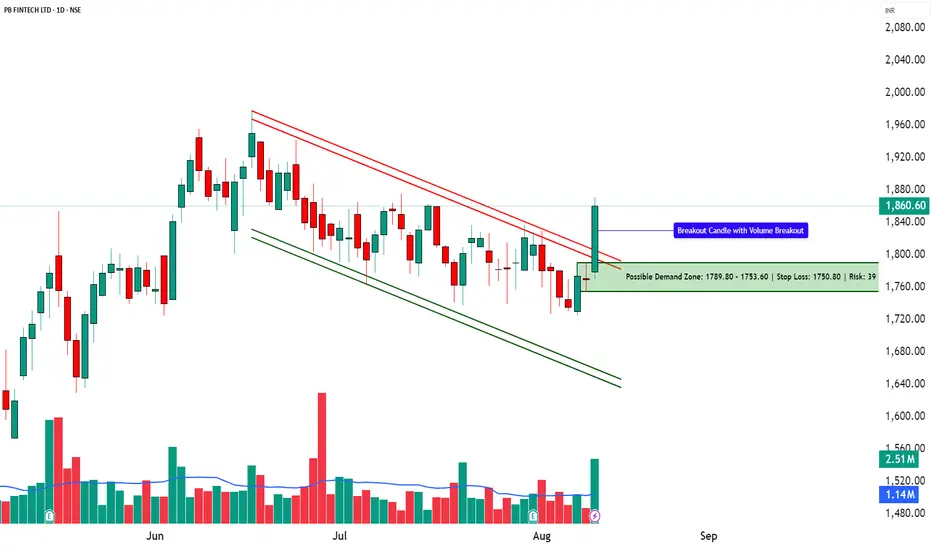
POLICYBZR – Technical & Fundamental Analysis | Channel Breakout📊 POLICYBZR – Technical & Fundamental Educational Snapshot
Ticker: NSE: POLICYBZR | Sector: Digital Insurance & Fintech
CMP: ₹1,860.60
Rating: ⭐⭐⭐ (Neutral to Moderately Bullish Setup – Educational Purposes Only)
Pattern Observed: 📈 Channel Breakout
________________________________________
POLICYBZR (CMP: ₹1,860.6) is exhibiting a Channel Breakout formation, supported by a strong bullish candle. The stock has moved from a bottom range of ₹1,558.4 towards the top range of ₹1,978, with key resistances placed at ₹1,898, ₹1,935, and ₹1,998, while supports are noted at ₹1,797, ₹1,733, and ₹1,696. Technical indicators show RSI at 59 (breakout zone), a bullish MACD crossover, CCI at 122, and Stochastic at 93, indicating strong upward momentum. The price action has also seen a Bollinger Band breakout and is trading above VWAP, suggesting bullish bias. Volume surged to 2.51M shares, significantly higher than the 20-day average of 1.14M, indicating institutional participation. Based on current momentum, there is a possibility of breakout continuation; however, traders should monitor support levels for any reversal signals.
As of early August 2025, PB Fintech’s insurance platform Policy Bazaar has been penalised ₹5 crore by the insurance regulator for certain regulatory lapses, leading to a short-term decline of around 2–3 percent in its share price. Despite this development, the company reported a 33 percent year-on-year increase in Q1 revenues, with net profit rising by 50 percent, supported by a 35 percent growth in core insurance premium collections to approximately ₹6,616 crore. In addition, its enterprise arm has introduced “ClaimSetu”, an AI-powered claims insights and scoring tool for group health insurance, aimed at streamlining documentation and potentially improving claim processing efficiency by up to 50 percent.
From an investment perspective, the outlook for PB Fintech (Policy Bazaar) remains mixed, with both upside potential and downside risks. On the bullish side, sustained revenue growth, rising profitability, and continued expansion in insurance premium collections reflect strong operational momentum. The introduction of AI-driven claim processing solutions could enhance efficiency and customer experience, potentially boosting market share over time. However, the bearish view factors in recent regulatory penalties, heightened compliance scrutiny, and the possibility of short-term sentiment pressure on the stock price. In the short term, price action may remain volatile as the market digests recent developments and broader market conditions. Over the long term, the company’s growth trajectory will depend on successful regulatory compliance, execution of technology-led initiatives, and maintaining a competitive edge in the digital insurance space.
________________________________________
📊 STWP Trade Analysis – Based on the STWP trade framework, a backtest-style example of a possible breakout setup could involve a long entry near ₹1,870.7 with a protective stop at ₹1,722.2. In similar past setups, price movements have reached zones such as ₹2,019 (approx. 1:1 risk–reward) and ₹2,168 (approx. 1:2 risk–reward).
A more conservative hypothetical example might involve an entry in the ₹1,870.70–₹1,860.60 zone, with a protective stop at ₹1,832.48 and potential upside zones at ₹1,945 and ₹2,001 — risk–reward will vary based on entry.
Additionally, a pullback scenario could be illustrated with a potential entry near ₹1,842.9, protective stop at ₹1,805.6, and upside zones aligned with resistance levels.
Possible Demand Zone (Illustrative): ₹1,789.80 – ₹1,753.60 with Stop Loss: ₹1,750.80
Approximate Risk: ₹39
________________________________________
⚠️ Risk Reminder:
Price volatility may increase due to regulatory factors, market sentiment, or broader index trends. Past chart patterns and backtests do not guarantee future performance.
________________________________________
⚠️ Disclaimer (Read Carefully)
This post is for educational and informational purposes only.
The author is not a SEBI-registered investment advisor. No buy or sell recommendations are being made.
All views are based on chart patterns, publicly available data, and personal learning experience.
Trading involves risk. Losses can exceed your investment. Always consult a SEBI-registered advisor before making financial decisions.
By engaging with this content, you agree to these terms.
________________________________________
💬 Found this useful?
Drop your thoughts, questions, or setups in the comments — let’s grow together!
🔁 Share this post with fellow traders and beginners to spread clean, structure-based learning.
✅ Follow simpletradewithpatience for beginner-friendly setups, price action insights, and disciplined trading content.
🚀 Stay Calm. Stay Clean. Trade With Patience.
Trade Smart | Learn Zones | Be Self-Reliant 📊
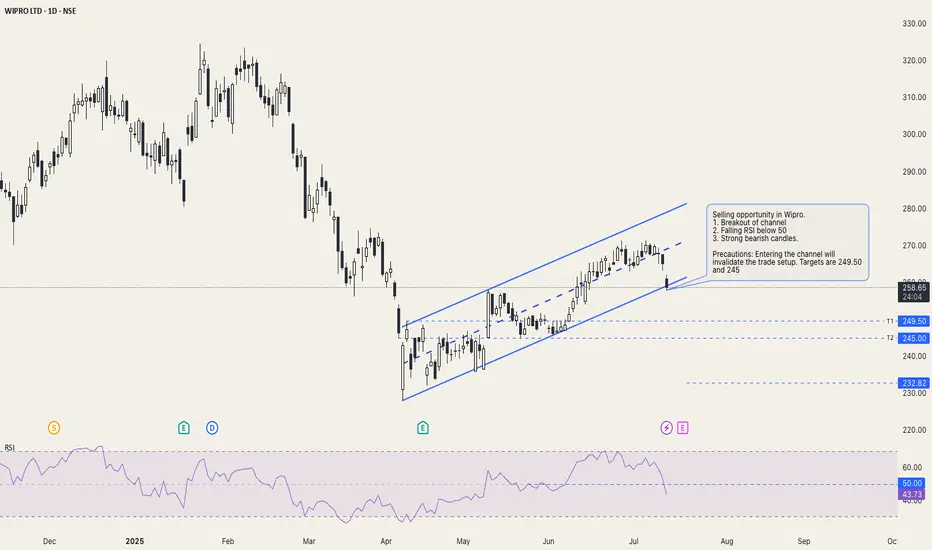
Channel breakout in Wipro: BearishSelling opportunity in Wipro.
1. Breakout of channel
2. Falling RSI below 50
3. Strong bearish candles.
Precautions: Entering the channel will invalidate the trade setup. Targets are 249.50 and 245
(ignore the 232 line)
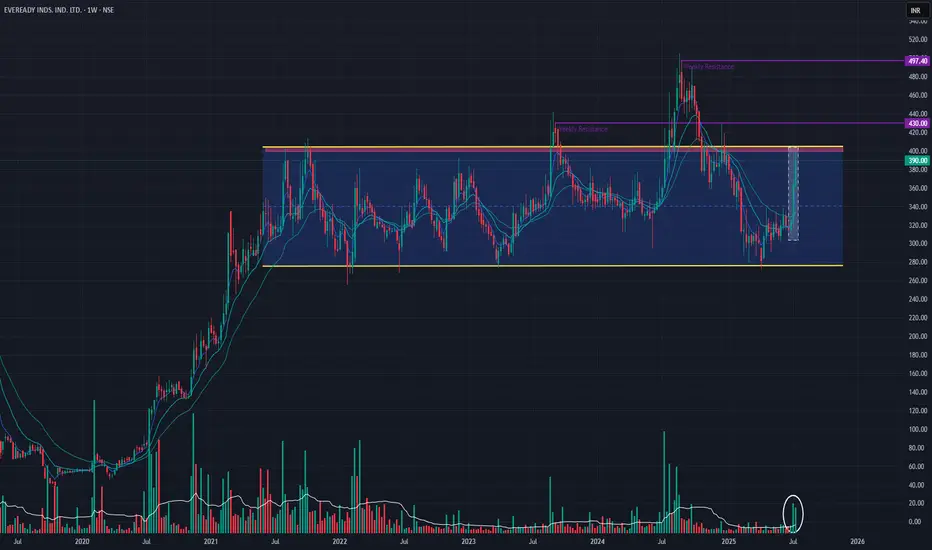
Eveready Inds. Ind. Ltd (Weekly Timeframe) - Potential BreakOutThe stock has been in a range since 2021, with couple of BreakOuts (2023 & 2024) which did not sustain momentum. Past 3 weeks the stock has gained appox: +29% with huge volume buildup . The short-term EMAs are in PCO state, indicating an uptrend . The stock may BreakOut of the resistance zone (398 - 406), if buyers show interest in the stock to take it further up.
Watchout for next week's price action!!
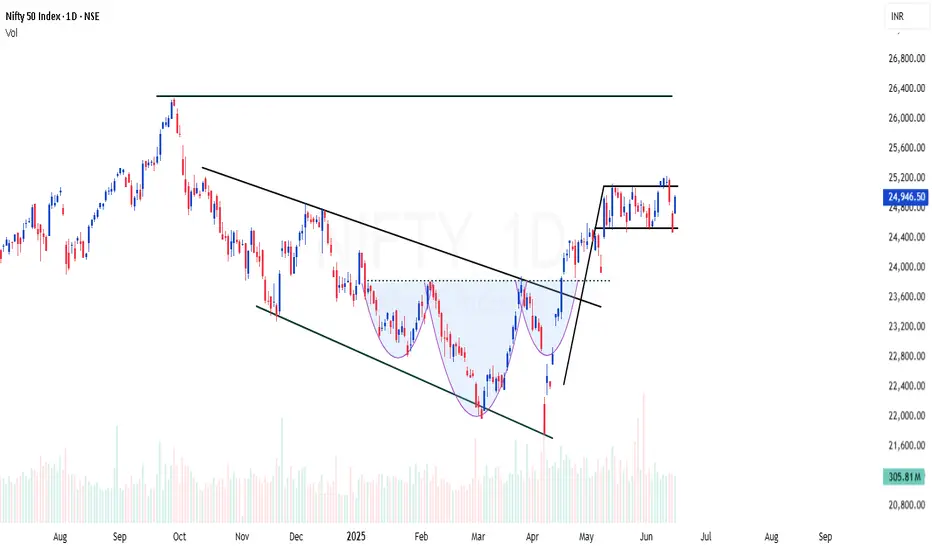
NIFTY | Back to back bullish patternsNIFTY showing back to back bullish signs
Channel breakout - Done
Inverted Head & Shoulder breakout (INHS) - Done
Now forming flag setup
NIFTY shows strength to move another 15% this year
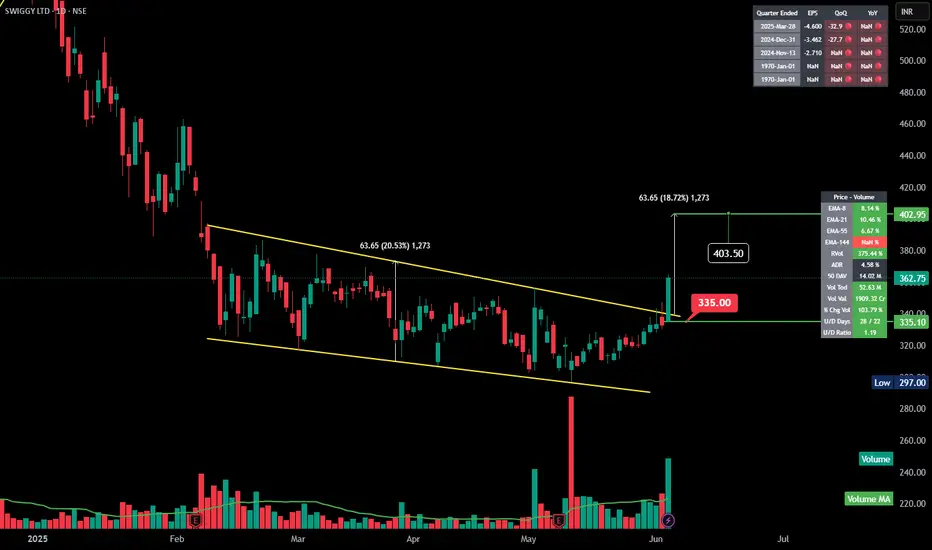
SWIGGY | Falling Channel Breakout | Good VolumeBased on the images you've uploaded, here's a detailed analysis and summary of the SWIGGY LTD chart:
---
### **Chart Pattern and Technical Overview:**
* **Falling Channel:**
The price action was contained in a downward-sloping channel, marked by two yellow trendlines (upper and lower boundaries).
This pattern reflects a period of consolidation within a larger downtrend.
* **Breakout:**
Recently, the price has broken out of this descending channel, closing above the upper trendline around the 335.00 level.
Such a breakout is typically considered bullish, suggesting a potential trend reversal or at least a short-term move to the upside.
* **Volume Confirmation:**
A significant increase in volume accompanied the breakout, confirming the strength of this move.
High volume breakouts generally have a higher probability of sustaining.
* **Price Targets & Measurements:**
* The breakout target is projected based on the height of the channel (approx. 63.65 points).
* Measured breakout target:
$\text{Breakout level (335.00)} + \text{Channel height (63.65)} = 403.50$.
* Current price: 362.75.
* Immediate resistance zone near 403.50.
---
* **Volume:**
* Today’s volume (52.63M) is above the 50-day average (14.02M).
* This indicates strong interest and participation by traders.
---
### **Key Levels:**
✅ Support: **335.00**
✅ Resistance: **403.50**
✅ Low: **297.00**
---
### **Conclusion & Implication:**
The breakout from the falling channel with strong volume suggests a potential bullish continuation towards 403.50, as long as 335.00 holds as support. Watch for further volume spikes and price action near the target zone to determine sustainability.
---
Bullish trap in CESC: Ascending channel.Two points are showing a bullish trap in CESC chart (daily timeframe):-
1. Prices are exhausting in the channel. A volume spike is needed for the channel breakout, which is missing here.
2. Prices made higher highs, but RSI made lower highs, showing divergence. This means there are good chances for a bearish breakout.
3. A failed breakout from the lower channel will pull prices back to test the higher trendline of the channel. RSI breaking the 75+ will be a bullish signal for the prices to go for the higher targets.

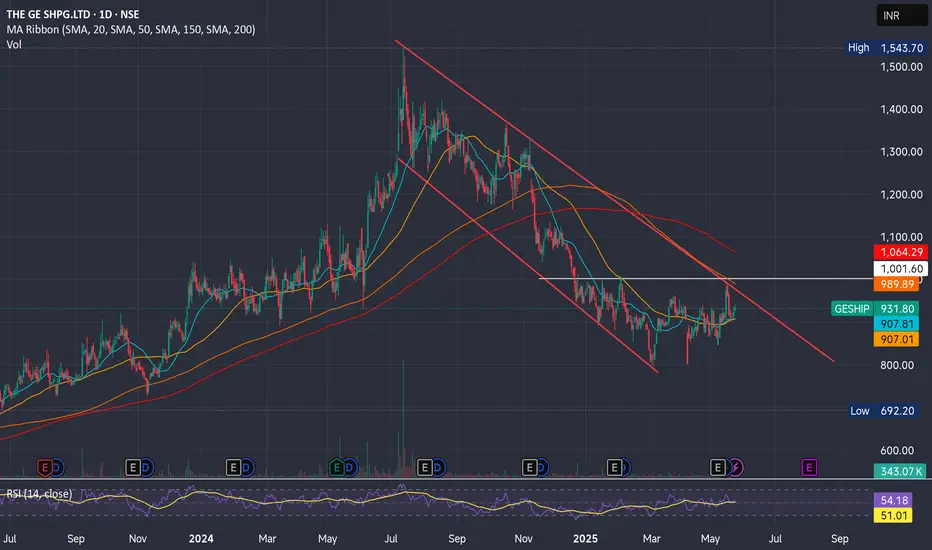
Ge shipping in a trading channel Ge shipping in trading channel range may breakout soon.
Stop loss 904 may add at current levels for Target towards 1225.
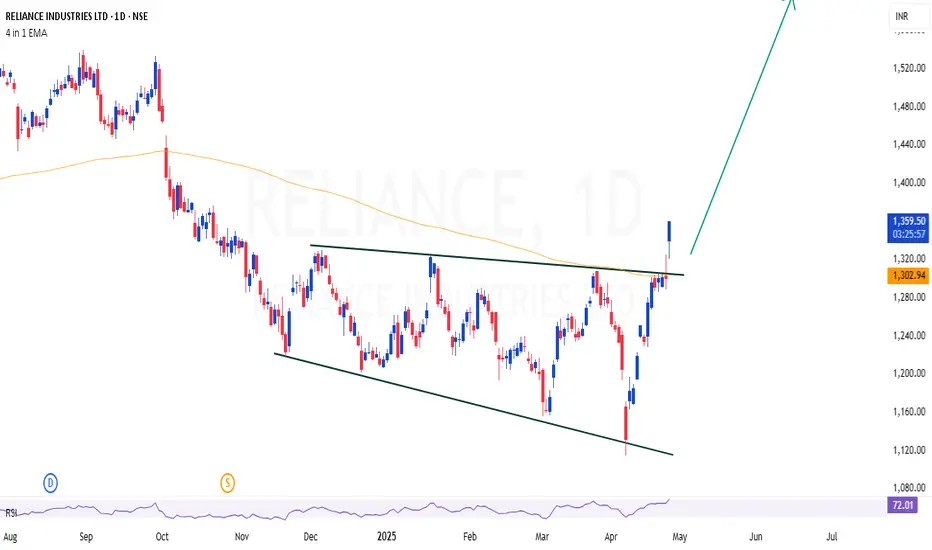
RELIANCE | Lets join hands with Ambani - Looks good for 20% shorRELIANCE | Lets join hands with Ambani - Looks good for 20% short term
Simple trendline (Channel) breakout
CMP : 1359
SL : 1250
Target : 1600
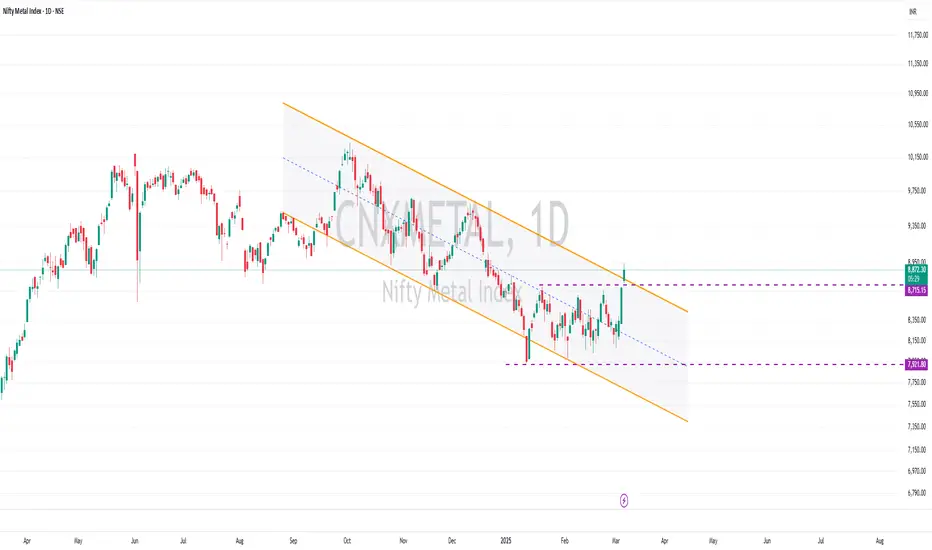
Nifty Metal Index - Trendline Breakout! 📊 Nifty Metal Index - Trendline Breakout! 🔥
✅ Ascending Channel Breakout – After months of base formation & consolidation (since March 2025), the index has broken out with strong momentum! 📈
✅ Wide-Range Candles – A sign of strength & institutional activity 🏦
✅ Sector Focus – If China will be doing well then in the upcoming quarters, metals could see strong upside opportunities 💡
📌 Key Levels to Watch:
🔹 8,715 – Previous resistance now potential support 📍
🔹 7,921 – Important demand zone if a retest happens
💡 Metals could be a key sector to track! Chart shared to spot potential trade setups. 🚀
Univastu- Broke out of an Ascending Channel.Stock Analysis: UNIVASTU INDIA LTD
Trend: The stock is currently in an uptrend.
Breakout: It has successfully broken out of an ascending channel.
Pattern: Forming a Volatility Contraction Pattern (VCP).
Volume: The breakout is accompanied by high volume and a wide-range bullish candle.
Entry Point
Trigger: Above ₹302.
Confirmation: Wait for a daily close above this level before entering.
Stop Loss
SL: ₹262 (Deep SL).
Current Market Price (CMP)
₹312.45 (Almost at the upper circuit).
Buy only test quantities to observe performance.
Avoid large trades due to current weakness in the broader market.
Focus on buying stocks with strong structures in small quantities to build a test portfolio.
This approach will help gauge the overall market trend and prepare for potential reversals.
Note
When the broader market bottoms out and reverses, structurally strong stocks like this one have the potential for significant upside moves. Exercise caution and patience in the current market environment.
.

Zaggle Flag&Pole breakout!After a CNH breakout and retracement,Zaggle broke out from a bullish Flag and Pole pattern. Keep this on your radar as a positional bet.
SL is deep. Position size accordingly. This is just shared for educational purposes. Please consult with your financial advisor before trading.
The market is very weak and election results are due, anything negative can wreak havoc in the market. So be cautious. Trade as per your risk appetite only.

IREDA - Positional target 300-> CMP 222 / 1d timeframe
-> Breaking out the channel trend
-> Bouncing from the support line
-> Crossing 20/50/100 EMA
-> Positional target will be 300
-> Good Luck, Traders!

RAYMONDBreakout from the Descending Channel with good volume. This should mark the start of a fresh trend.
The stock may take some time moving sideways but the bottom of this retracement seems to be over here.

Time to Buy/Bottomfish #cochinship ?At this juncture cochin Shipyard offers good RR. From a deep price and Time correction, the stock formed a base and broke out of it and showing signs of reversal. A potential stage 2.
The reasons for going long are as follows.
-Stage 2 Breakout
-Formed Double Bottom in DTF
-Narrow Range candles with Dry Volume
- Channel Breakout.
Keep In mind:
- Volumes need to improve.
-Expect Shakeouts.
Tweak the SL as per your risk appetite. Like I mentioned in the beginning, if this is a reversal then the reward will be high.
As always- Please study the chart and do your due diligence. And please do not trade on any tips. Enter only if you understand the company, the chart and the price.
#StocksInFocus

Sandhar TechnologiesThe guidance by the management has been positive and since the stock has corrected, it seems to be in an ideal spot for some quick gains.
Descending parallel channel has been breached. On Daily timeframe it could be called the ABC pattern.

JpolyInvest technically good. Add to your watch list.-Technically good, breaking out.
-Good Volumes.
-Broke out of Parallel channel.
-Forming a good pattern.
Extremely Risky. Very good chances of breakouts failing. Please do not trade based on my view. The chart is shared to alert you of a probable good setup.
Trade at your discretion. Don't be fooled by today's upmove in the market. We need more confirmation. And trade small qty only more like a test quantity.
