INFIBEAM 1 Week Time Frame 📌 Current Price Snapshot
📍 Latest traded price: ₹16.25 – ₹16.30 approx. (last session)
📈 52-week range: ₹13.63 (low) – ₹22.02 (high)
📊 Near-Term 1-Week Technical Levels
🔰 Pivot Point (Reference)
Pivot: ~₹15.6 – ₹15.7 (neutral zone for short-term bias)
🛑 Resistance (Upside Targets)
These are levels where price may face selling pressure this week:
Level Mark (Approx) Notes
R1 ~₹15.8 – ₹16.0 First hurdle near current action zone
R2 ₹16.3 – ₹16.4 Key near-term resistance — breakout above this could add momentum
R3 ₹16.8 – ₹17.0 Next upside target if buyers remain strong
👉 A decisive daily close above ~₹16.4–₹16.5 can open the door toward ₹17.0+ in the week.
🧱 Support (Downside Floors)
These are levels where dips may find buyers this week:
Level Mark (Approx) Notes
S1 ₹15.3 – ₹15.4 First strong support — psychologically key pivot band
S2 ₹15.0 – ₹15.1 Next cushion below if the market weakens
S3 ₹14.8 – ₹14.7 Deeper support zone if selling accelerates
👉 A breakdown below ~₹15.0 would increase bearish pressure for the week.
📈 Short-Term Bias Interpretation
Bullish scenario:
If price holds above ₹15.6–₹15.7 pivot and breaks ₹16.3–₹16.4, the next near-term move could be toward ₹16.8–₹17.0+.
Neutral / range-bound:
Between ₹15.3 and ₹16.3, expect consolidation/trading range.
Bearish scenario:
Sustained trading below ₹15.3 risks weakening into ₹15.0 and lower.
🧠 Quick Trading Guide (1-Week)
📍 Watch for reaction at:
✔ Above ₹16.3–₹16.4 = possible upside extens ion
✔ Below ₹15.3 = risk of deeper pullback
📊 Trend cues: Recent technical indicators show mixed momentum — short-term range with pickup if buyers assert near pivot area.
Chart-pattern

SAMMAANCAP 1 Month Time Frame 📈 Current Snapshot (as reference)
Last traded / recent price around ~₹147 – ₹151 on NSE (varies with intraday moves).
52‑week range: ~₹97 – ₹192.9.
🔑 1‑Month Key Levels – NSE Pivot, Support & Resistance
Monthly Pivot Levels (short‑term framework):
These come from pivot analysis that captures intermediate trend areas over the past sessions — useful for 1‑month traders.
📍 Pivot Reference (Monthly)
Pivot (central reference): ~₹146‑₹147
This is the main gravity level — above it suggests bullish bias; below implies bearish bias in the short term.
🛑 Resistance Levels (Upside)
These are zones where price may face selling pressure if it rallies:
R1: ~₹155 – ₹157
R2: ~₹164 – ₹165
R3: ~₹173 – ₹175
Resistance areas represent possible profit‑taking or reversal zones near recent reaction highs.
🧱 Support Levels (Downside)
These levels may act as demand zones if price corrects:
S1: ~₹137 – ₹138
S2: ~₹128 – ₹130
S3: ~₹120 – ₹122
Below S1, sellers may dominate, with deeper support closer to S3 in an extended correction.
⚠️ Note
These levels are derived from pivot and technical data (not financial advice). Market news/events (e.g., legal developments, earnings) can quickly shift short‑term trend dynamics, so use stops and risk management if trading.

CREDITACC 1 Week Time Frame 📌 Current Price Context (21 Jan 2026)
Approx current price: ~₹1,330 – ₹1,370 on NSE as of recent trading session.
📊 Weekly Technical Levels (1-Week Timeframe)
These levels are derived from recent weekly pivot analysis (reflecting highs/lows and average weekly trend):
Weekly Pivot Point: ~ ₹1,300 – ₹1,305
Weekly Resistance Levels:
R1: ~ ₹1,325 – ₹1,330
R2: ~ ₹1,350 – ₹1,360
R3: ~ ₹1,375+
Weekly Support Levels:
S1: ~ ₹1,275 – ₹1,280
S2: ~ ₹1,250 – ₹1,255
S3: ~ ₹1,225 – ₹1,220
(Classic pivot study — see weekly pivot table)
📈 Short Summary of Weekly Bias
Bullish scenario:
if the price sustains above weekly pivot (~₹1,300) and breaks above R1 (~₹1,330), momentum favors moves toward R2 (~₹1,350-1,360) and possibly R3 (~₹1,375) for the coming week.
Neutral / Range scenario:
Between ₹1,275 to ₹1,330, price tends to oscillate within the weekly range with no clear directional bias — traders watch pivot and R1/S1 zones.
Bearish scenario:
A break below S1 (~₹1,275) increases the risk of deeper probes toward S2 (~₹1,250) or S3 (~₹1,220) on the weekly chart.
📌 How to Use These Levels
1. Short-term traders (swing): Watch catalystsensing breaks above R1/R2 for bullish continuation setups or break below S1/S2 for bearish setups.
2. Position traders: Weekly pivot and 50/100 SMA clusters (around ₹1,300-₹1,340) act as key decision zones for holding or trimming positions.

UNIONBANK 1 Week Time Frame 📊 Current Price (Weekly Context)
~₹162 – ₹163 per share (latest live/NSE quote).
📈 Weekly Support & Resistance Zones (Approx)
Resistance Levels (Upside)
These are key levels to watch if the weekly price continues uptrend:
• R1 ≈ ₹167–₹168 – immediate resistance near recent 52‑week high.
• R2 ≈ ₹170–₹172 – near psychological/upper range targets.
• R3 ≈ ₹175+ – extended zone if momentum accelerates (trend continuation).
Support Levels (Downside)
Important weekly support levels where pullbacks could find buying support:
• S1 ≈ ₹158–₹159 – near recent short‑term pullback zone.
• S2 ≈ ₹155–₹156 – near mid‑range cluster of moving averages.
• S3 ≈ ₹150–₹152 – deeper support aligned with 50‑day average zone.
🔄 Technical Indicators Outlook (Weekly / Short‑Term)
Momentum & Trend:
Weekly technicals show bullish momentum with RSI moderately bullish and MACD positive on recent data.
Price remains above key EMAs (20, 50, 100, 200 averages), which supports the uptrend.
Volatility:
ATR and trend indicators suggest active movement, so breaks above/below key levels can lead to sustained swings.
📌 Quick Weekly Levels Summary (Approx)
Level Type Price Zone
R3 (Strong Resist) ₹172–₹175+
R2 (Next Resist) ₹170–₹172
R1 (Immediate Resist) ₹167–₹168
Current Price ₹162–₹163
S1 (Immediate Support) ₹158–₹159
S2 (Mid Support) ₹155–₹156
S3 (Strong Support) ₹150–₹152

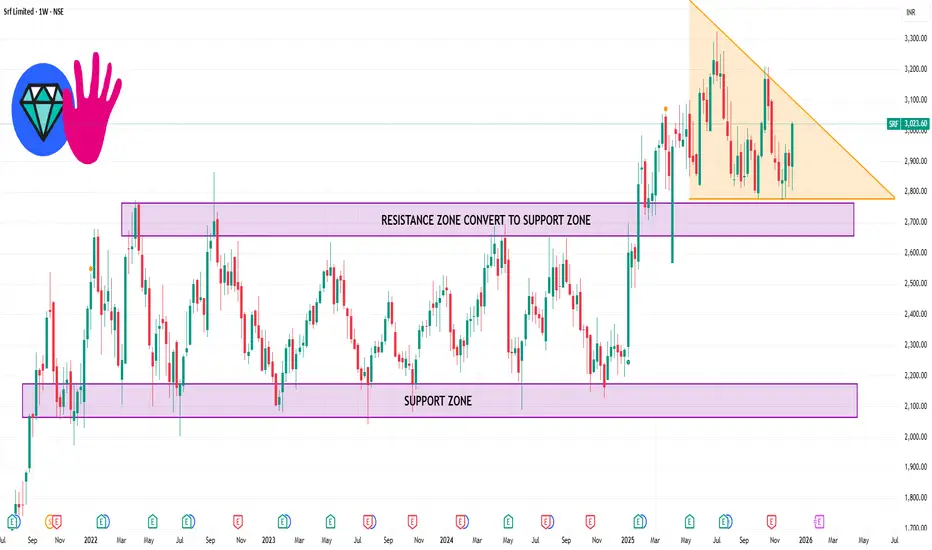
SRF 1 Week Timw Frame 📌 Current Price Context (as of latest close):
• SRF was trading around ₹3,023–₹3,024 recently.
📊 Weekly / Short-Term Key Levels
📈 Resistance Levels
These are possible upside targets where price may face supply pressure:
R1 (Immediate resistance): ~₹2,971–₹2,990 — key level to break for near-term upside.
R2: ~₹3,007–₹3,031 — next hurdle after R1.
R3 / Higher Resistances: ~₹3,060–₹3,100+ zones if momentum continues.
A close above ₹3,000–₹3,030 on the weekly chart often signals stronger short-term bullish bias.
📉 Support Levels
These are downside floors that may act as buyers’ interest zones:
S1 (Immediate support): ~₹2,873–₹2,900 — first key support area.
S2: ~₹2,811 — deeper support if the first level breaks.
S3: ~₹2,775 or lower — if broader weakness materialises.
📌 Weekly Pivot Level
• Pivot zone around ₹2,950–₹2,990 can act as a gauge of short-term trend direction. Above it = bullish bias; below it = bearish bias.
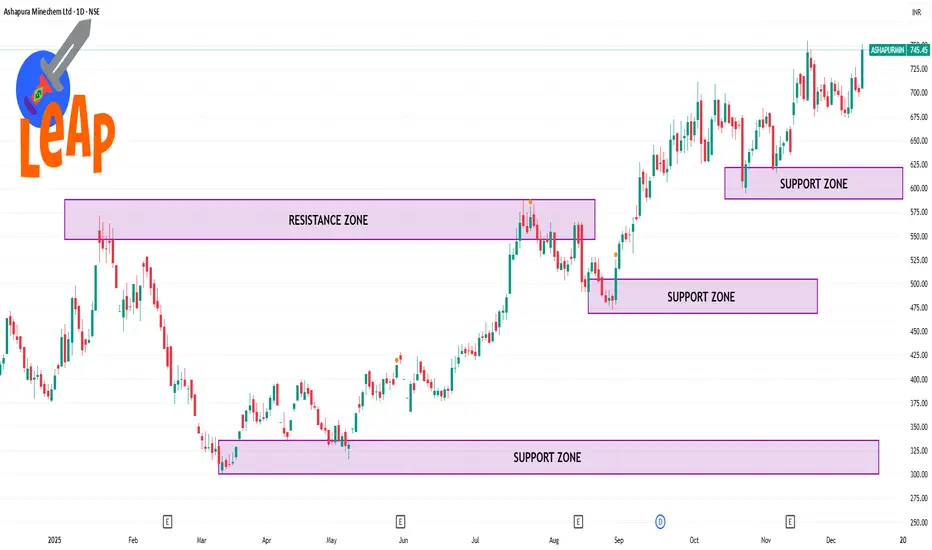
ASHAPURMIN 1 Day Time Frame 📌 Current Live Price (Daily)
Approx ₹745.4 on NSE at latest available update.
This reflects the recent trading session where the stock moved between ~₹705 (low) and ~₹751 (high) before settling near ₹745.45.
📊 Daily Technical Levels (Pivot / Support / Resistance)
🔹 Pivot Point Levels (based on yesterday’s range)
(These can be used for today’s intraday bias)
Daily Pivot: ~₹733.8
Support 1: ~ ₹716.6
Support 2: ~ ₹687.8
Support 3: ~ ₹670.6
Resistance 1: ~ ₹762.6
Resistance 2: ~ ₹779.8
Resistance 3: ~ ₹808.6
(Classic pivot method daily)
Punjab National Bank Flag Breakout Setup📈 Punjab National Bank (PNB) – Flag Breakout Setup
Observed a classic flag pattern on the daily chart after a strong pole move in 2023–24.
✅ Breakout above the channel confirmed with price action near 113.
✅ Entry plan: Watch for daily close >113 with volume.
✅ Stop-loss idea: Below 106.
✅ Target 1: 140 (first swing resistance).
✅ Measured move projection targets up to ~198 possible based on full flag pole.
Volume confirmation and broader market context will guide the actual trade trigger.

USDCAD LONGthis trade was taken for a long as soon as it passed the first break-out zone that was fixed by looking at the support and resistance zones that were set and once the target zone was crossed the force that it went was so fast that it hit the resistance zone in no time but what was predicted that it would cross the resistance zone and shoot out bullish didn't happen so had to take profit
Mistakes to be corrected :
entered in the middle of the trade by missing the trade alerts and set up

Caplin point Daily flag and pole B/OA bullish flag and pole b/o has been confirmed on daily chart of NSE:CAPLIPOINT . Here one can create a fresh position in the scrip. Buy@840 SL@800 TGT@880/920/960
The risk to reward ratio is 1:3
Exit the position if the stop loss is triggered on DCB.
DO YOU WANT ALL MY RESEARCH FOR FREE THEN DON'T FORGET TO FOLLOW ME.
I AM EAGERLY WAITING FOR YOUR COMMENTS ON THE STUDY...
Disclaimer: Content shared is for information and education purposes only and should not be treated as investment or trading advice. Please do your own analysis or take independent professional financial advice before making any investments based on your own personal circumstances. Investment in securities are subject to market risks, please carry out your due diligence before investing. And last but not the least, past performance is not indicative of future returns.

HITECH PIPES LTD. is gearing up for Breakout.Stock is accumulating in Symmetrical Triangular pattern in a daily time frame. After consolidation period of 9 months stock has firmed strong upward move with good volume and more likely to break its resistance. If we see RSI, it's also indicating a big momentum is on the way. We will wait till its trend line is broken, if it does and sustains above the Line that would be a trigger.
BUY- 78.30
target- 88
Stoploss- 74.20
Caution
This is a SmallCap company, that makes it more volatile, So do respect StopLoss. You can add it to your Watch List to understand price further.
What do you think, do let me know in comment section.

Bajaj consumer ascending triangle 1) 3 times resistance @185
2) breakout happened with good buy volume
3) deliverable quantity increasing
4)

Rising Wedge pattern reversal in COFORGE.COFORGE LTD
Key highlights: 💡
✅On 1Day Time Frame Stock Showing Reversal of Rising Wedge Pattern.
✅ It can give movement upto the Reversal final target of below 4100-.
✅There have chances of breakdown of Support level too.
✅ After breakdown of Support level this stock can gives strong downside rally upto below 3505-.

i predict traget and stoploss this predits 100% workingfirst traget 856.05 for intrday to short
and stoploss 862.65
second traget 854.35
swingtrading traget and stoploss to long
first traget 966.25
final traget 1003.20
stoploss 837.35
today i profit 1lkh in intraday trading
this 100% works

Cup and Handle pattern on BankNifty.
BANKNIFTY
It will be wonderful if this pattern completes the rest by tomorrow. There is some relation to the previous highs and tomorrows resistances and some pivot points.
Though it has a high percentage of possibility to happen.
(This is only my perspective. Do your own analysis and confirm before making any decision.)

DABUR --Bullish --Weekly Chart DABUR -- Weekly --Bullish Chart pattern setup
TECHNICAL OBSERVATIONS .
1. DABUR seen bullish on weekly chart as chart pattern is higher high Currently .
2. Trendline support and channel support seen , Double bottom made on same support level .
3. CCI divergence seen on chart
4 . Trend reversal doji candle form at channel lower level support .
5. One can initiate Buy at channel support level 530-535 for target 550-580-600 POSITIONAL ( 1-3 ) Month stop loss 475 hourly /daily closing basis
HAPPY TRADING !!
** THI IDEA IS FOR EDUCATIONAL PURPOSE .. ** trade at own risk !
HAPPY TRADING. !

Kotak Mahindra Bank LongPossible pattern breakout.
Currently show breakdown but pattern is bullish.
So, possible chance to upside move and breakout may happen.

HINDALCO-- UPDATE : Rounded Bottom Bullish chart pattern. HINDALCO ---UPDATE : 06/03/2023 -- ROUNDED BOTTOM BULLISH CHART PATTERN --DAILY CHART
1. This is reference to previous idea of HINDALCO -- , we can see rounded bottom cup formation of chart ,
2. correcttion from 480 sub level sub to 400 level downtrend form, and after support formation of 400 level curve seen upside level .
3. 415 form as support , stock seen close around this level which is near by trendline breakout , if breakout candle seen then stock will be at bullish zone . for target 440-480 + as mention in previous idea.
4. Nearest support level 404-408 , resistance 425-440
5. CCI , EMA bullish crossover seen ,
** . arrow indicate rounded bottom formation levels.
THIS IDEA IS FOR EDUCATIONAL PURPOSE ..trade at own risk !!
HAPPY TRADING !!

crompton greaves at support level crompton greaves at support level now , can form double bottom from here with good risk reward

HCC - monthly cmp 20Monthly trendline breakout + cup and handle breakout.
Monthly RSI above 60, bullish.
Monthly charts, so it may take time but can give 40-60% returns in 2023
Buying range 17-20
Targets 23-28-32 and if something even better happens, then even 40.
SL - 14 on weekly closing.(around 20-25%)

ULTRATECH CEMENT TEHNICAL ANLYSIS ULTRATECH CEMENT TEHNICAL ANLYSIS
CUP ☕ AND Handal pattern
A cup and handle is a technical chart pattern that resembles a cup and handle where the cup is in the shape of a "u" and the handle has a slight downward drift.

HUL: BREAKOUTStock has given a breakout of a triangular structure . One should go long on current levels maintaining the SL of 2300 and look for the target of 2675/2845 in the coming days.

NIFTY -- BULLISH CHART PATTERN NIFTY -- HOURLY CHART -- BULLISH CHART PATTERN
1. Recent fall of nifty from high level lower channel seen till 15800 level where nifty form double bottom at 15800 level
2. After double bottom formation nifty at trading at upper channel
3. consecutive support taken at lower level of upper channel has seen where trend follow as uptrend higher top and higher bottom seen
4. recent support taken at lower level of upper channel arround 16200 and last 2 trading session nifty seen bullish up by around 300 points at present 16478 close at last trading session
5. next few session upper channel trend followed and nifty can hit target 16600-16800 level .
6. 16200-16400 work as support and 16600-16800 resistance as target as per channel
7. histogram seen bullish in last 2 trading session confirm this trend.
** THIS IDEA IS FOR EDUCATIONAL PURPOSE
HAPPY TRADING. !!

USDCHF pullback is in the offing, focus on SNB’s JordanUSDCHF prints a five-day uptrend to refresh the yearly high at around 0.9460. The pair’s latest upswing took place from the 21-DMA and monthly support line. However, the overbought RSI and April 2021 peak near 0.9475 challenge the pair buyers ahead of a speech from the Swiss National Bank (SNB) Chairman Thomas Jordan. Even if the quote rises past 0.9475, an upward sloping trend line from late September, around 0.9485, will act like a tough nut to crack for the bulls. Also acting as an upward barrier is the 0.9500 psychological magnet.
Alternatively, pullback moves may initially aim for the 0.9400 threshold before testing the short-term support line surrounding 0.9350. Even if the USDCHF bears manage to conquer the nearby trend line support, the 21-DMA level of 0.9326 and the 0.9300 round figure could entertain them. It’s worth noting, however, that the latest swing low, marked on March 31 around 0.9195, becomes important support to watch during the pair’s declines past-0.9300.
Overall, the USDCHF upside is likely to fade soon and hence today’s speech from SNB Chief Jordan will be important to watch.
