BHAGERIA Mega Breakout AheadHey Family, there is a one more stock Which is showing a great opportunity.
Key Points:-
* Formation of Ascending Triangle Pattern in Daily TF.
* From Sep 2022 to Aug 2024 Tested & Moving Near Resistance Many times.
* It's Near resistance Zone and trying to Sustain above Resistance Zone with good volume.
* Volume Accumulation (Volume is Rising).
What is your view please comment it down and also boost the idea this help to motivate us. We are Certified. All views shared on this channel are my personal opinion and is shared for educational purpose and should not be considered advise of any nature.
Chartanalaysis

Reversal Broadening Wedge pattern in SYNGENESYNGENE INTERNATIONAL LTD
Key highlights: 💡⚡
📈 On 1 Day Time Frame Stock Showing Reversal of Broadening Wedge Pattern.
📈 It can give movement upto the Reversal Final target of Above 768+.
📈 There have chances of breakout of Resistance level too.
📈 After breakout of Resistance level this stock can gives strong upside rally upto Above 874+.
📈 Can Go Long in this stock by placing a stop loss Below 607-.

ELGIEQUIP - Ready to give VCP Breakout#NSE:ELGIEQUIP
CMP - 652.60
~Stock forming vcp pattern
~High chance to give upside move
~ Buy above 665
~ Target - 700,715, 750+
~ Week Below - 630

Reversal Broadening Wedge pattern in BANKNIFTYBANKNIFTY INDEX
Key highlights: 💡⚡
📈 On 1 Day Time Frame Banknifty index Showing Reversal of Broadening Wedge Pattern.
📈 It can give movement upto the Reversal Final target of Above 49340+.
📈 There have chances of breakout of Resistance level too.
📈 After breakout of Resistance level this Banknifty index can gives strong upside rally upto Above 51957+.
📈 Can Go Long in this Banknifty index by placing a stop loss Below 45807-.

Ascending Triangle pattern breakout in HINDALCOHINDALCO INDUSTRIES LTD
Key highlights: 💡⚡
✅On 1 Hour Time Frame Stock Showing Breakout of Ascending Triangle Pattern.
✅Strong Bullish Candlestick Form on this timeframe.
✅It can give movement up to the Breakout target of 650+.
✅Can Go Long in this Stock by placing a stop loss below 614-.

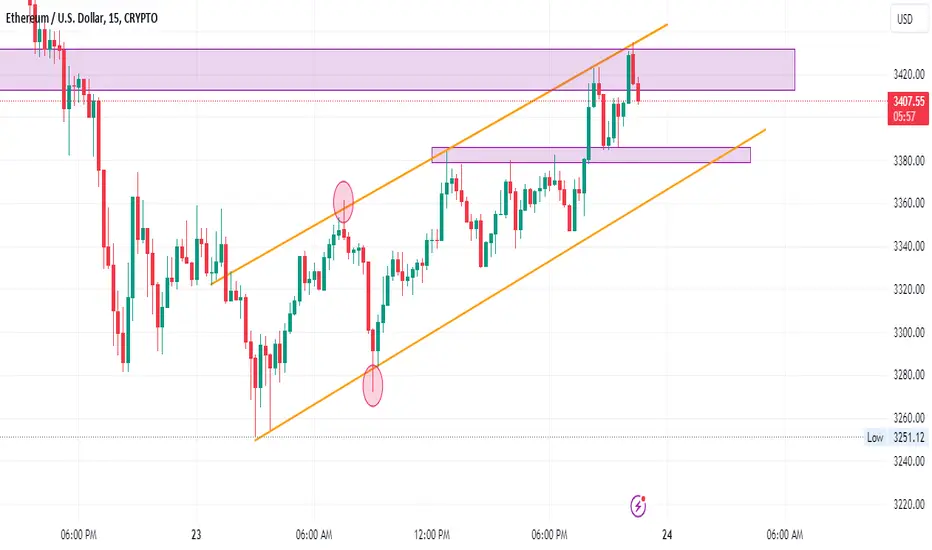
Ethereum is Critical levelEthereum Critical level, Ethereum is at important level and Forming a Channel Pattern Let's see this sustain or not. what is your view please comment it down. We are NISM Certified. All views shared on this channel are my personal opinion and is shared for educational purpose and should not be considered advise of any nature.
#NIFTY Intraday Support and Resistance Levels - 21/09/2023Nifty will be gap down opening in today's session. After opening nifty start trading below 19880 level and then possible downside rally up to 19760 in today's session. in case nifty trades above 19920 level then the upside target can go up to the 20040 level.

Triangle pattern breakout in Havells HAVELLS
Key highlights: 💡⚡
✅On 1Day Time Frame Stock Showing Breakout of triangle Pattern .
✅Strong Bullish Candlestick Form on this timeframe.
✅It can give movement up to the Breakout target of 1435+.
✅Can Go short in this stock by placing a stop loss below 1295-.

Double Bottom pattern breakout in LAURUSLABSLAURUS LABS
Key highlights: 💡⚡
✅On 1Hour Time Frame Stock Showing Breakout of Double Bottom Pattern.
✅ Strong Bullish Candlestick Form on this timeframe.
✅It can give movement up to the Breakout target of 410+.
✅Can Go Long in this stock by placing a stop loss below 390-.

Falling wedge pattern breakout in BALKRISINDBALKRISHNA INDUSTRIES
Key highlights: 💡⚡
✅On 1Day Time Frame Stock Showing Breakout of Falling wedge Pattern .
✅ Strong Bullsih Candlestick Form on this timeframe.
✅It can give movement up to the Breakout target of 2430+.
✅Can Go Long in this stock by placing a stop loss below 2345-.

head and shoulder pattern in TATACONSULTANCYTATA CONSULTANCY SERVICES
Key highlights: 💡⚡️
✅On 1Hour Time Frame Stock Showing Breakout of head and shoulder pattern.
✅ Strong Bullish Candlestick Form on this timeframe.
✅It can give movement up to the Breakout target of 3370+.
✅Can Go short in this stock by placing a stop loss above 3220-

Parallel Channel Pattern Breakout in HEROMOTOCORP HEROMOTOCORP LTD
Key highlights: 💡⚡
✅On 1Week Time Frame Stock Showing Breakout of Parallel channel Pattern .
✅ Strong Bullsih Candlestick Form on this timeframe.
✅It can give movement up to the Breakout target of 3615+.
✅Can Go Long in this stock by placing a stop loss below 2725-.

Bullish flag pattern breakout in CANFINHCANFIN HOMES
Key highlights: 💡⚡
✅On 1 Hour Time Frame Stock Showing Breakout of Bullish flag Pattern .
✅ Strong Bullish Candlestick Form on this timeframe.
✅It can give movement up to the Breakout target of 855+.
✅Can Go short in this stock by placing a stop loss below 772-.

Rising Wedge Pattern Breakout in ULTRATECHCEMENTULTRATECH CEMENT
Key highlights: 💡⚡
✅On 1 Week Time Frame Stock Showing Breakout of Rising wedge Pattern .
✅ Strong Bullish Candlestick Form on this timeframe.
✅It can give movement up to the Breakout target of 9660+.
✅Can Go Long in this stock by placing a stop loss below 7350-.

Inverted head and shoulder | ERISinverted head and shoulders pattern formation in stock
price is resisting at neck line of head and shoulder pattern once price breaks this resistance of supply zone price expected to move upward
Stock successively running in down trend making lower higher and lower lows
but here trend is trying to change where it created peak of low and reverse back and again try down attempt but its over in small move price changes to up side and creating higher high and higher lows
this is how head and shoulder formation created.
Price down by 5 times when it comes to supply zone but this time at supply zone price not getting down but also sustaining at it higher level so we can see buyers are winning over sellers will see breakout once price breaks the blue zone drawn on chart

[INTRADAY] #BANKNIFTY PE & CE Levels(09/06/2023) Today will be gap up opening in BANKNIFTY . After opening if banknifty sustain above 44050 level then possible upside rally of 400-500 points upto 44450 Level. Any Major downside only expected in case banknifty starts trading below 43950 level. also possible Reversal Downside 44450 level.

#NIFTY Intraday Support and Resistance Levels - 30/05/2023Nifty will be gap up opening in today's session. After opening nifty sustain above 18630 level and then possible upside rally up to 18750 in today's session. in case nifty trades below 18590 level then the downside target can go up to the 18480 level.

Pennant Pattern Breakout of Aarti Industries LtdAarti Industries Ltd
Key highlights: 💡⚡
✅On 30 Minutes Time Frame Stock Showing Breakout of Pennant Pattern .
✅ Strong Bullish Candlestick Form on this timeframe.
✅It can give movement up to the Breakout target of 528+.
✅Can Go short in this stock by placing a stop loss below 505-.

Paytm - Uptrend Will Start With Post Earning Reaction?- Near Double Bottom Neckline Breakout
- Above 50/ 200 Ema ( Beginning Of Uptrend)
- 730/750 Strong Supply Zone
Closing Above 740
Will Lead Rally Towards 830/940
- Forming One Hit Wonder IPo Pattern
- Narrowing Losses Improvment In Q4 Result

SUNPHARMA>1000?BUY - SUN PHARMACEUTICALS
CMP - Rs. 957
Target - 1: Rs. 1000
Target - 2: Rs. 1121
.
.
.
Technicals - Navarro 200 Harmonic Pattern
.
Comment: Stock is currently in consolidation.
.
Follow me for more!


AXIS BANK - DAY CHART - 08.12.2022 - BAHAVAN CAPITALAXIS BANK as per day chart analysis Stock ABOVE 943 TARGET 953
FII Net selling at 1131.67 Cr and DII Net Buying at 772.29 Cr. As such FII are in selling mode and need to wait watch for next week.
Had Posted on 07.12.2022 for the stocks HIKAL, FACT, GUJARAT AMBUJA EXPORTS, GOKUL AGRO RESOURCES & ITC and among these ITC never went to our entry price and rest all stocks have HIT the TARGET. Iam glad most of the targets had showed good movement.
Happy Profitable trading to all...

Reliance Daily ChartHi Viewer,
Hope you are doing well. This is my own analysis for Reliance in 1D tf.
Levels are drawn. Please have a look.
Please Note: I am not a SEBI advisor.
Thanks.
