Jindal Steel & Power Limited - Breakout Setup, Move is ON...#JINDALSTEL trading above Resistance of 1157
Next Resistance is at 1567
Support is at 892
Here are previous charts:
Chart is self explanatory. Levels of breakout, possible up-moves (where stock may find resistances) and support (close below which, setup will be invalidated) are clearly defined.
Disclaimer: This is for demonstration and educational purpose only. This is not buying or selling recommendations. I am not SEBI registered. Please consult your financial advisor before taking any trade.
Chartanalysis

BLUESTARCO 1 Day Time Frame 🔹 Current Price (latest session)
• ~₹1,880.9 – ₹1,880 range (latest live price on 6 Feb 2026) — price fluctuated between ~₹1,834–₹1,886 during the session.
📊 Daily Pivot & Levels (Classic Pivot Style)
Pivot Point (PP): ~ ₹1,817–₹1,818
Resistance:
• R1: ~ ₹1,869 – ₹1,899
• R2: ~ ₹1,918 – ₹1,951
• R3: ~ ₹1,951 – ₹1,995
Support:
• S1: ~ ₹1,786 – ₹1,824
• S2: ~ ₹1,768 – ₹1,815
• S3: ~ ₹1,732 – ₹1,796
📌 What This Implies (Daily Price Action)
Bullish bias if price stays above pivot (~₹1,817):
▪ Break above R1 ~₹1,869–₹1,899 → stronger upside momentum
▪ Sustained moves above R2 ~₹1,918–₹1,951 → further strength
Bearish or corrective pressure if price drops below pivot:
▪ Slide below S1 ~₹1,786–₹1,824 → watch S2 & S3 as deeper supports
▪ Breach of S2/S3 zones suggests weakening of daily structure
📌 Note: These levels are approximate and slightly vary across data providers. Always confirm with live charts from your trading platform before placing trades or orders.

RELIANCE 1 Month Time Frame 📌 Latest Trading Price (market close Feb 6 2026): ₹1,450.85 on NSE/BSE.
📈 Key Resistance Zones (Upside)
₹1,455–₹1,460 — immediate technical resistance (pivot cluster)
₹1,470–₹1,480 — next barrier above recent highs seen in early Feb price swings
~₹1,500 — psychological resistance (round number) — watch if momentum sustains
Bullish scenario: Break and hold above ~₹1,460–₹1,470 with decent volume could point toward ₹1,480–₹1,500 next.
📉 Key Support Levels (Downside)
₹1,440–₹1,442 — first support cluster from pivots
₹1,430–₹1,435 — deeper near-term support if current level breaks
₹1,380–₹1,390 — broader monthly lower support (recent swing lows)
Bearish risk: A sustained close below ₹1,430 may shift bias lower toward ₹1,380.
📌 Quick Practical Summary
Levels to watch this month (chart/time-frame sensitive):
• Buy/Support:
₹1,440–₹1,442 (first line)
₹1,430–₹1,435 (next support)
₹1,380–₹1,390 (deeper zone)
• Sell/Resistance:
₹1,455–₹1,460 (initial resistance)
₹1,470–₹1,480 (secondary area)
₹1,500+ if strong break above

MUTHOOTFIN 1 Week Time Frame 📊 📍 Current Weekly Price Context
• Current price (recent trade close) is around ₹3,704.20.
🔹 KEY WEEKLY LEVELS (Support & Resistance)
📈 Weekly Resistance Levels — possible upside barriers where selling pressure could appear:
R1: ~₹3,805–₹3,810 — first major resistance zone.
R2: ~₹3,830–₹3,880 — next higher resistance.
R3: ~₹3,900+ — extended resistance from recent highs.
📉 Weekly Support Levels — zones that can act as buyers on dips:
S1: ~₹3,740–₹3,750 — first support.
S2: ~₹3,690–₹3,700 — secondary support.
S3: ~₹3,650–₹3,670 — deeper buyer interest area.
📌 Weekly Pivot (Mid-Point): ~₹3,770–₹3,775 — key pivot that often acts as dynamic support/resistance on weekly TFs.
📅 HOW TO USE THESE WEEKLY LEVELS
Bullish Scenario:
A weekly close above ₹3,805–₹3,810 increases the probability of an extension toward the higher resistance zones around ₹3,830–₹3,880+.
Neutral / Range:
Price oscillation between ₹3,740–₹3,830 suggests consolidation on the weekly chart — until breakout or breakdown volume confirms direction.
Bearish Scenario:
A sustained break below ₹3,740 could expose deeper supports around ₹3,690–₹3,670 on the weekly view.
📌 Note: These are purely technical reference levels from common weekly pivot/resistance frameworks on Indian stock charts — not investment advice. Always combine with volume, trend indicators (e.g., RSI/MACD) and risk management for your strategy.

PATANJALI 1 Day Time Frame 📌 Current price context (recent daily close): ~₹520–₹525 per share range.
🔁 Daily Pivot Levels & Key Zones
Daily Pivot Point
Daily Pivot (central) ~ ₹519–₹522 — this is the average of the prior day’s range; above this suggests bullish bias, below suggests bearish bias on the day.
Resistance Levels (Upside Targets)
R1: ~ ₹525–₹527 — first resistance turnaround zone.
R2: ~ ₹527–₹530 — next barrier if price sustains above R1.
R3: ~ ₹530+ — higher breakout level in strong buying conditions.
Support Levels (Downside Holds)
S1: ~ ₹511–₹513 — first intraday support zone.
S2: ~ ₹507–₹508 — deeper pullback support.
S3: ~ ₹504–₹505 — more significant zone where buyers could re-enter.
📈 Interpretation for Today’s Trading
Bullish bias intraday if price stays above the pivot (~₹520).
Break and hold above R1–R2 could signal continuation toward R3.
Break below S1–S2 suggests risk of short-term pullback deeper toward S3.
RSI and moving averages can confirm momentum but are secondary to listed levels.
⚠️ These are informational pivot/level estimates based on recent data and common pivot calculations — not buy/sell recommendations.

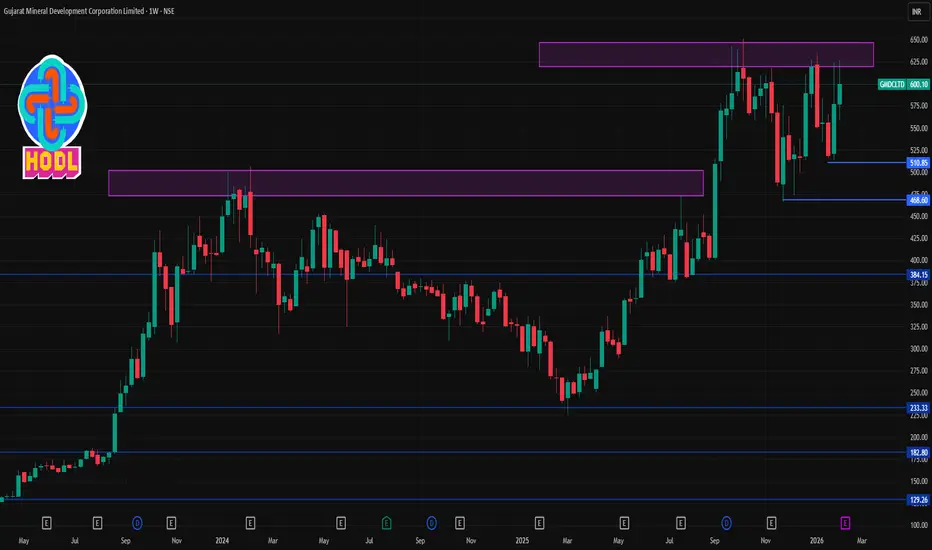
GMDCLTD 1 Week Time Frame 📌 Current Price Snapshot (as of latest trade)
GMDCLTD price (NSE/BSE): ~₹600.1 — stock recently traded around ₹594–₹615 range during the session.
• 52-week high: ~₹651
• 52-week low: ~₹226.59
This places the stock well above its 52-week low and closer to recent highs, showing resilience on the weekly timeframe.
📊 Key Weekly/Short-Term Levels
🔹 Resistance (Upside Targets)
These are potential price ceilings where sellers might step in on a short-term bounce.
R1: ~₹626–₹628
R2: ~₹638–₹640
R3: ~₹650–₹661
A sustained weekly close above ~₹626 would be needed to affirm short-term bullish momentum. Breaking above ₹640+ opens room toward the recent ATH zone.
🔸 Support (Downside Floors)
These are key floors where the price may find buying interest if it dips.
S1: ~₹602
S2: ~₹573–₹575
S3: ~₹560
If price breaks below ₹602–₹590, watch ₹575/₹560 as deeper short-term supports. Sustained price above ~₹600 favors range support.
📌 Practical Levels for 1-Week Trading Window
Bullish scenario (buyers dominant):
➡ Price holds above ₹602–₹608 and moves toward ₹626–₹638 resistance.
Neutral / consolidation:
➡ Price oscillates between ₹590–₹620.
Bearish scenario (sellers dominant):
➡ Breaks below ₹602 and targets ₹575 / ₹560 zones.
Gold Faces Strong Selling PressureGold came under heavy selling pressure after failing to break above the 5,100 USD level overnight and subsequently falling below 4,900 USD during today’s trading session.
The US dollar climbed to its highest level in two weeks and appears to be extending its recent solid recovery from a four-year low, which is adding notable downside pressure to the precious metal.
In addition, the current corrective move is still struggling, as price remains below the trendline. As long as this trendline—and more importantly the recent high at 5,100 USD—is not convincingly broken, the path of least resistance remains to the downside.
What’s your view? How do you see the next move for OANDA:XAUUSD ?

NTPC 1 Day Time Frame 📌 Current Price (approx): ₹367–₹368 on NSE (today’s trading)
📊 Daily Pivot Levels (Key Reference Area)
These are calculated from recent price action & help identify where price may stall or bounce:
Central Pivot / CPR: ~₹364–₹365 (major reference)
Resistance (Upside Levels):
R1: ~₹371
R2: ~₹375
R3: ~₹382+
Support (Downside Levels):
S1: ~₹360
S2: ~₹353
S3: ~₹349
(Standard pivot model)
Daily EMA/SMA key zones:
20-day EMA ~₹347
50-day SMA ~₹339
100/200 day ~₹336-338
(These averages act as dynamic support/resistance)
🚀 Price Action Levels
📌 Immediate Resistance
First upside test: ₹370–₹372
Secondary upside: ₹375–₹378
Breakout zone: above ₹380 (short-term bullish continuation)
📉 Immediate Support
First support: ₹360–₹362
Next support: ₹353–₹355
Deeper support: ₹348–₹350
If price holds above pivot (~364–365) → short-term bullish bias. If it breaks below S1 (~360) → watch S2/S3 zones for stronger supports.
📈 Trend Context (Daily)
✔ Current price is trading above key medium-term moving averages (20/50/100/200 day), signalling bullish trend on daily charts.
✔ RSI levels and momentum indicators generally are neutral to slightly bullish — suggesting strength near current price zone but watch for overbought conditions.
How to use these levels
🔹 Bullish view (long positions):
– Entry if price breaks and holds above R1 (~₹371)
– Targets near R2 (~₹375) and R3 (~₹382+)
– Stop-loss below pivot (~₹364)
🔹 Bearish view (short positions or pullback):
– Look for rejection near R1/R2
– First target near S1 (~₹360)
– Deeper bearish target near S2 (~₹353)

INDUSTOWER 1 Day Time Frame 📌 1-Day Time Frame Levels (Daily Support & Resistance)
(These are typical pivot / intraday key levels traders watch)
Central Pivot (Pivot Point / CPR): ~ ₹421–₹422
Immediate Resistance Levels:
• R1: ~ ₹425–₹430
• R2: ~ ₹431–₹437
• R3: ~ ₹443–₹447
Immediate Support Levels:
• S1: ~ ₹415–₹417
• S2: ~ ₹411–₹414
• S3: ~ ₹405–₹408
(These pivot levels help gauge intraday bullish/bearish bias)
🧠 How to Interpret These Daily Levels
✔ If price stays above the pivot (~₹421–₹422) → bias is bullish for the day.
✔ A breakout above ₹430–₹437 may target higher resistances (~₹443+).
✔ A break below ~₹415–₹414 support could open the path toward lower supports (~₹405).
✔ Price oscillating between ~₹414 and ~₹422 is likely range-bound / choppy.
📊 Alternate/Additional Daily Levels (Trend Zones)
Some recent pivot-based grids suggest:
• First resistance: ~ ₹433–₹438
• Second resistance: ~ ₹438–₹443+
• Support zones: ~ ₹422–₹417, then ₹412–₹405 below that.

RECLTD 1 Day Time Frame 📍 Current Price (approx): ₹380–₹382 on NSE today (traded between ₹369.5–₹386.5 earlier) — price varies by source but this is the latest range.
📈 Daily Technical Levels (1-Day Timeframe)
🔁 Pivot & Reference
Daily Pivot Point: ~ ₹378–₹382 — central reference for bullish/bearish bias.
🟢 Resistance Levels
These are price zones where upside may face selling pressure:
R1: ~ ₹383–₹386 — first key resistance.
R2: ~ ₹390–₹397 — next resistance zone.
R3: ~ ₹400–₹402+ — extended resistance if trend continues up.
🔴 Support Levels
These are levels where price may find buying support in a pullback:
S1: ~ ₹378–₹379 — immediate support near pivot area.
S2: ~ ₹374–₹375 — deeper support zone.
S3: ~ ₹367–₹368 — secondary lower support.
📊 Short-Term Bias Interpretation (Daily View)
Bullish if:
✔ Price stays above the pivot (~₹378–₹382) and clears R1 (~₹383–₹386) — next upside towards R2 (~₹390+).
Neutral / Consolidating if:
↔ Price moves sideways around pivot without breakout — chop likely.
Bearish if:
✔ Price breaks below S1 (~₹378) — could test S2 (~₹374) and S3 (~₹367–₹368).
📌 Quick Summary (Daily)
Level Price (Approx)
Pivot (PP) ~₹378–₹382
Resistance 1 (R1) ~₹383–₹386
Resistance 2 (R2) ~₹390–₹397
Resistance 3 (R3) ~₹400–₹402+
Support 1 (S1) ~₹378–₹379
Support 2 (S2) ~₹374–₹375
Support 3 (S3) ~₹367–₹368
Note: These are daily pivot-based levels for short-term view. Price action can differ intraday due to volatility.

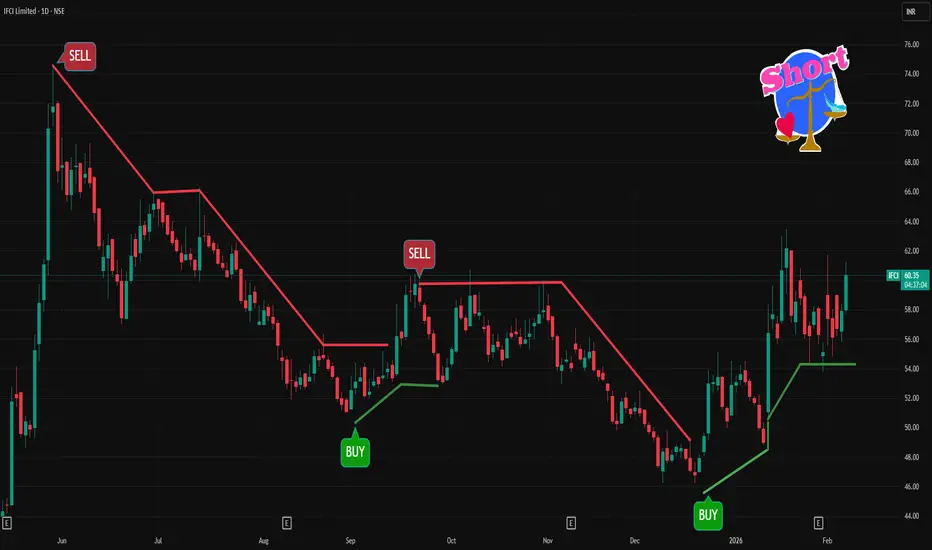
IFCI 1 Day Time Frame 📊 Current Live Price (Approx)
• IFCI trading around ₹57-₹60 range today on NSE/BSE (price fluctuates intraday).
✅ 1-Day Pivot & Key Levels
These are calculated based on recent price action and used by traders for intraday/short-term decisions:
Daily Pivot (PP): ~ ₹56.33 – ₹56.93
Resistance Levels:
R1: ~ ₹57.86 – ₹58.45
R2: ~ ₹59.06 – ₹60.14
R3: ~ ₹60.98 – ₹61.55
Support Levels:
S1: ~ ₹54.61 – ₹55.80
S2: ~ ₹53.08 – ₹53.68
S3: ~ ₹49.83 – ₹49.83 (deeper support)
📌 Ranges vary slightly by pivot calculation method (Classic, Fibonacci, Camarilla), but the zones above reflect current intraday technical consensus.
📌 How Traders Use These Levels (Daily View)
Bullish view:
• A sustained break above R1/R2 (~₹58-₹60) suggests strength and possible move toward R3 (~₹61+).
• Above pivot (~₹56-₹57) indicates bullish bias for the day.
Bearish view:
• A break below S1 (~₹54.6-₹55) can lead toward S2 (~₹53) and lower support.
• Below pivot signals downside pressure first.
🧠 Important Notes
• These levels are intraday technical references, not fundamental buy/sell calls.
• Markets and prices change minute-to-minute — use live quotes from your broker or trading platform.
• Combine pivot zones with volume, candlestick patterns, and trend indicators for better signals.
DIVISLAB 1 Week Time Frame 📌 Current Price Snapshot (latest)
Latest traded price around ₹6,056 – ₹6,056.50 (NSE) in early Feb 2026.
📈 Weekly Support & Resistance Levels (1-Week Time Frame)
📊 Key Levels for This Week (approx based on technical forecasting):
Level Type Price Level (₹)
Strong Resistance 3 (R3) ~6,496.8
Resistance 2 (R2) ~6,377.2
Resistance 1 (R1) ~6,194.3
Current Box Top Level (upper range) ~6,496
Support 1 (S1) ~5,891.8
Support 2 (S2) ~5,772.2
Strong Support 3 (S3) ~5,589.3
➡️ This implies the expected weekly trading range is roughly ₹5,590 – ₹6,495 if the stock remains within normal price swings this week.
🔍 Short-Term Technical Context
Price currently below many key moving averages (5, 10, 20 SMA etc.) indicating bearish bias in short term.
Momentum indicators like RSI and MACD show neutral to bearish positioning, suggesting limited upside unless buyers step in strongly.
📌 How To Use These Levels
Bullish trigger levels:
✔ Above ~₹6,194 (R1) — short-term upside bias
✔ Above ~₹6,377 (R2) — stronger bullish sentiment this week
Bearish trigger levels:
🔻 Below ~₹5,891 (S1) — indicates selling pressure
🔻 Below ~₹5,772 (S2) — more downside risk
📌 Summary Weekly View
Expected trading range this week: ₹5,590 – ₹6,495
Near-term resistance: ~₹6,194 → ~₹6,377
Near-term support: ~₹5,891 → ~₹5,772 (secondary)
📍 All levels are based on technical forecasts and pivots — not guaranteed — and actual price action may vary with market conditions.

IREDA 1 Week Time Frame 📌 Current Price Snapshot
👉 Latest available price data shows IREDA trading around ~₹130–₹135 on the NSE (end of January 2026) — this serves as the baseline for weekly levels.
📈 Weekly Technical Levels (Key Zones)
🚧 Weekly Resistance Levels (Upside)
Level Significance
₹136–₹138 Near‑term resistance — first obstacle for bulls this week.
₹138–₹140 Secondary resistance — key short‑term range top.
₹145–₹150 Major weekly resistance zone — breakout above this signals strength.
🛑 Weekly Support Levels (Downside)
Level Significance
₹130–₹131 Immediate weekly support area — crucial for holding near current price.
₹126–₹127 Secondary support — next cushion if price slips.
₹122–₹123 Strong support zone below — potential downside limit this week.
📉 Weekly Outlook Structure
Bullish Scenario
✅ If price closes above ~₹138–₹140 on the weekly chart → next upside target becomes ₹145–₹150. Continued strength above ₹150 would target even higher levels.
Bearish Scenario
❌ A weekly close below ~₹130–₹127 → opens the door to deeper support at ₹122–₹123.
📊 Momentum & Indicators
RSI near lower area suggests mild bearish momentum (not oversold yet).
The stock remains below key medium/long‑term EMAs, indicating ongoing downward bias unless a strong breakout occurs.
📌 Summary – Weekly Levels to Watch
Bullish Break Points
🔹 First Resist: ₹136–₹138
🔹 Next Resist: ₹138–₹140
🔹 Major Resist: ₹145–₹150
Bearish Support Points
🔸 First Support: ₹130–₹131
🔸 Next Support: ₹126–₹127
🔸 Strong Support: ₹122–₹123

GODREJPROP 1 Day Time Frame 📍 Latest Price (approx):
Around ₹1,680–₹1,714 range in today’s trading session (price varies through the day).
📊 1‑Day Time Frame Levels (Daily Pivot & S/R Zones)
🔹 Pivot / Mid Reference
Pivot Point: ~ ₹1,590–₹1,610 (central reference for bias) — classic DR pivot.
📈 Daily Resistance Levels
Levels above current price where selling pressure may show:
R1: ~ ₹1,620–₹1,630 (1st resistance)
R2: ~ ₹1,670–₹1,680 (2nd resistance)
R3: ~ ₹1,720–₹1,745 (3rd/higher resistance)
👉 If price breaks and holds above R2/R3 with volume, bullish continuation may occur.
📉 Daily Support Levels
Levels below current price where buyers may step in:
S1: ~ ₹1,508–₹1,520 (1st support)
S2: ~ ₹1,487–₹1,495 (2nd support)
S3: ~ ₹1,455–₹1,460 (3rd support)
👉 A drop below S1/S2 could signal further near‑term weakness.
🧠 How to Read These Levels
Above Pivot / R1: Bias turns bullish intraday.
Below Pivot / near S1: Bears may control short term.
Breakout levels: Taking out the R3 zone with volume → bullish momentum.
Breakdown zone: Sustained close below S2/S3 → stronger bearish pressure.
📌 Notes
Different providers compute pivots slightly differently (classic, Fibonacci, Camarilla), but the ranges above reflect consensus across recent intraday pivot calculations.
These levels are for intraday/daily trading and not prediction of long‑term trend. Always complement with price action and risk management.

BSE 1 Day Time Frame 📌 Current Price & Daily Range (Live Context)
Estimated current market price: ~₹2,850–₹2,880 (indicative from multiple sources citing latest live price movement).
Today’s daily high/low range: Approx ₹2,793–₹2,929 (observed current session variation).
⚠️ Exact live price can differ by minutes — check your trading platform for exact tick.
📈 1‑Day Pivot & Levels (Daily timeframe)
Classic Pivot Zone:
Pivot Point: ~₹2,647–₹2,663 (key balance level)
Immediate Resistance (Upside Targets):
R1: ~₹2,765–₹2,775
R2: ~₹2,828–₹2,830
R3: ~₹2,940 or higher (extended resistance)
Key Support (Downside Levels):
S1: ~₹2,584–₹2,625
S2: ~₹2,466–₹2,575
S3: ~₹2,403–₹2,537 — major downside pivot safety zone.
👉 Price above pivot generally signals bullish intraday bias; below pivot suggests weakness.
📊 Trend & Momentum (Daily)
Indicators & moving averages:
Price is trading above 20/50/100/200‑day EMAs, indicating a bullish trend on the daily chart.
RSI near neutral‑to‑positive zone (~50), showing room for further continuation before overbought.
This suggests bullish bias on daily timeframe, but resistance zones near ₹2,828–₹2,940 are key to break for sustained upside.
🧠 How to interpret the daily levels today
Bullish scenarios (1‑Day):
✔ Above ₹2,828–₹2,830 — expands move toward ₹2,940+.
✔ Sustained above pivot ~₹2,650+ — retains short‑term bullish structure.
Neutral / consolidative:
➡ Between ₹2,650 – ₹2,828 — range balance, sideways action likely.
Bearish scenarios (1‑Day):
✘ Break below ₹2,584 — could pull toward ₹2,466 / ₹2,403 supports.

SIEMENS 1 Day Time Frame 📌 Current Price (Live/Latest data)
Siemens Ltd trading around ₹3,220 – ₹3,230 in today’s session.
(Note: prices fluctuate continuously during trading hours — these are live approximate levels today.)
📊 Daily Pivot & Key Levels (1‑Day Timeframe)
These are calculated based on the previous trading day’s price range — useful for intraday bias:
✔️ Pivot & Main Levels
Pivot (Central level): ~ ₹3,002 – ₹3,053
Resistance 1 (R1): ~ ₹3,114 – ₹3,134
Resistance 2 (R2): ~ ₹3,178 – ₹3,246
Resistance 3 (R3): ~ ₹3,258 – ₹3,358
Support 1 (S1): ~ ₹2,870 – ₹3,009
Support 2 (S2): ~ ₹2,759 – ₹2,928
Support 3 (S3): ~ ₹2,626 – ₹2,883
📈 How to Interpret Today’s Levels
✅ Bullish scenario:
Price holding above Pivot (~₹3,000–₹3,050) suggests bullish bias.
Sustained move above R1 (~₹3,114) targets higher zones near R2 (~₹3,178) and R3 (~₹3,250+).
❗ Bearish scenario:
Breakdown below Pivot (~₹3,000) can weaken bias.
Drop below S1/S2 (~₹2,870–₹2,928) signals deeper decline nearer S3 (~₹2,626).
📌 Intraday Price Action Today
Intraday range seen ~₹3,160 low to ~₹3,246 high in the ongoing session.
🧠 Market Context
The stock recently traded within a broader range but remains above major pivot and moving average zones, which supports short-term strength.

Nifty Metal - Breakout Setup, Move is ON...#CNXMETAL trading above Resistance of 11523
Next Resistance is at 15060
Support is at 9968
Here are previous charts:
Chart is self explanatory. Levels of breakout, possible up-moves (where index may find resistances) and support (close below which, setup will be invalidated) are clearly defined.
Disclaimer: This is for demonstration and educational purpose only. This is not buying or selling recommendations. I am not SEBI registered. Please consult your financial advisor before taking any trade.

Ashok Leyland Ltd - Breakout Setup, Move is ON...#ASHOKLEY trading above Resistance of 192
Next Resistance is at 289
Support is at 141
Here are previous charts:
Chart is self explanatory. Levels of breakout, possible up-moves (where stock may find resistances) and support (close below which, setup will be invalidated) are clearly defined.
Disclaimer: This is for demonstration and educational purpose only. This is not buying or selling recommendations. I am not SEBI registered. Please consult your financial advisor before taking any trade.

Hindustan Copper Limited - Breakout Setup, Move is ON...#HINDCOPPER trading above Resistance of 602
Next Resistance is at 896
Support is at 458
Here are previous charts:
Chart is self explanatory. Levels of breakout, possible up-moves (where stock may find resistances) and support (close below which, setup will be invalidated) are clearly defined.
Disclaimer: This is for demonstration and educational purpose only. This is not buying or selling recommendations. I am not SEBI registered. Please consult your financial advisor before taking any trade.

INFIBEAM 1 Week Time Frame 📌 Current Price Snapshot
📍 Latest traded price: ₹16.25 – ₹16.30 approx. (last session)
📈 52-week range: ₹13.63 (low) – ₹22.02 (high)
📊 Near-Term 1-Week Technical Levels
🔰 Pivot Point (Reference)
Pivot: ~₹15.6 – ₹15.7 (neutral zone for short-term bias)
🛑 Resistance (Upside Targets)
These are levels where price may face selling pressure this week:
Level Mark (Approx) Notes
R1 ~₹15.8 – ₹16.0 First hurdle near current action zone
R2 ₹16.3 – ₹16.4 Key near-term resistance — breakout above this could add momentum
R3 ₹16.8 – ₹17.0 Next upside target if buyers remain strong
👉 A decisive daily close above ~₹16.4–₹16.5 can open the door toward ₹17.0+ in the week.
🧱 Support (Downside Floors)
These are levels where dips may find buyers this week:
Level Mark (Approx) Notes
S1 ₹15.3 – ₹15.4 First strong support — psychologically key pivot band
S2 ₹15.0 – ₹15.1 Next cushion below if the market weakens
S3 ₹14.8 – ₹14.7 Deeper support zone if selling accelerates
👉 A breakdown below ~₹15.0 would increase bearish pressure for the week.
📈 Short-Term Bias Interpretation
Bullish scenario:
If price holds above ₹15.6–₹15.7 pivot and breaks ₹16.3–₹16.4, the next near-term move could be toward ₹16.8–₹17.0+.
Neutral / range-bound:
Between ₹15.3 and ₹16.3, expect consolidation/trading range.
Bearish scenario:
Sustained trading below ₹15.3 risks weakening into ₹15.0 and lower.
🧠 Quick Trading Guide (1-Week)
📍 Watch for reaction at:
✔ Above ₹16.3–₹16.4 = possible upside extens ion
✔ Below ₹15.3 = risk of deeper pullback
📊 Trend cues: Recent technical indicators show mixed momentum — short-term range with pickup if buyers assert near pivot area.

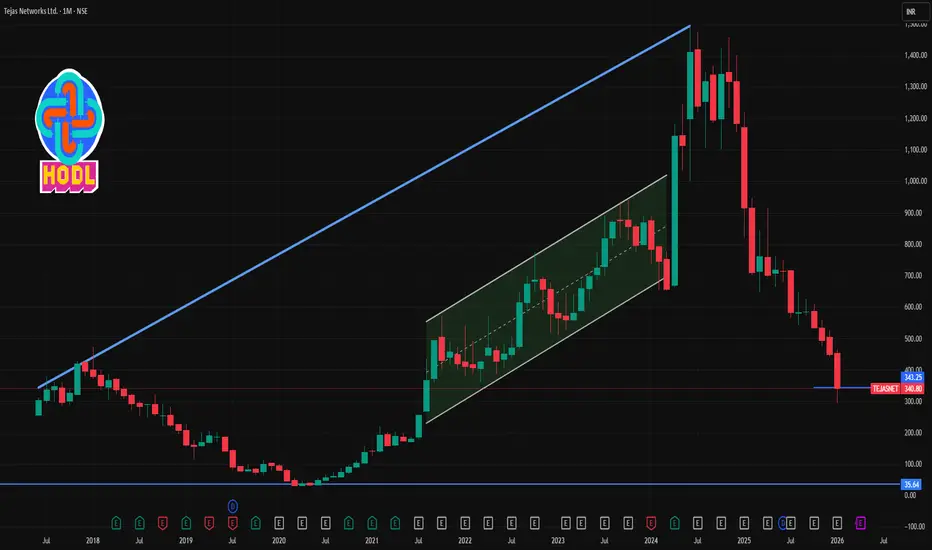
TEJASNET 1 Month Time Frame 📊 Current Price Snapshot (Approx)
Last traded price ~ ₹330-₹345 on NSE/BSE during late Jan 2026, after recent volatility and sell-offs.
📉 1-Month Timeframe — Key Levels
🔻 Support Levels (Downside)
These are levels where the stock could find buyers or pause losses on a 1-month chart:
Support Zone Significance
₹320 – ₹325 Immediate support; recent intraday floor (current price region)
₹301 – ₹315 Secondary support zone from pivot breakdowns
₹285 – ₹300 Deeper support if broader bearish momentum continues
📈 Resistance Levels (Upside)
Resistance Zone Importance
₹355 – ₹360 1st resistance from short-term moving average relevance
₹370 – ₹375 Next resistance cluster near recent intraday reactions
₹390 – ₹395 Higher resistance if bounce gains strength
🧠 Technical Indicator Context (1-Month)
📉 Trend Bias: Bearish overall, price trading significantly below major moving averages (20-day, 50-day, etc.).
📊 RSI: Near oversold but not confirmed bottom — suggests bearish momentum but potential for short-term rebounds.
📉 MACD & STOCH: Bearish signals persist, indicating weak price action on the 1-month chart.
🗂 Summary — 1-Month View
⚠️ Bearish Bias: The stock is in a short-term downtrend, trading below key moving averages and suffering weak momentum.
🛑 Support in Focus: ₹320-₹315 first; further deeper zone near ₹285-₹300 if bears intensify.
📈 Resistance Roadblock: ₹355-₹360 key for initial bounce; stronger rally needs break above ₹370+.
📉 Bearish Technicals: RSI not strongly indicating reversal yet; MACD remains bearish.
AXISBANK 1 Week Time Frame 📊 Current Context (As of 30 Jan 2026)
Last Close: ~₹1,370 – ₹1,378 range.
Recently traded near a 52-week high.
📈 Weekly Resistance Levels
These resistances act as potential upside barriers for the coming week:
R1: ~₹1,317 – ₹1,320 — first resistance zone.
R2: ~₹1,341 – ₹1,342 — next upside.
R3: ~₹1,370+ — major resistance breakout level.
➡️ Bullish scenario: A weekly close above ~₹1,317–₹1,320 increases chances of move toward ₹1,340+ / ₹1,370+.
📉 Weekly Support Levels
Support levels where price may find buying interest if it pulls back:
S1: ~₹1,262 – ₹1,265 — near-term support.
S2: ~₹1,230 — mid-range support.
S3: ~₹1,206 — broader downside buffer.
➡️ Bearish scenario: If the stock closes below ~₹1,262–₹1,265, further downside toward ₹1,230 → ₹1,206 could be possible.
📅 Likely Weekly Trading Range
Neutral / range-bound view:
₹1,262 – ₹1,320 — price may oscillate here unless a strong breakout/breakdown occurs.
📌 Quick Summary
Bullish break levels: above ₹1,317–₹1,320
Immediate upside resistances: ₹1,341 / ₹1,370+
Downside supports: ₹1,262 → ₹1,230 → ₹1,206

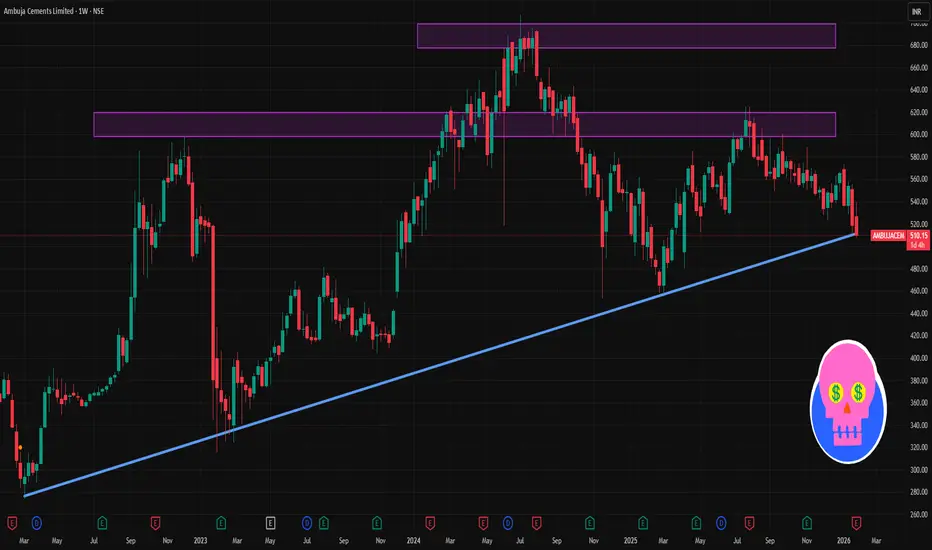
AMBUJACEM 1 Week Time Frame 📊 Current Price Context
The stock has recently traded around ₹510 – ₹536 after earnings‑related volatility.
The 52‑week range is roughly ₹455 (low) to ₹625 (high).
🔁 1‑Week Technical Levels (approx)
Key resistance (levels where sellers may step in):
₹542‑₹545: Near recent pivotal resistance zone.
₹552‑₹558: Secondary resistance cluster short‑term.
Key support (levels where buyers may defend):
₹527‑₹528: Initial support within the week.
₹521‑₹516: Next support zone if the dip extends.
₹500 – ₹495: Stronger longer‑term support if selling intensifies.
📉 Short‑Term Trend & Signal
Technical aggregators rate the stock as weak/neutral to bearish on the 1‑week timeframe — meaning downside risks currently outweigh upside signal.
Price below recent pivot and moving averages suggests bearish short‑term momentum absent close above resistance.
📌 Practical Swing Levels (Simple Guide)
Bullish trigger zone: closing above ₹545‑₹550 on weekly closes could make higher levels nearer ₹560+ possible.
Bearish trigger zone: closing below ₹520 may open path toward ₹500 and deeper.