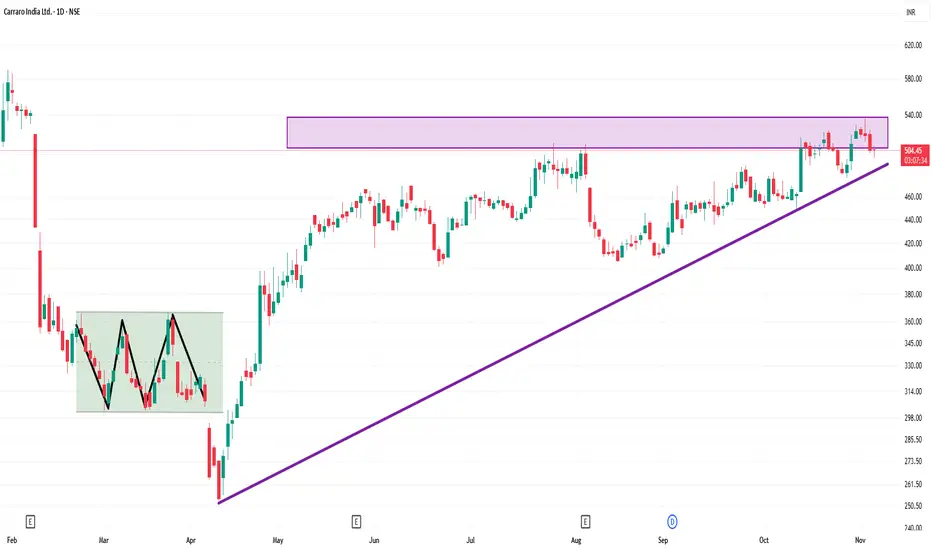
CARRARO 1 Day Time Frame 📍 Key Levels
Resistance ~ ₹523.45 (short term)
Support ~ ₹482.70
Moving averages: 50-day ~ ₹503.79; 200-day ~ ₹484.68
Current price (recent) ~ ₹518.75
Chartanalysis
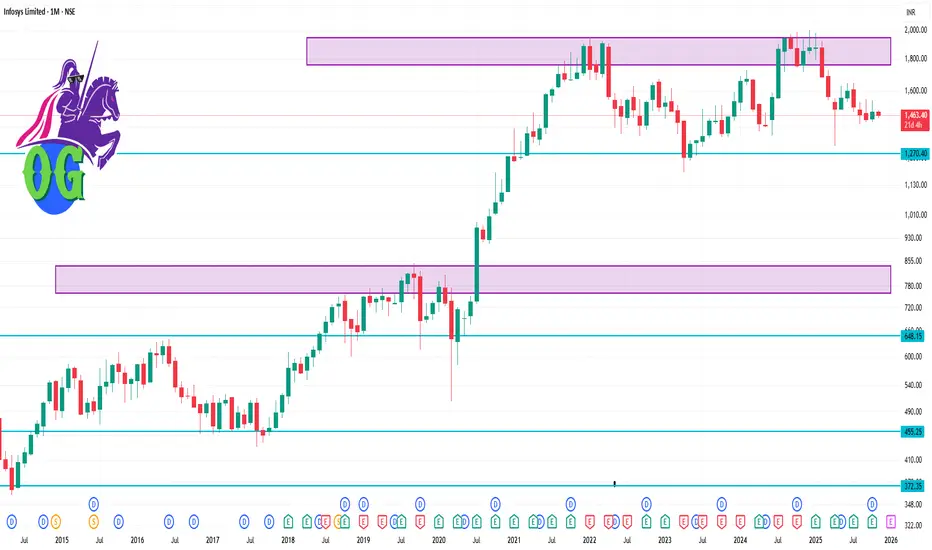
INFY 1 Month Time Frame 📊 Current status
Latest quoted price is around ₹1,466.70.
Technical indicators (daily & monthly) show a bearish bias. On daily, moving averages all give “Sell”.
From chart commentary: Intermediate resistance visible at ~ ₹1,479–₹1,523. Support stated around ~ ₹1,425–₹1,385, and a stronger support zone near ~ ₹1,348 in a deeper break scenario.
🎯 Key levels for the 1-month horizon
Resistance zone: ~ ₹1,479 up to ~ ₹1,523 — clearing this zone would be a positive signal. (see analysis above)
Support zone / trigger zone:
Initial support: ~ ₹1,425–₹1,385.
Deeper support (if breakdown): ~ ₹1,348.
Important pivot region: The current price around ~ ₹1,466–₹1,470 sits between support and resistance — watching whether it breaks down or starts a reversal.
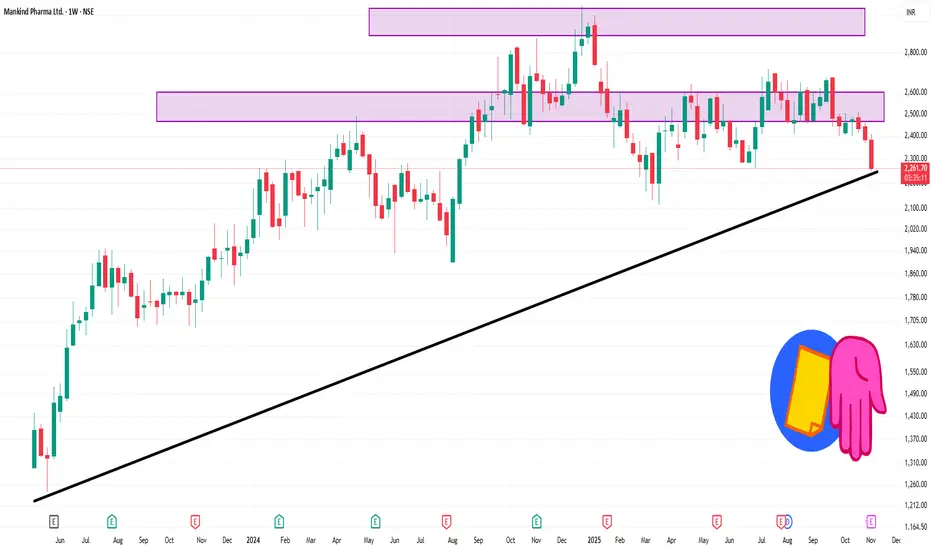
MANKIND 1 Week Time Frame 📌 Key Levels (Weekly Framework)
Support zone: ~ ₹2,287 (a strong weekly support identified)
Next lower support: ~ ₹2,201 (in case of breakdown below primary support)
Resistance zone: ~ ₹2,518 (first major weekly resistance)
Higher resistance area: ~ ₹2,696 to ₹2,937 in a medium‐term context.
🔍 Weekly Outlook & Notes
If price remains above ~₹2,287 and starts building volume/structure, there is upside potential toward ~₹2,518.
If the price breaks below ~₹2,287 decisively on the weekly chart, then watch for further drop toward ~₹2,201.
RADICO 1 Month Time Frame 📌 Current data snapshot
Latest price ~ ₹ 3,220.
52-week range: ~ ₹ 1,845.50 – ₹ 3,423.00.
Technical rating (1-month) on platforms shows “Buy” / “Strong Buy”.
🔍 Key support & resistance for ~1-month horizon
Support zone: ~ ₹ 3,050-3,100 — around current price minus some buffer.
Stronger support: ~ ₹ 2,900-3,000 — if the above zone fails.
Resistance zone: ~ ₹ 3,300-3,350 — near recent highs.
Possible breakout target: > ~ ₹ 3,400 — if it breaks resistance convincingly.
These levels are derived from recent chart data and pivot-analysis (for example, support ~₹3,052.5 seen on one chart).

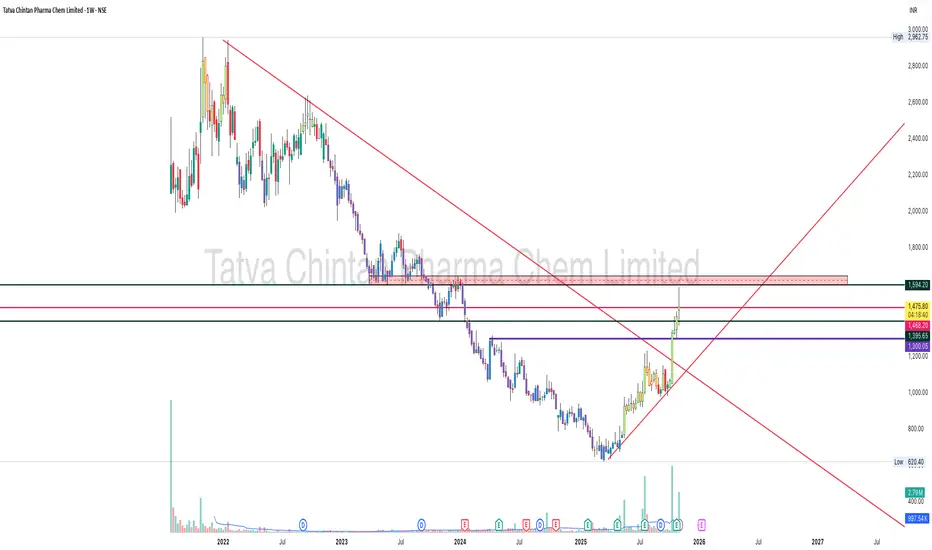
Tatva Chintan #Screener — Trend Reversal Before The CrowdTatva Chintan – Major Trendline #Breakout After Long Downtrend 📈🔥
Tatva Chintan Pharma has broken a multi-year falling trendline, ending a prolonged downtrend phase since 2021.
This breakout is backed by strong price momentum + volume expansion, indicating accumulation and potential reversal into a long-term uptrend.
📌 Breakout Zone: ~₹1350 – ₹1400
📌 Current Price: ~₹1467
📌 Structure: Breakout + retest + continuation
📌 Momentum: Trading above 50 & 200 EMA on weekly 👌
Key Levels
Immediate Resistance:
₹1468 (current zone)
₹1594
Support Zones
₹1395
₹1343
₹1311 (major retest zone)
As long as price sustains above ₹1310-1340 range, bullish structure remains intact ✅
Why This Breakout Matters
✅ Multi-year trendline breach
✅ Higher-lows forming since 2024 bottom
✅ Strong accumulation volume
✅ Pharma sector strength visible
✅ Potential trend reversal from long accumulation base
This kind of pattern often leads to multi-month swing opportunities if trend sustains.
View
Bias remains bullish until structure breaks.
Watching for follow-through above ₹1500 zone for extended upside.
📒 Educational chart analysis — not investment advice.
RBL BANKStock is maintaining the move above all key EMAs, last Swing Low (242.35) took support at 50 exponential moving average, which is a good sign.
Previous resistance is becoming a support, price is consistently taking support above 20ema.
A move from here may give a good upside move.
✅ If you like my analysis, please follow me as a token of appreciation :)
in.tradingview.com/u/SatpalS/
📌 For learning and educational purposes only, not a recommendation. Please consult your financial advisor before investing.

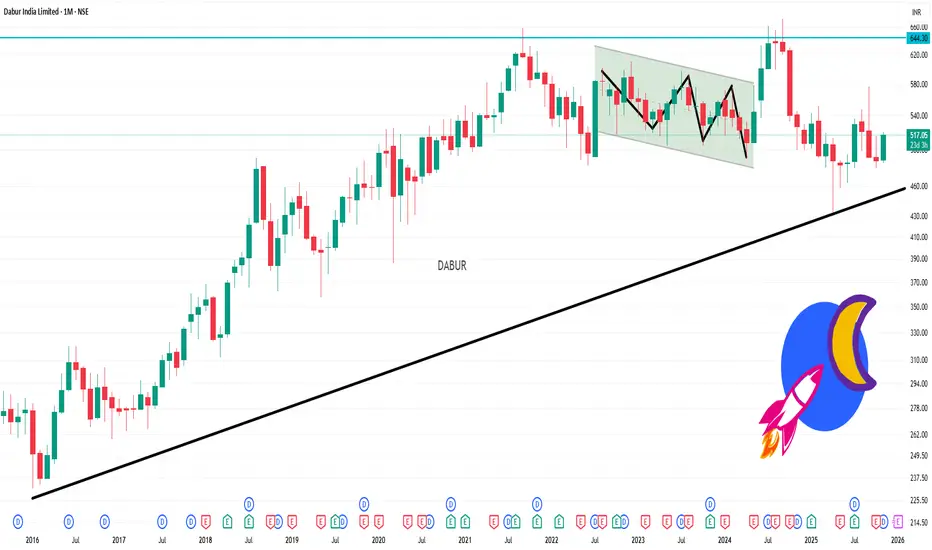
DABUR 1 Month Time Frame 📊 Key Levels to Watch (1-Month horizon)
Based on the technical data:
Major resistance zone: ~ ₹515-₹520 – price has struggled around this level in short term.
Primary support zone: ~ ₹480-₹485 – a level where prior support is noted.
Secondary deeper support: ~ ₹460-₹465 – if weakness persists, this is a lower zone of interest.
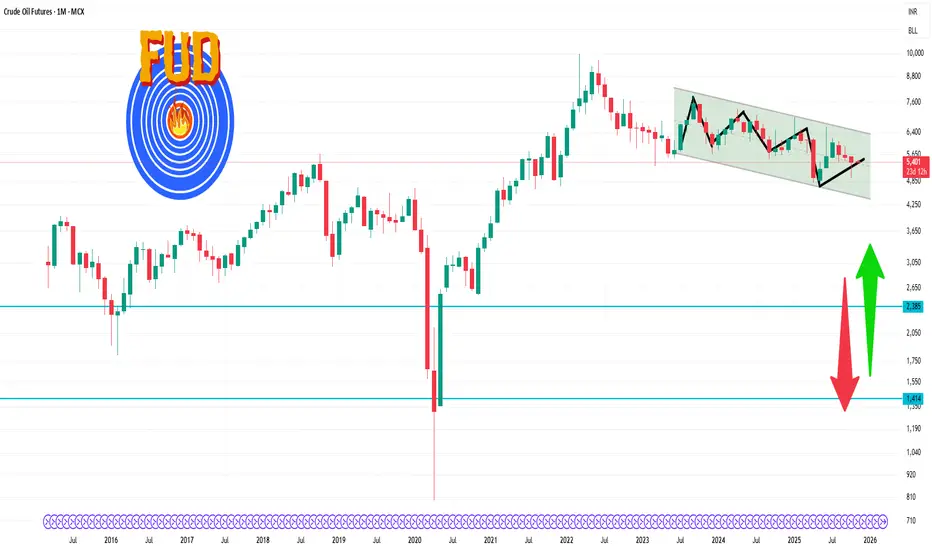
Crude Oil Futures 1 Month Time Frame 🔍 Current Price
Last quoted: ~ ₹ 5,422 per barrel.
Recent 1-month high: ~ ₹ 5,903
Recent 1-month low: ~ ₹ 4,944
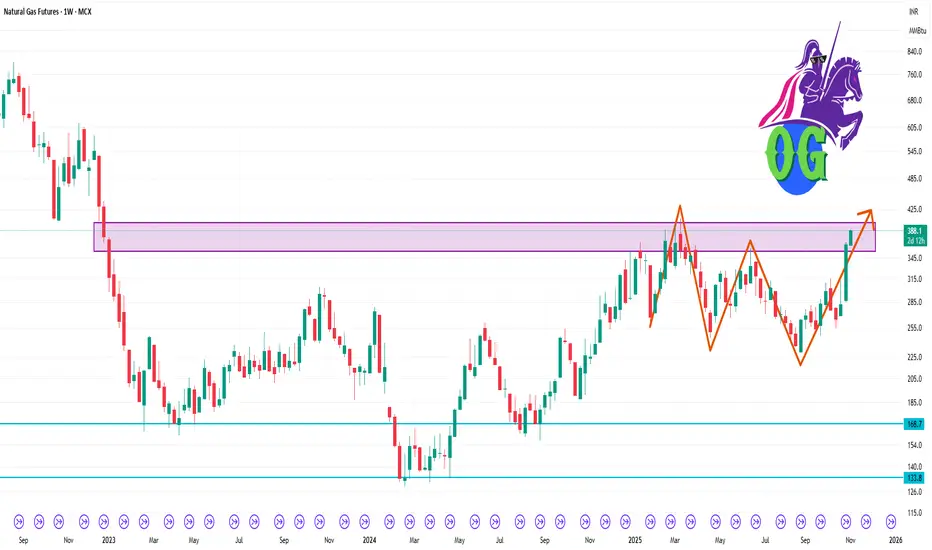
Natural Gas Futures 1 Week Time Frame 🎯 Key Levels
Support zone: ~ ₹ 270-285 per mmBtu — this appears to be a hinge demand zone based on recent pullbacks.
Intermediate support / pivot: ~ ₹ 295-310 — price has been oscillating near this zone.
Resistance zone: ~ ₹ 330-350 — breaking above this on a weekly close would shift structure more bullish.
Major breakout target: ~ ₹ 360-380 — if momentum carries, this zone becomes relevant for extension.
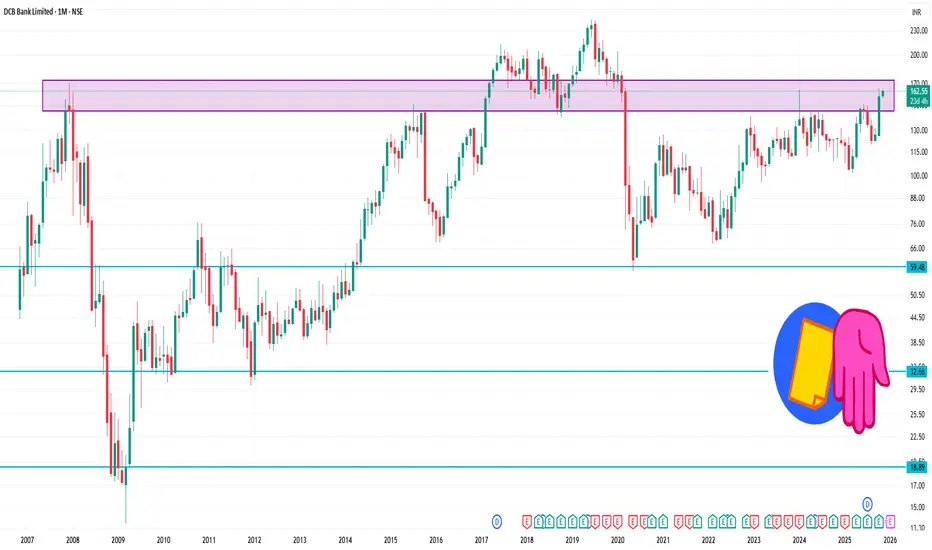
DCBBANK 1 Month Time Frame 🔑 Key Levels
Resistance zone: ~ ₹159–₹162. According to pivot/accumulated-volume data, the stock meets resistance around ₹158–₹161.
Support zone: ~ ₹144–₹150. The analysis mentions support at ~₹144.55 and next level further down ~₹126.45 if that breaks.
Longer-term support: ~ ₹129–₹135. Some medium/long‐term support levels are indicated in this range.
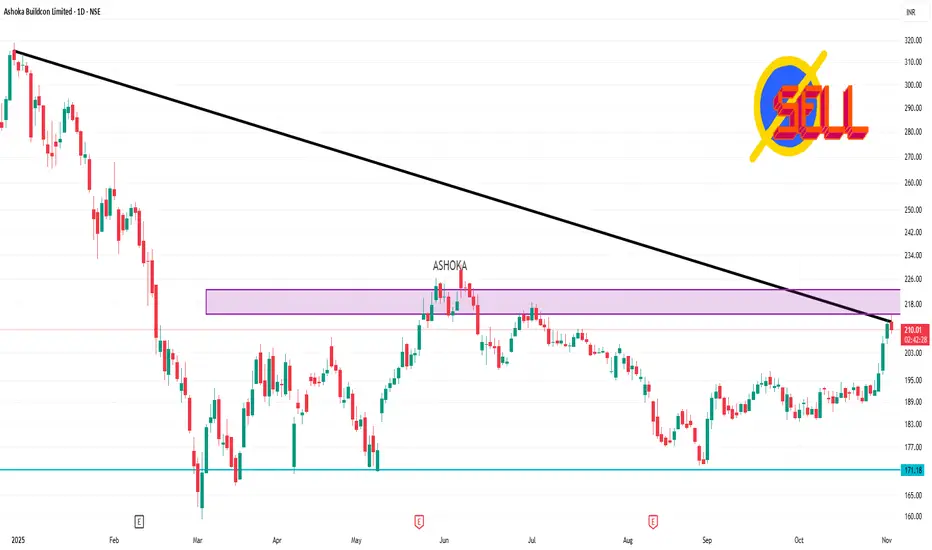
ASHOKA 1 Day Time Frame 📊 Current Context
Latest quoted price: ~ ₹214.86.
Daily technical/oscillator readings: RSI (14) ~ 73.64 → bullish but nearing over-bought territory.
Moving-averages: 5-day ~ ₹199.49; 20-day ~ ₹192.38; 50-day ~ ₹189.35. Price is above all these, which suggests upward momentum.
🎯 Key Levels to Watch (Daily)
From the latest data:
Pivot (classic): ~ ₹210.16.
Resistance levels:
R1 ~ ₹214.66
R2 ~ ₹221.42
Support levels:
S1 ~ ₹203.40
S2 ~ ₹198.90
S3 ~ ₹192.14
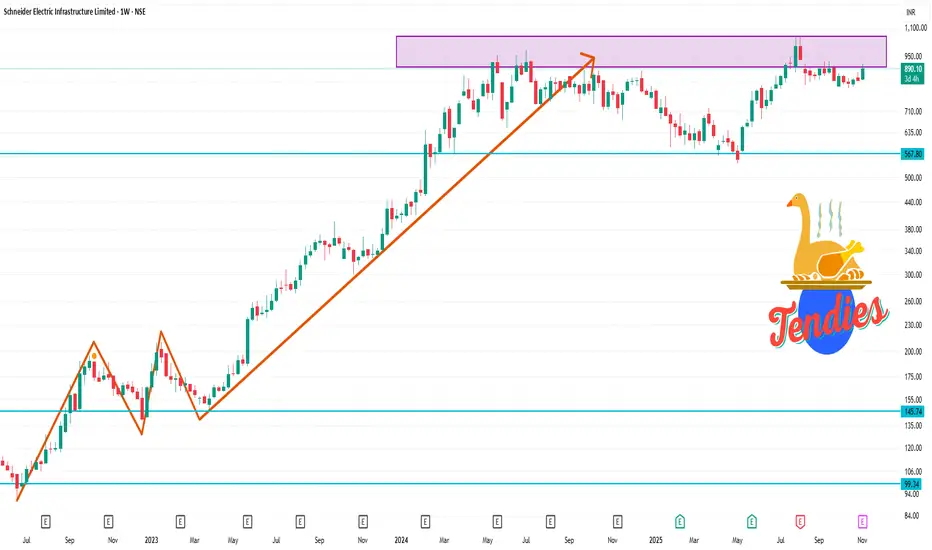
SCHNEIDER 1 Week Time Frame 📊 Current status
Last traded price: ~ ₹863 (shown on technical summary)
Technical rating (weekly timeframe): “Neutral” in many sources.
On shorter timeframes (daily), many indicators show bullish momentum.
🧮 Key support & resistance levels for the week
Based on available chart-analysis:
Support zone: around ₹810-₹830 region.
Resistance zone: around ₹900-₹915 region.
A pivot/resistance level near ~ ₹867-₹870 was noted for shorter term.
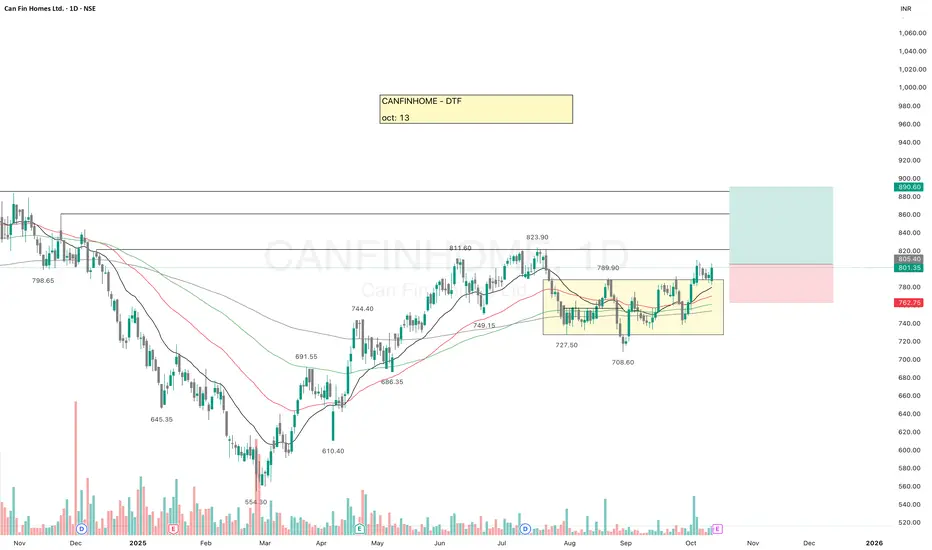
CANFINHOMECANFINHOME has given breakout of the recent resistance.
Looking at a good position, all key EMAs are aligned, if it sustains the move then it may give a good upside move.
There are a couple of resistance points which may become small hurdle in between.
✅ If you like my analysis, please follow me here as a token of appreciation :)
in.tradingview.com/u/SatpalS/
📌 For learning and educational purposes only, not a recommendation. Please consult your financial advisor before investing.
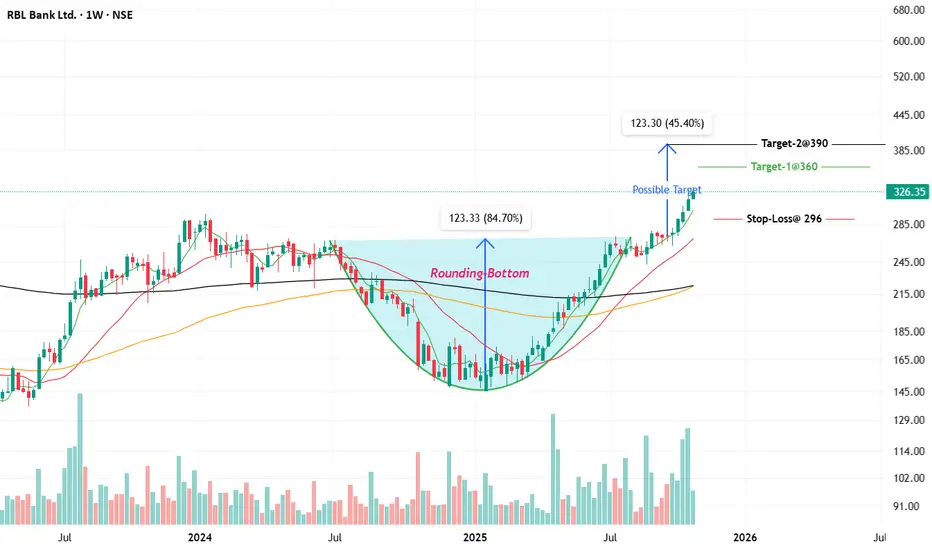
RBL Bank on the Verge: Weekly Chart Signals a Fresh Trend BreakRBL Bank has shown strong bullish momentum in its weekly chart, supported by rising price, strong moving averages, and a robust uptrend. The stock is currently trading near its 52-week high at around ₹326, indicating significant strength in the ongoing trend.
Technical Indicator Analysis
• Price and Trend: The stock has risen over 42% in the past year and over 7% in the last month, supported by strong volume and positive sentiment.
• Moving Averages: The 50-week and 200-week moving averages are sloping upwards, and the price is trading well above both, which is a bullish sign.
• Relative Strength: RSI (implied by the breakout and new highs) likely remains in bullish territory, confirming momentum.
• Support and Resistance: The stock has immediate support near ₹300 and strong resistance is seen at the recent high of ₹331.50.
Chart Pattern and Target
• Pattern Observed: A continuation breakout, possibly following a flag or rounding bottom pattern, is implied. The price action has broken past key resistances, and the trend remains strong.
• Entry Point: New entries can be considered on minor pullbacks toward ₹310-315, or on a weekly close above ₹331.50 for momentum traders.
• Target: Immediate target is the all-time range toward ₹350 . If momentum continues, longer-term targets could be in the ₹380–400 zone, using previous swing projections and extension from current levels.
• Stop Loss: Suggested stop-loss for positional trades is below ₹296 on a closing basis to protect gains and manage downside risk.
Overall, the weekly technical for RBL Bank support a bullish stance with buy-on-dip and breakout strategies, as long as the price remains above the key moving averages and stop-loss.
📌 Thanks a ton for checking out my idea! Hope it sparked some value for you.
🙏 Follow for more insights
👍 Boost if you found it helpful
✍️ Drop a comment with your thoughts below!
HEGDrying volume during the pullback, tight contraction in the stock, EMAs are aligned.
There is probability of an upside move.
✅ If you like my analysis, please follow me as a token of appreciation :)
in.tradingview.com/u/SatpalS/
📌 For learning and educational purposes only, not a recommendation. Please consult your financial advisor before investing.

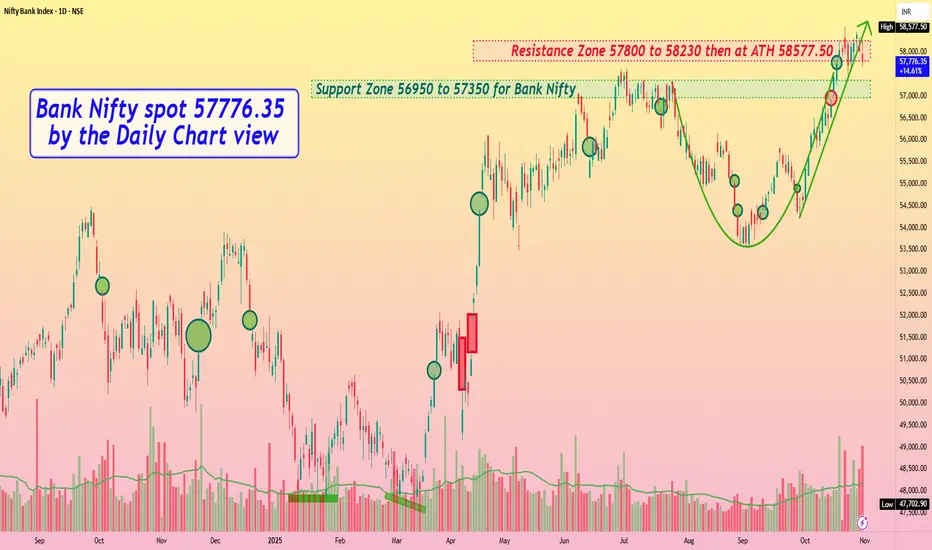
Bank Nifty spot 57776.35 by Daily Chart view - Weekly UpdateBank Nifty spot 57776.35 by Daily Chart view - Weekly Update
- Support Zone 56950 to 57350 for Bank Nifty
- Resistance Zone 57800 to 58230 then at ATH 58577.50
- Bank Nifty sustaining tad below Resistance Zone but above Support Zone
- Rising Support Trendline has been broken and bit of weakness seems prevailing
- Bullish Rounding Bottom seems active but for the sustained skepticism in general
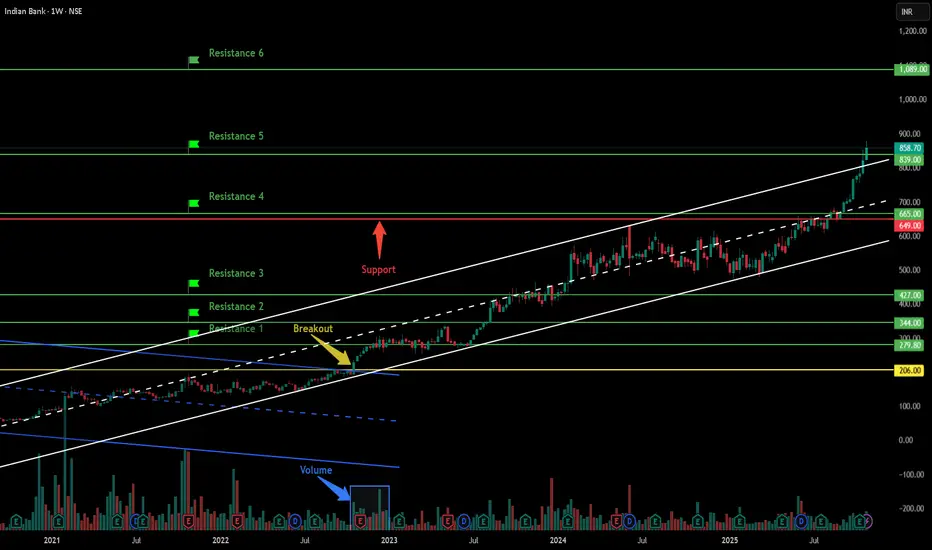
Indian Bank - Breakout Setup, Move is ON...#INDIANB trading above Resistance of 839
Next Resistance is at 1089
Support is at 649
Here are previous charts:
Chart is self explanatory. Levels of breakout, possible up-moves (where stock may find resistances) and support (close below which, setup will be invalidated) are clearly defined.
Disclaimer: This is for demonstration and educational purpose only. This is not buying or selling recommendations. I am not SEBI registered. Please consult your financial advisor before taking any trade.
CANARA BANK BREAKOUTCANARA BANK
ADD ON YOUR WATCHLIST
If you see in the chart, the rounding pattern has broken out and it is in the weekly time frame
You can buy at Rs 125 and go up to the target of 146 and 163. The Stop-loss can be kept at 117.50
Note: Our posts are posted for learning purposes. You are responsible for any profit or loss you make from the advice given in the channel. Before investing in the stock market, you must consult your financial advisor.
WE ARE NOT A SEBI REGISTERED

CANARA BANK ROUNDDING PATERN BREAKOUTCANARA BANK ( W )
ADD ON YOUR WATCHLIST
If you see in the chart, the rounding pattern has broken out and it is in the weekly time frame
You can buy at Rs 125 and go up to the target of 146 and 163. The stop loss can be kept at 117.50
Note: Our posts are posted for learning purposes. You are responsible for any profit or loss you make from the advice given in the channel. Before investing in the stock market, you must consult your financial advisor.
WE ARE NOT A SEBI REGISTERED

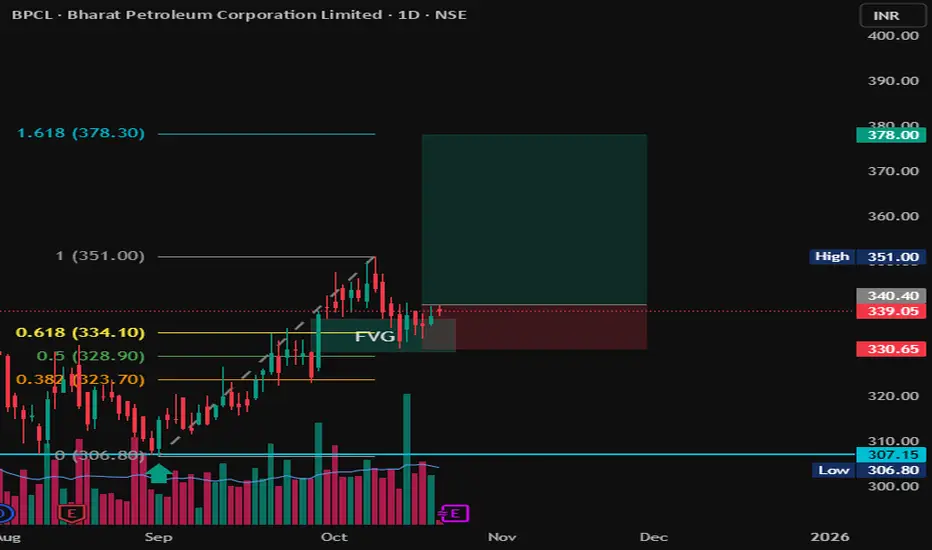
BPCL | FVG + Fibonacci COnfluence | Long Setup toward 378 💬 Description:
Chart Type: 1D (Daily)
Stock: BPCL – Bharat Petroleum Corporation Ltd.
🧩 Setup Overview
BPCL has completed a clean retracement into a Fair Value Gap (FVG) aligning with the 0.5–0.618 Fibonacci retracement zone from the previous upswing (306 → 351).
The zone around ₹334–₹340 acted as strong demand support, hinting at a possible continuation leg to the upside.
📊 Trade Plan
Entry Zone: ₹338–₹340
Stop Loss: ₹330
Target 1: ₹351
Target 2: ₹378 (1.618 Fib Extension)
Risk–Reward Ratio: ~1:3
📈 Technical Confluence
✅ FVG + 0.618 Fib alignment
✅ Retest & bounce confirmation
✅ Volume showing accumulation
✅ Clear higher-low structure maintained
🚨 Invalidation
Setup invalid if price closes below ₹330, which would break FVG and shift structure to bearish.
🧠 Bias: Bullish continuation
Time Horizon: Swing (2–4 weeks)
GRAPHITE - Near 18months old ResistanceGRAPHITE - The market structure looks strongly bullish, and EMAs are perfectly aligned, confirming trend strength.
The stock is now approaching an 18-month-old resistance zone. A breakout above this level could open the door for a solid upside move.
However, it’s important to wait for a retest and proper confirmation before entering, even during paper trading.
Keep it on your watchlist for paper trading.
✅ If you like my analysis, please follow me here as a token of appreciation :)
in.tradingview.com/u/SatpalS/
📌 For learning and educational purposes only, not a recommendation. Please consult your financial advisor before investing.

Stallion India Fluorochemicals Ltd - Breakout Setup, Move is ON#STALLION trading above Resistance of 312
Next Resistance is at 524
Support is at 204
Here are previous charts:
Chart is self explanatory. Levels of breakout, possible up-moves (where stock may find resistances) and support (close below which, setup will be invalidated) are clearly defined.
Disclaimer: This is for demonstration and educational purpose only. This is not buying or selling recommendations. I am not SEBI registered. Please consult your financial advisor before taking any trade.

Stallion India Fluorochemicals Ltd - Breakout Setup, Move is ON#STALLION trading above Resistance of 171
Next Resistance is at 312
Support is at 133
Here is previous chart:
Chart is self explanatory. Levels of breakout, possible up-moves (where stock may find resistances) and support (close below which, setup will be invalidated) are clearly defined.
Disclaimer: This is for demonstration and educational purpose only. This is not buying or selling recommendations. I am not SEBI registered. Please consult your financial advisor before taking any trade.
