Gold Trading Strategy XAUUSD July 31, 2025Yesterday's trading session, after breaking the rising price channel in the 3318 - 3320 area, the gold price fell sharply to the 3269 area.
Basic news: US Treasury yields fell and the weak US labor market report could boost investor demand. Data released by the US Department of Labor on Tuesday showed that the number of new jobs fell in June after 2 consecutive months of increase. Today, the Federal Reserve will announce a new interest rate decision.
Technical analysis: The rising price channel in the H1 frame was broken, and the gold price immediately fell sharply. Currently, the downtrend of gold is still maintained. The MA lines are still resistance for gold prices.
Important price zones today: 3300 - 3305, 330 - 3325 and 3267 - 3272.
Today's trading trend: SELL.
Recommended orders:
Plan 1: SELL XAUUSD zone 3303 - 3305
SL 3308
TP 3300 - 3290 - 3280 - 3270.
Plan 2: SELL XAUUSD zone 3323 - 3325
SL 3328
TP 3320 - 3310 - 3290 - 3280.
Plan 3: BUY XAUUSD zone 3267 - 3269
SL 3264
TP 3272 - 3282 - 3292 - 3302 (small volume).
Wish you a safe, favorable and profitable trading day.🌟🌟🌟🌟🌟
Chartanalysis

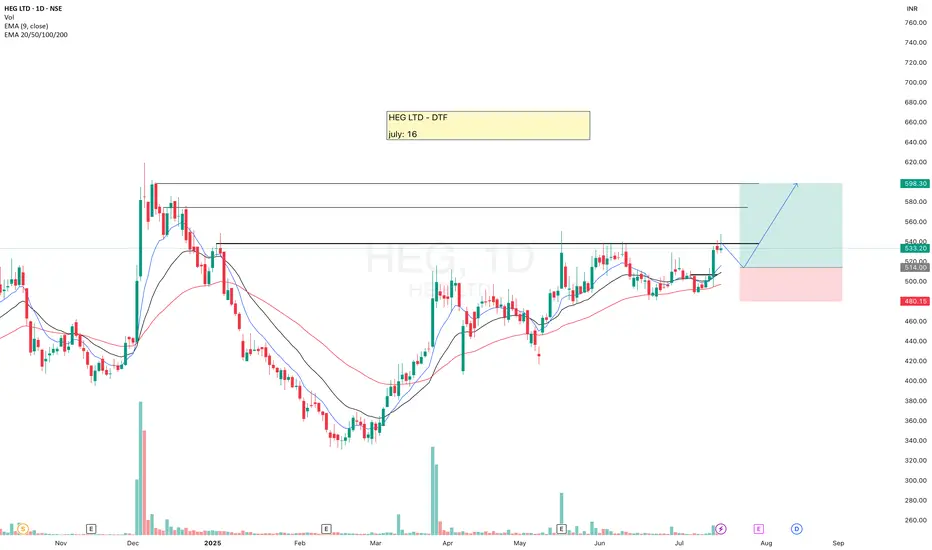
HEGHEG is looking good, moving above 20ema, but I am looking for small retracement for the Entry. In case it starts consolidating at CMP then we'll change our plan accordingly.
Trading is a game of probabilities, keep your ego aside and flow with the market.
✅ If you like my analysis, please follow me here as a token of appreciation :)
in.tradingview.com/u/SatpalS/
📌 For learning and educational purposes only, not a recommendation. Please consult your financial advisor before investing.
Matrimony-A weekly breakout for ATH target is done!Matrimony has finally given weekly closing above its weekly supply zone of 730-750.
Stock can fly if it manages to sustain above this zone.
ATH target can be expected. Not a recommendation.

Cartrade-A risky positional trade for ATH targets!Cartrade has given outstanding Q4 2024 results and bullishness in the stock is indicator of same.
However, these stocks come with good amount of risk with bigger rewards.
Stock has formed beautiful cup & handle pattern and is about to break it.
Once 1000 is crossed, we can see ATH levels soon. I had seen similar breakout in PBFintech (Policybazaar).
If you believe in new age startups, this stock is technically looking bullish.

Lauruslabs-It can fly towards ATH again!Lauruslabs has given a good breakout of trendline and horizontal resistance with volume.
Stock is looking strong for a reversal and can fly towards ATH if market supports.
Keep in watchlist.

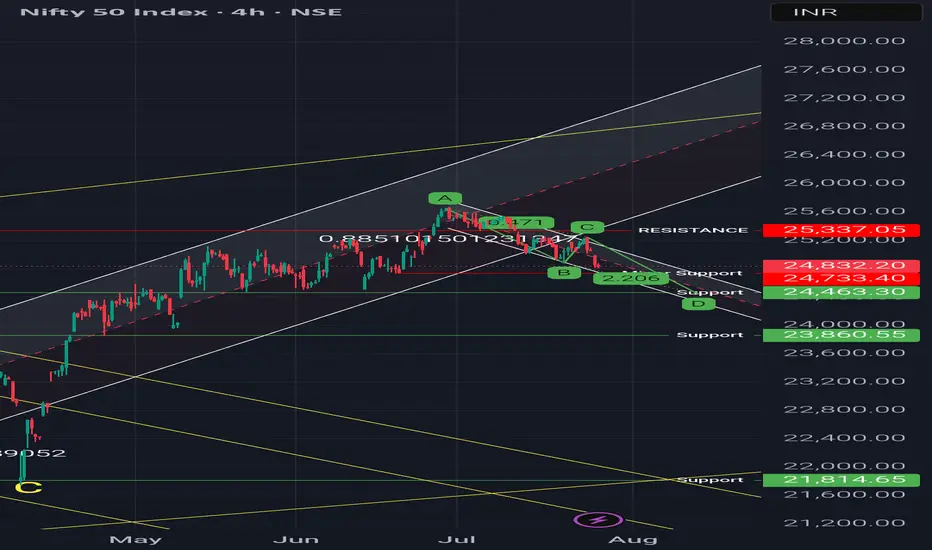
Regression channel & Harmonic pattern - Short term bearish trendObservations:
1. It is short term bearish trend as long as price holds above 24400
2. Price is below 50 DEMA
Possible Scenarios:
1. Price may attempt a mean reversion toward the median line of the channel
2. A break above could retest the 25,240–25,337 resistance zone, up move can only be considered when weekly candle will closed above that level because on weekly time frame there is 4 crows formation.
3. Harmonic patterns (1:1) suggests, the level of 24470 Support level in coming 10-15 trading days.
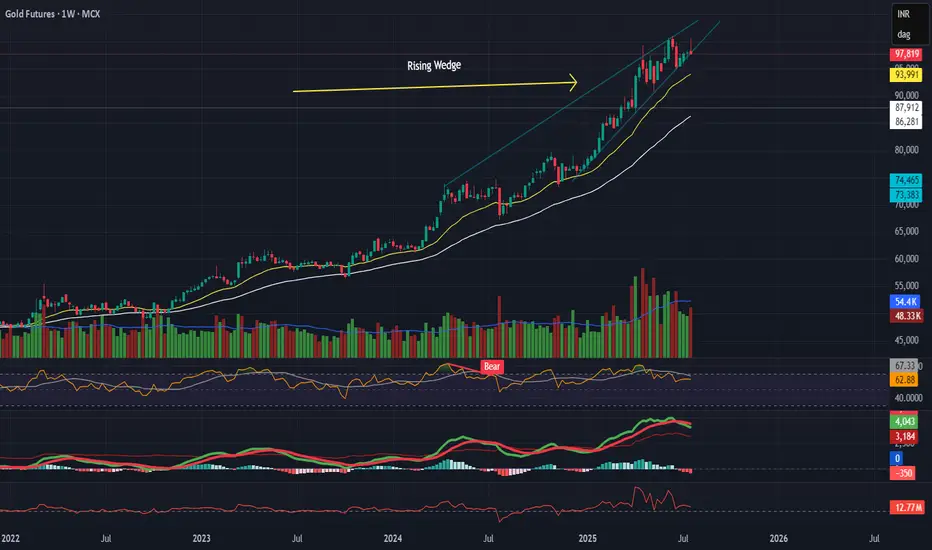
Gold Breaking Down – Rising Channel + Wedge Breakdown
Gold Breaking Down – Rising Channel + Wedge Breakdown
Description:
Gold has broken down from a rising channel on the daily timeframe and a rising wedge on the weekly, signaling a possible intermediate correction.
Key Observations:
- Momentum divergence on RSI, MACD, EFI
- Bearish volume supporting the move
- Price now below 20 EMA, approaching 50 EMA
- Weekly wedge failure after a secondary test of highs
Macro Drivers:
- Lower inflation
- Stable USD
- Dovish Fed stance
- Middle East tension cooled
- Gold appears overpriced on relative terms
Trade Setup:
🔻 Breakdown: ₹97,500
🎯 Targets: ₹92,000 → ₹87,000
🛑 Stoploss: ₹1,00,560 (near ATR and resistance)
🧠 Bearish bias short-term unless macro changes again.
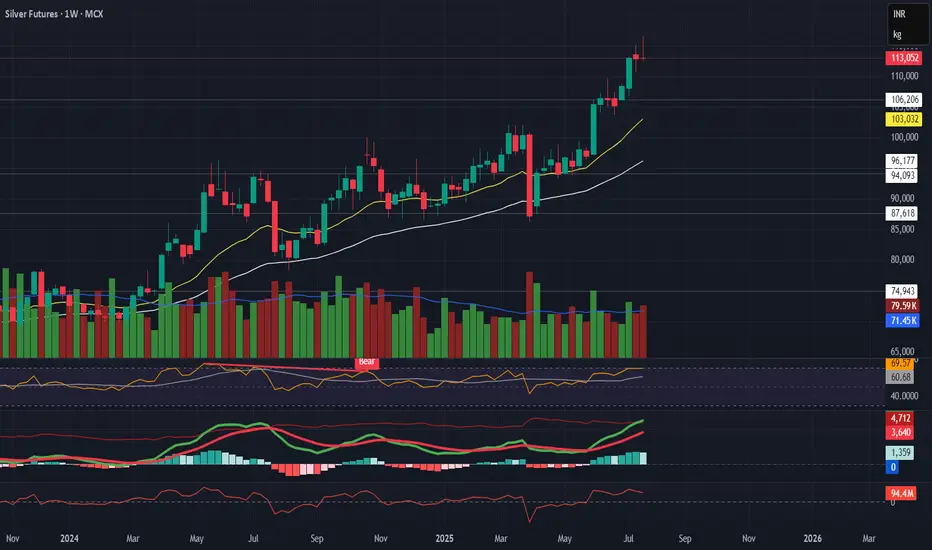
Silver Futures – Bearish Reversal in Progress
Silver Futures – Bearish Reversal in Progress
Description:
Silver is showing a strong technical reversal across timeframes. Short-term correction looks likely.
Technical Setup:
Daily:
Evening Star + Bearish Engulfing
Flattening EMAs
Volume and MACD confirming momentum slowdown
Weekly:
Gravestone + Southern Doji near resistance
RSI close to overbought
EMA slope still up, but weakening signs visible
Macro View:
No major bearish macro trigger — Fed dovish, USD stable, inflation low.
→ This is likely a technical pullback, not a fundamental reversal.
Trade Plan:
🔻 Breakdown Level: ₹114,560
🎯 Targets: ₹107K → ₹101K → ₹93K
🛑 SL: ₹116,000+
Caution: No position without breakdown confirmation.
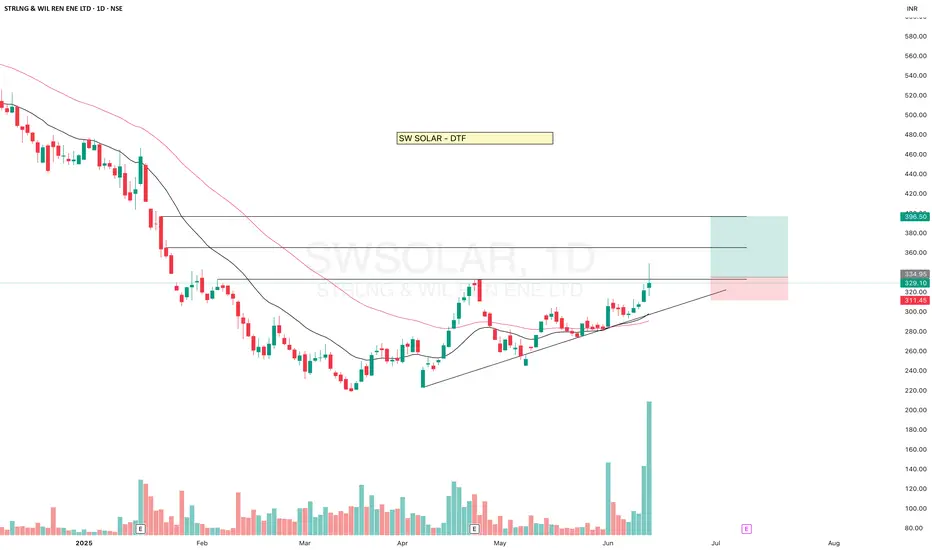
SW SOLARSW SOLAR gave BO but came down, heavy volume, if sustain this level then it may give a good upside move.
Moving above 20-50ema.
✅ If you like my analysis, please follow me as a token of appreciation :)
in.tradingview.com/u/SatpalS/
📌 For learning and educational purposes only, not a recommendation. Please consult your financial advisor before investing.
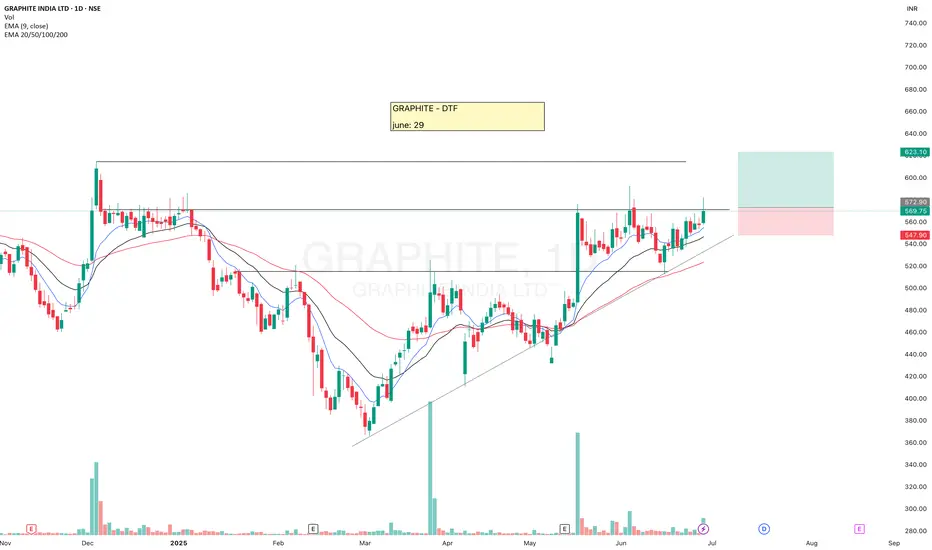
GRAPHITEGRAPHITE has been facing resistance at this level, now there is probability of an upside move.
Look for the breakout.
✅ If you like my analysis, please follow me as a token of appreciation :)
in.tradingview.com/u/SatpalS/
📌 For learning and educational purposes only, not a recommendation. Please consult your financial advisor before investing.
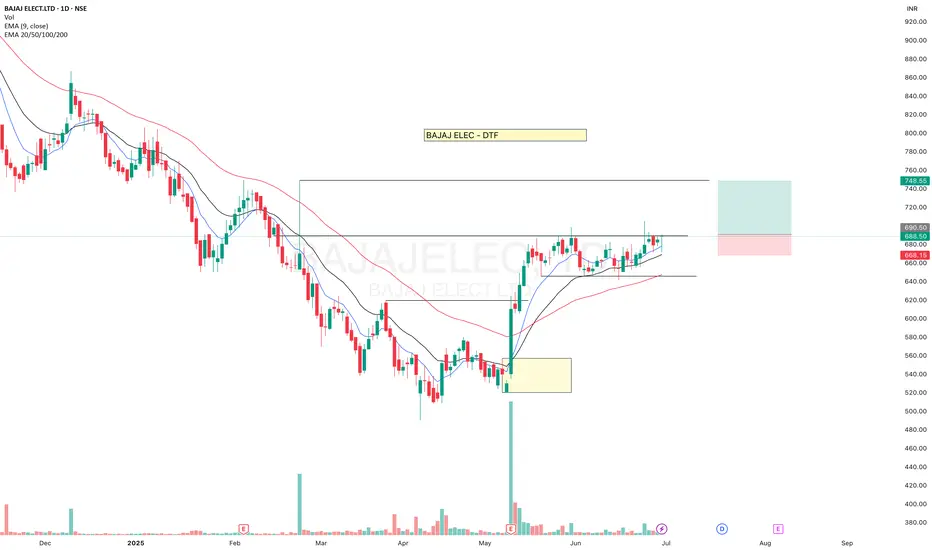
BAJAJ ELECTBAJAJ ELECT is facing resistance and now seems to be ready for the BO.
Breakout from here may give a good upside move.
✅ If you like my analysis, please follow me as a token of appreciation :)
in.tradingview.com/u/SatpalS/
📌 For learning and educational purposes only, not a recommendation. Please consult your financial advisor before investing.
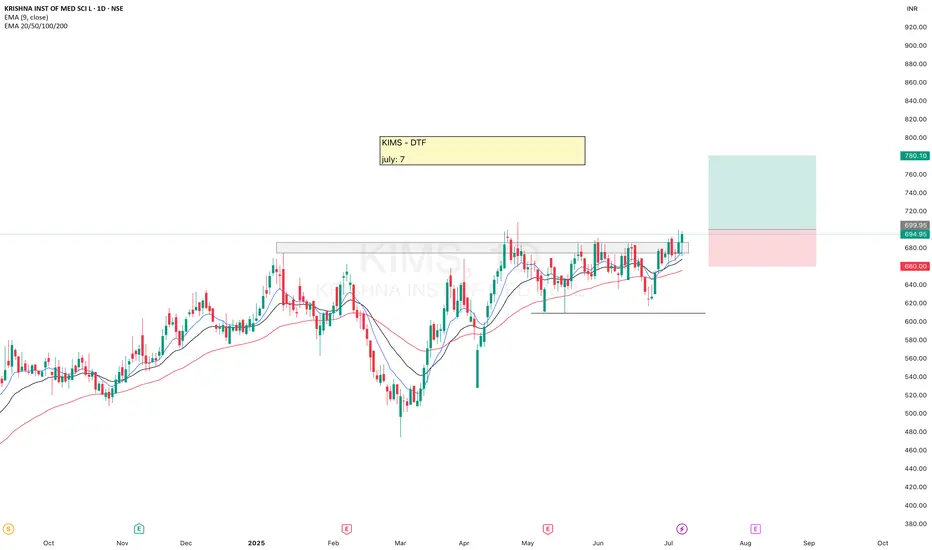
KIMSKIMS has been consolidating near resistance from a long time, now makes a Hammer candle above resistance and seems ready.
Keep eyes on this.
✅ If you like my analysis, please follow me as a token of appreciation :)
in.tradingview.com/u/SatpalS/
📌 For learning and educational purposes only, not a recommendation. Please consult your financial advisor before investing.
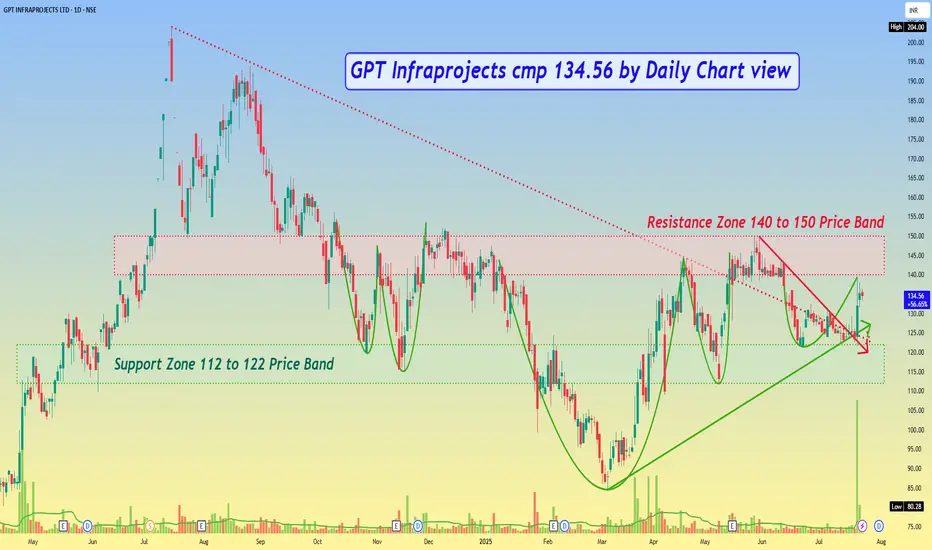
GPT Infraprojects cmp 134.56 by Daily Chart viewGPT Infraprojects cmp 134.56 by Daily Chart view
- Support Zone 112 to 122 Price Band
- Resistance Zone 140 to 150 Price Band
- Support Zone tested and retested well before breakout
- Falling Resistance Trendline from ATH broken and sustained
- 2nd recent Falling Resistance Trendline Breakout too seems sustained
- Heavy Volumes surged seen over past 2 days by demand based buying
- Bullish Rounding Bottoms by Resistance Zone neckline indicate upside momentum readiness
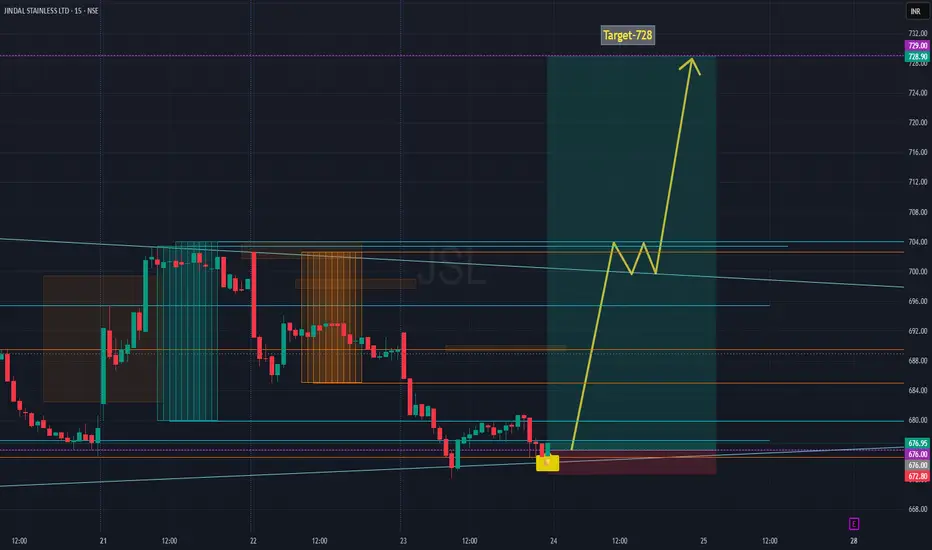
JSL Reversal Zone Identified -Path to 728 [Post Q1 Result]Structure-Based Intraday Outlook | Jindal Stainless (JSL)
Price reacted near a confluence support zone, overlapping key trendlines and historical liquidity area.
The yellow caution label appeared, marking a potential high-probability trend shift based on Leola Lens SignalPro.
Rejection from this zone suggests early signs of accumulation.
If price sustains above this base, the pathway builds towards ₹728.
Watch for intermediate resistance zones around ₹702–₹706, which may offer short-term reactions before continuation.
⚠️ Educational Outlook Only — No Buy/Sell advice.
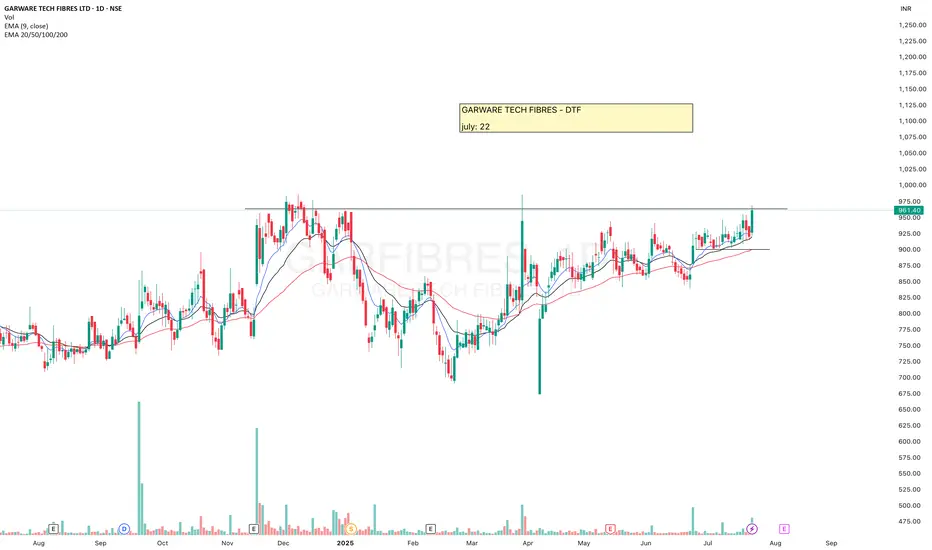
GARFIBRESGARWARE TECH FIBRES has formed a Bullish structure, made VCP pattern, volume is also visible.
Now it is at resistance, keep eyes on it as the breakout from here can give a good upside move.
Breaking ATH may boost it more. But definitely wait for the Re-test after the breakout.
📌 Re-test matters. Always!
Today I shared why waiting for a re-test is so important - with a real example.
Check out the chart and analysis on BLUEJET in my recent post.
It’ll make you rethink your entries.
✅ If you like my analysis, please follow me as a token of appreciation :)
in.tradingview.com/u/SatpalS/
📌 For learning and educational purposes only, not a recommendation. Please consult your financial advisor before investing.
MARKSANSMARKSANS looks good, it's been facing resistance for a long time, and now constantly making HL and Equal highs.
✅ If you like my analysis, please follow me here as a token of appreciation :)
in.tradingview.com/u/SatpalS/
📌 For learning and educational purposes only, not a recommendation. Please consult your financial advisor before investing.

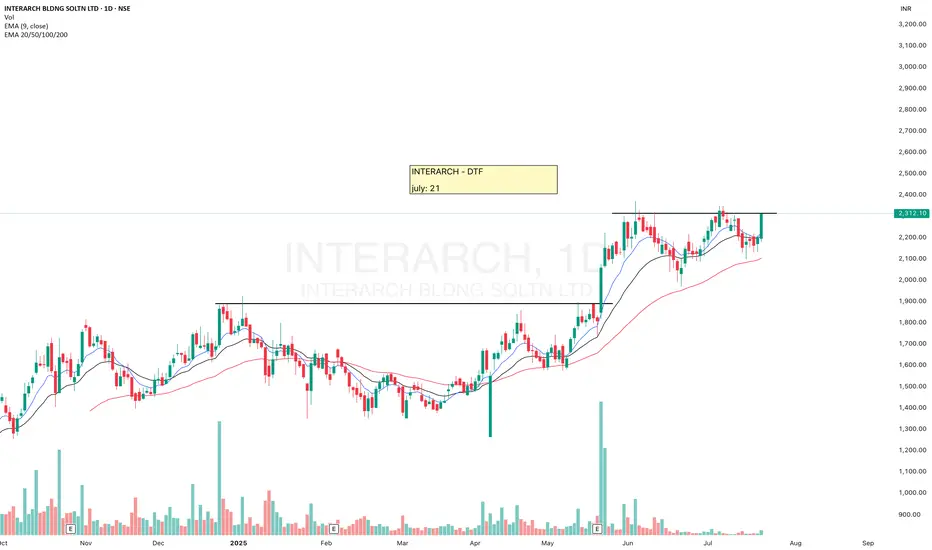
INTERARCHINTERARCH is looking strong, there is probability of an upside move.
Keep eyes on this.
✅ If you like my analysis, please follow me as a token of appreciation :)
in.tradingview.com/u/SatpalS/
📌 For learning and educational purposes only, not a recommendation. Please consult your financial advisor before investing.
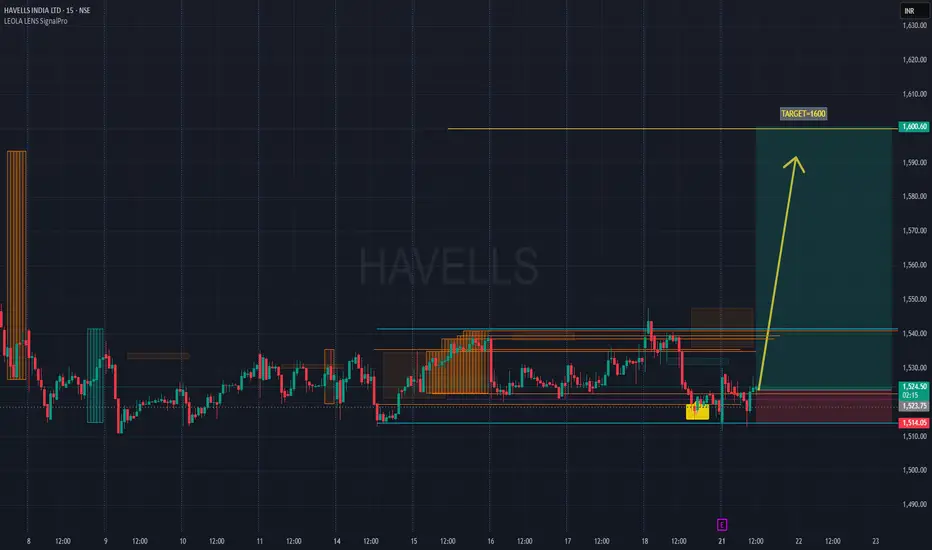
HAVELLS Pre-Result Reversal Watch I Holds for Potential 1600Chart Type: 15-minute | Tool Used: Leola Lens SignalPro
Price action has rebounded from a key liquidity zone (highlighted yellow) with visible accumulation below ₹1,520.
Key Observations:
Price retested prior demand zone (marked by SignalPro with structure and volume signals).
Potential bottom formation visible intraday with higher low attempt post 12 PM.
Rejection of downside wick near ₹1,514, aligning with earlier liquidity pockets.
Idea View:
If price sustains above ₹1,525–₹1,530, possible momentum expansion toward resistance zone at ₹1,600.60.
Clean structure break above previous order blocks may attract trend traders.
Result-based volatility expected — manage risk, especially with expected earnings post-market today.
Risk Reference Zone:
Invalid below ₹1,510 (red shaded zone)
This is not financial advice. Chart is for educational and structural reference only.
#HAVELLS #PriceAction #ChartAnalysis #MarketStructure #SignalPro #LiquidityZones #TechnicalAnalysis #TrendReversal #NSEStocks #EarningsSetup
Supply to Demand Flip Explained! | Spot High-Probability Zones Ever wondered how smart traders catch the perfect entries? 🤔
In this video, I break down the Supply-Demand Conversion Zones—where Supply turns into Demand and vice versa. With real chart examples .

Big Move Coming? Watch This Classic VCP Setup on Shriram FinanceHello everyone, i hope you all will be doing good in your trading and your life as well. Today i have brought a setup which name is VCP (Volatility Contraction Pattern) is one of the most powerful base setups, where the price contracts in multiple tight ranges, showing controlled strength. It signals that supply is drying up and the stock is getting ready for a strong move, usually a breakout. What makes it special is the combination of tightening price with lowering volume , and that's exactly what we can observe in Shriram Finance right now.
The stock has taken multiple supports from key EMAs like 9, 21, and 50 during this entire consolidation, a classic VCP sign. With each dip being bought quickly and bounce getting tighter, the stock is preparing for a potential breakout move.
Keep this one on radar , structure is clean, volume behavior is ideal, and if momentum comes, VCP patterns don’t disappoint.
For levels and risk-reward, please refer the chart above.
Disclaimer: This analysis is for educational purposes only. Please consult a financial advisor before making investment decisions.

MAHLIFEMAHLIFE looks good.
Small pullback for the Entry will be good. Keep eyes on it.
✅ If you like my analysis, please follow me as a token of appreciation :)
in.tradingview.com/u/SatpalS/
📌 For learning and educational purposes only, not a recommendation. Please consult your financial advisor before investing.

BLUEJETBLUEJET looks strong.
It gave breakout, a small pullback will be good for the Entry as it is bit far away from 20ema, once it touches the 20ema then we may expect a good upside move.
Keep eyes on it.
✅ If you like my analysis, please follow me as a token of appreciation :)
in.tradingview.com/u/SatpalS/
📌 For learning and educational purposes only, not a recommendation. Please consult your financial advisor before investing.

PVRINOXPVRINOX is looking good.
Making VCP pattern, equal highs and HL formation and good volume. Keep eyes on it.
✅ If you like my analysis, please follow me as a token of appreciation :)
in.tradingview.com/u/SatpalS/
📌 For learning and educational purposes only, not a recommendation. Please consult your financial advisor before investing.
