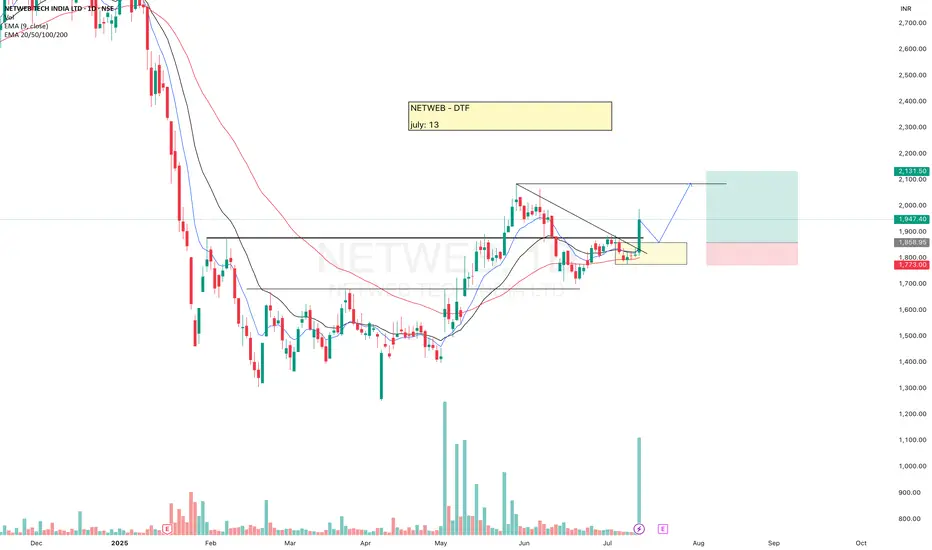
NETWEBNETWEB looks good, it already gave BO then re-tested it, now seems to be getting ready for another move.
Volume + Strong green candle, now need some retracement for entry.
Keep eyes on this.
✅ If you like my analysis, please follow me as a token of appreciation :)
in.tradingview.com/u/SatpalS/
📌 For learning and educational purposes only, not a recommendation. Please consult your financial advisor before investing.
Chartanalysis
SUPREME INDUSTRIESSUPREME INDUSTRIES seems to be ready.
Making HH-HL formation, breakout from here may give a good upside move.
✅ If you like my analysis, please follow me as a token of appreciation :)
in.tradingview.com/u/SatpalS/
📌 For learning and educational purposes only, not a recommendation. Please consult your financial advisor before investing.

METROPOLIS – Big Volume Breakout + Price Action + Momentum___________________________________________________________________________
📈 METROPOLIS – Big Volume Breakout | Strong Momentum Building |
Price Action | Volume Structure
🕒 Chart Type: Daily Chart
📆 Date: July 9, 2025
___________________________________________________________________________
Price Action: METROPOLIS HEALTHCARE LTD has delivered a strong breakout on the daily chart, moving out of a multi-week consolidation zone between 1880–1910 with a wide-range bullish candle on July 9. This breakout above the key resistance of 2110.9 comes with a clean structure, strong closing, and sharp momentum — now placing the stock near its 52-week high. The accumulation phase is likely over, and this price action suggests the beginning of a new trend. As a key player in the diagnostics sector, METROPOLIS is gaining renewed attention post-COVID, with the healthcare space showing strong tailwinds and fresh investor interest.
___________________________________________________________________________
Chart Pattern: The chart is showing a Flat Base Breakout following a multi-week consolidation, indicating the potential beginning of a new momentum leg within the broader structure. Notably, the base was tight and shallow, which is considered a strong bullish signal as it reflects controlled accumulation and limited profit-booking. This clean breakout hints at renewed strength and the possibility of sustained upside if volume and structure hold.
___________________________________________________________________________
Candlestick Pattern: NA
___________________________________________________________________________
Volume Analysis: The volume analysis strongly supports the breakout, with trading volume on the breakout day soaring to over 5 times the average of the past 20 sessions. This surge was not just in quantity but also in delivery volume, signaling that the move was backed by genuine long-term accumulation rather than intraday speculation. As the classic saying goes, “volume precedes price” — and this sharp spike clearly points to smart money entering the stock, lending credibility to the breakout and hinting at further upside potential.
___________________________________________________________________________
Technical Indicators: The technical indicators paint a strongly bullish picture. The RSI on the daily timeframe is at 84, which, while overbought, reflects strength and momentum rather than exhaustion. The MACD has triggered a bullish crossover, with a steadily rising histogram indicating a healthy momentum buildup. Both CCI and Stochastic oscillators are deep in bullish territory — CCI above 300 and Stochastic over 88 — highlighting the intensity of the current uptrend. Additionally, the price has expanded beyond the upper Bollinger Band, suggesting the start of a volatility expansion phase, which often accompanies strong directional moves.
___________________________________________________________________________
Support & Resistance: The stock has given a decisive breakout above ₹2110.9, which now acts as a strong reference point and the official top of its recent consolidation range. This level was pierced by a bullish candle backed by high volume, confirming strength and conviction in the move. Ahead, the stock faces its first hurdle at ₹2157, a short-term resistance just above the breakout zone where minor profit-booking may emerge. Beyond that, ₹2256.1 marks a key medium-term resistance aligned with a previous swing high — a level to watch closely if the rally continues on solid volume. For positional traders, ₹2401.3 stands as a distant resistance zone that, while weak, could be relevant if momentum accelerates. On the downside, ₹1912.7 offers immediate support, being the level that held firm during base formation. If deeper retracements occur, ₹1767.5 and ₹1668.4 are layered supports where the price previously showed strength. At the very base lies ₹1315, the major long-term demand zone — a structural support that triggered the prior trend and serves as the final defence in case of any broad weakness.
___________________________________________________________________________
What’s Catching Our Eye: The price has decisively broken above a multi-week resistance zone, and what makes this move stand out is the massive volume backing it. This isn't just a random spike — it's a structured breakout with all the internals lining up beautifully. Momentum indicators like RSI, MACD, CCI, and Stochastic are all in bullish alignment, confirming that the strength is real and not a one-off event. This kind of confluence often signals the start of a meaningful trend, not just a short-lived rally.
___________________________________________________________________________
What We’re Watching For: The key question now is whether the price can sustain above ₹2110.9, the breakout level, without slipping back into the previous range — a crucial sign of breakout validation. We're also keeping an eye out for a healthy pullback toward the ₹1880–₹1910 zone, which could offer a far better risk-reward entry if the uptrend remains intact. Most importantly, the bigger picture is in focus: Is this the beginning of a larger trend aiming for ₹2400+, or are we simply witnessing a short-term momentum burst? The next few sessions will be critical in answering that.
___________________________________________________________________________
Best Buy Level for Equity (Low Risk Idea): A low-risk buying opportunity opens above ₹2110.9, but only if the price sustains this breakout for a day or two — confirming strength and avoiding a false breakout scenario. Alternatively, a pullback to the ₹1880–₹1910 zone could offer an excellent risk-reward setup, especially if accompanied by a clear bullish reversal signal (like a strong candle or volume spike). In both cases, keep a strict stop loss at ₹1839 on a closing basis to protect against deeper downside.
___________________________________________________________________________
Sector Tailwinds: The diagnostic sector continues to build long-term strength in the post-COVID landscape, as healthcare awareness and preventive testing become mainstream. Investors are increasingly allocating capital toward healthcare services, recognizing their structural growth potential. Add to that the rising urban demand for quality diagnostics and the company's strong brand trust, and you get a solid layer of fundamental support fueling this rally — making the technical breakout even more meaningful.
___________________________________________________________________________
Risk to Watch: If the price fails to hold above ₹2110 and starts slipping below ₹1910, there’s a real risk of this breakout turning into a false move. While the current momentum is strong, indicators are overheated, which increases the chances of a short-term pullback or shakeout. Most importantly — no confirmation means no trade. Avoid chasing blindly; let the price action validate the move before committing capital.
___________________________________________________________________________
What to Expect Next: The stock may see a sideways move or a minor pullback toward the ₹1910 zone as it digests the breakout. However, if the price holds above the breakout level, we could see a continuation move toward ₹2157–₹2256 in the near term. The key to watch is volume — if the stock holds near highs with rising volume over the next 2–3 sessions, it could trigger a strong trending move, confirming that smart money is firmly in control.
___________________________________________________________________________
How to Trade METROPOLIS (For Educational Use Only):
Here’s a simple Breakout Trade Plan based on current structure and volume confirmation:
🔹 Entry: Above ₹2110.9 — either on a successful retest of the breakout level or a clean follow-through candle with strength
🔹 Stop Loss: ₹1839 (on closing basis) to protect capital in case of breakdown
🔹 Risk-Reward: Aim for 1:1 initially, then trail for 1:2+ if momentum holds
🔹 Position Sizing: Adjust based on your capital, risk appetite, and SL range — avoid going all-in; stay disciplined with allocation
📌 Always follow your trading plan. This setup is for educational and analysis purposes only.
___________________________________________________________________________
⚠️ Disclaimer (Please Read):
• This chart is shared for educational purposes only and is not investment advice.
• I am not a SEBI-registered advisor.
• The information provided here is based on personal market observation.
• No buy/sell recommendations are being made.
• Please do your own research or consult a registered financial advisor before making any trading decisions.
• Trading involves risk. Always use proper risk management.
___________________________________________________________________________
💬 Found this helpful?
What would be your ideal entry in this METROPOLIS setup — breakout follow-through or demand zone pullback?
Drop your thoughts or questions in the comments below ⬇️
🔁 Share this with your trading community
✅ Follow STWP for clean technical setups backed by price action and volume
🚀 Let’s trade with patience, logic, and clarity!
Be Self-Reliant | Trade with Patience | Learn with Logic
___________________________________________________________________________

KPRMILL - KPRMILL looks good, trying to break the resistance, moving above 20-50ema.
A breakout from here may give a good upside move.
✅ If you like my analysis, please follow me as a token of appreciation :)
in.tradingview.com/u/SatpalS/
📌 For learning and educational purposes only, not a recommendation. Please consult your financial advisor before investing.

Gabriel India Limited - Breakout Setup, Move is ON..#GABRIEL trading above Resistance of 518
Next Resistance is at 673
Support is at 415
Here are previous charts:
Chart is self explanatory. Levels of breakout, possible up-moves (where stock may find resistances) and support (close below which, setup will be invalidated) are clearly defined.
Disclaimer: This is for demonstration and educational purpose only. This is not buying or selling recommendations. I am not SEBI registered. Please consult your financial advisor before taking any trade.

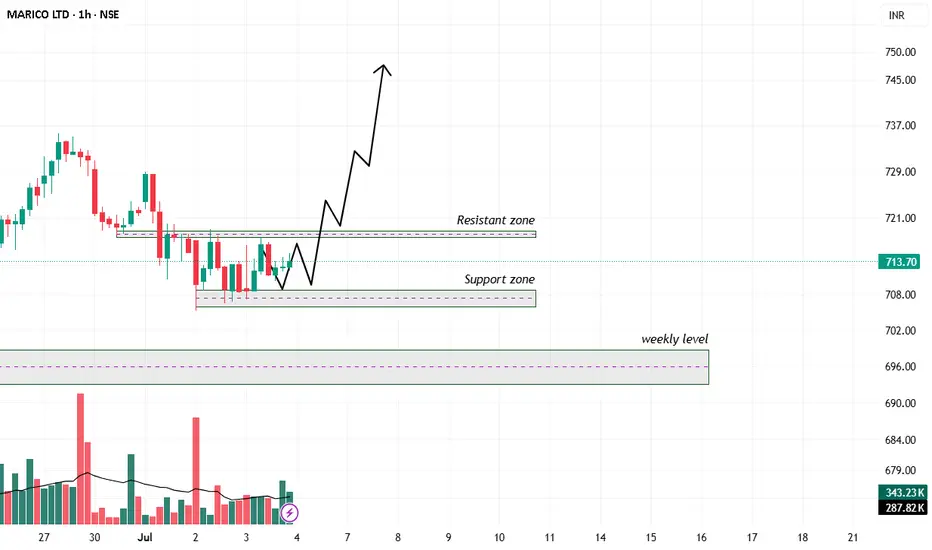
Technical Analysis: MERICO LTDTrend and Structure:
The chart shows a strong uptrend leading up to a recent pullback.
After the pullback, price is consolidating between a support zone (~708 INR) and a resistance zone (~720 INR).
There is a clear weekly support level marked around 690-695 INR below the support zone.
Volume is moderate but showing no large spikes, indicating potential consolidation.
Support and Resistance:
Immediate resistance zone is around 718-721 INR, acting as short-term overhead supply.
The support zone is roughly between 707-710 INR, serving as a base for potential bounce.
The weekly level below (roughly 690-695 INR) may act as a strong support if price breaks current support.
Price Projections:
The drawn projection suggests a short-term dip toward the support zone, followed by a strong bounce above the resistance.
This implies a possible bullish continuation after a minor correction or consolidation.
Volume:
Volume during consolidation is relatively steady.
Watch for volume pickup on a breakout above resistance for confirmation.
Trading plan:
Entry:
Consider entering a long position near or just above the support zone (~708-710 INR) when there is confirmation of buying interest (e.g., bullish reversal candlestick or volume spike).
Alternatively, a breakout entry can be taken above the resistance zone (~720-722 INR) with volume confirmation.
Stop Loss:
Place a stop loss below the support zone or slightly below the weekly level, around 700-705 INR to protect against downside risk.
Targets:
Initial target near the resistance breakout level (~720-725 INR).
Secondary target around 745-750 INR based on the upward arrow projection, representing the next resistance area.
Risk-Reward:
Risk: Approximately 8-10 INR per share.
Reward: Potential gain of 35-40 INR per share.
Favorable risk-reward ratio around 3:1 or better.
Additional Notes:
If the price falls below the support zone and weekly level with strong volume, consider exiting or avoiding long positions.
Look for confirmation signals before entry to reduce false breakouts or breakdowns.
Summary:
Table
Parameter Details
Entry Price ~708-710 INR (on support)
Stop Loss ~700-705 INR
Target 1 ~720-725 INR
Target 2 ~745-750 INR
Trend Pullback in uptrend
Risk-Reward Ratio ~3:1 or better
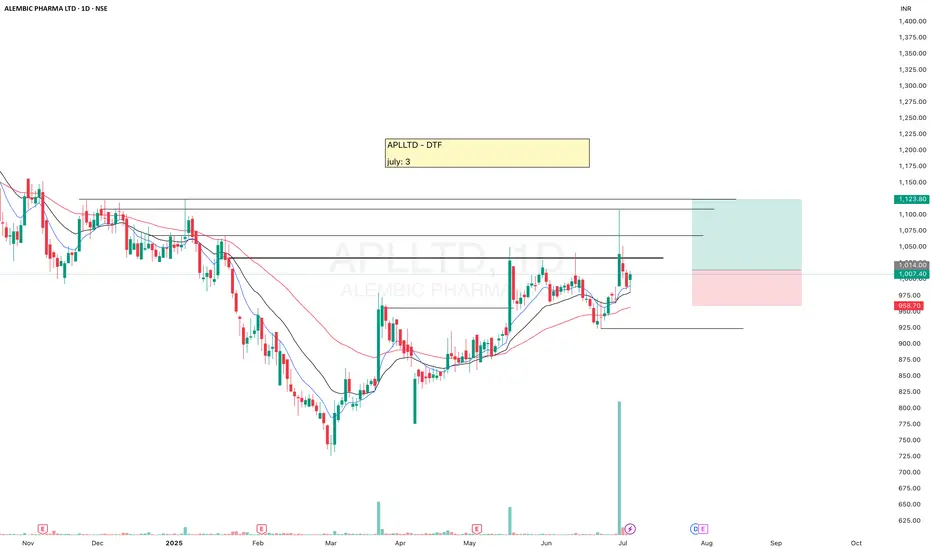
APLLTDAPLLTD is getting ready, moving above 20-50ema, probability of an upside move.
Keep eyes on it.
✅ If you like my analysis, please follow me as a token of appreciation :)
in.tradingview.com/u/SatpalS/
📌 For learning and educational purposes only, not a recommendation. Please consult your financial advisor before investing.
SANDUMA - (SANDUR MANG & IRON ORES)SANDUMA – After facing strong resistance at the current level for a while, the stock tapped into a demand zone in Feb 2025 and began moving up, forming a consistent Higher Highs - Higher Lows (HH-HL) structure.
It gave a breakout in May, followed by a successful retest of the breakout zone. Currently, it's trading above the 20-50 EMA, indicating strength.
The price action now suggests it's getting ready, there is probability of an upside move.
Keep following.
✅ If you like my analysis, please follow me as a token of appreciation :)
in.tradingview.com/u/SatpalS/
📌 For learning and educational purposes only, not a recommendation. Please consult your financial advisor before investing.

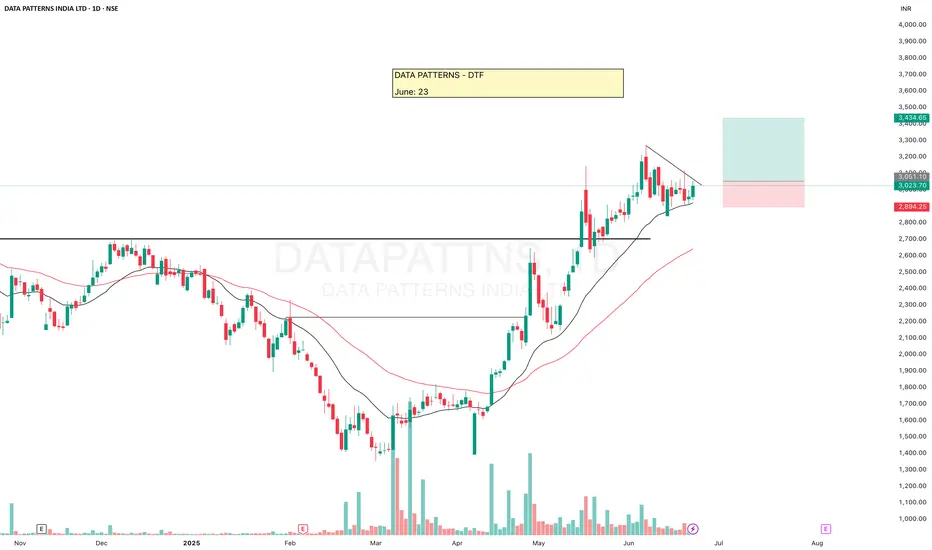
DATAPATTNS
DATA PATTERNS has been making HH-HL formation. Recently broke an old resistance, moved up, re-tested and started moving up again.
Keep following it, there is probability of an upside move.
✅ If you like my analysis, please follow me as a token of appreciation :)
in.tradingview.com/u/SatpalS/
📌 For learning and educational purposes only, not a recommendation. Please consult your financial advisor before investing.
Ambuja Cement Chart Analysis with Confirm Targets 2025 Cement Industry: A Strong Pillar of India’s Growing Economy
India remains the world’s second-largest cement producer as of 2025, and the pace of its growth continues to accelerate.
The demand for cement has surged due to infrastructure development projects such as housing construction, road expansion, railways, metro projects, and Smart Cities initiatives.
To boost infrastructure development, the Indian government has announced an interest-free assistance package of approximately ₹1.5 lakh crore.
Schemes like "Housing for All" and rural-urban housing programs have intensified construction activities across the country.
In this dynamic environment, the cement sector is receiving solid support and is expected to grow significantly in the coming years.
Ambuja Cement Company Profile
Ambuja Cements is one of India’s leading cement companies, established in 1983. It is now a part of the **Adani Group, a diversified and rapidly expanding conglomerate. The company primarily manufactures and sells grey cement and ready-mix concrete (RMC).
As the Smart City Mission, metro rail networks, expressways, flyovers, and industrial corridors progress rapidly, cement consumption continues to rise. Several large-scale cement road and railway infrastructure projects are underway across the country, expected to sustain the sector’s momentum over the next few years.
Ambuja Cement Technical Analysis
Major Resistance Zone: ₹590 – ₹700
₹590 acts as a strong resistance level, where the stock has previously faced multiple rejections.
A weekly candle closing above ₹590 would signal a strong bullish breakout.
Once this level is breached convincingly, the stock may **quickly move towards ₹700, testing its previous all-time high.
Trading Plan:
1.If the stock gives a weekly close above ₹590, it could be a buy signal.
2. The next potential target would be ₹700** based on the breakout confirmation.
Strong Demand Zone: ₹450 – ₹460
Significance of this zone:
1.The range of ₹450–₹460 has consistently shown bounce-back behavior, indicating strong buying interest.
2.Swing traders and investors** can consider accumulating when the stock nears this zone, as historical data shows this level has acted as **strong support**.
Stop-loss Strategy:
If any **weekly candle closes below ₹445, it could indicate a breakdown of support, and exiting the position would be advisable.
Support Zone Trading Plan
If the stock drops to ₹450–₹460 and **buying volume** increases, it could present a good buying opportunity.
Short-Term Potential Targets
First Target: ₹578
Second Target: ₹640
Manoj Strengthen Support – ₹413.50
The level of ₹413.50 is recognized on the chart as a strong psychological and emotional support, named “Manoj Strengthen Support.”
Why is this level important?
1. In case of a sudden market correction due to war, global recession, or political instability, this level may act as a temporary strong support.
2. It may prevent further decline and hold price levels in such events.
Investor Tip:
1. If the stock declines but this level holds, it becomes a **critical risk-management zone**.
2. Investors can look for potential **bounce-back** opportunities and strengthen their conviction around this level.
Ambuja Cement Long-Term Targets (2025–2028)
The long-term structure of Ambuja Cement appears bullish, and based on technical charts, the following major targets have been identified:
First Target: ₹700
Expected during 2025–26 if the stock gives a strong closing confirmation above ₹590.
Second Target: ₹840
If the stock decisively breaks above ₹700 (its all-time high), this target could be achievable in 2026.
Third Target: ₹1040
In the long term, if the stock sustains above ₹840, a move towards ₹1040 is likely by 2027–2028.
This analysis is based on technical breakouts, price action, and support-resistance principles, and can serve as a strategic guideline for long-term investors.

VOLTAMPVOLTAMP may give a good upside move if it gives breakout.
It's been making HH-HL formation, broke resistance and re-tested it, now seems ready.
Keep following it.
✅ If you like my analysis, please follow me as a token of appreciation :)
in.tradingview.com/u/SatpalS/
📌 For learning and educational purposes only, not a recommendation. Please consult your financial advisor before investing.

HINDCOPPER | Supply-Demand Flip & Structure This chart shows a clean structural shift on the weekly timeframe for Hindustan Copper Ltd (NSE: HINDCOPPER):
🔷 Blue Zone: A key Supply-to-Demand Flip area. Price reacted strongly from this zone after multiple touches, showing its relevance.
📉 CT Line (Compression Trendline): Price was getting compressed under this trendline. It's now visibly breached.
➡️ Arrow Zone: Highlights a smaller supply-demand zone, formed after consolidation and breakout. Marked for structural clarity.
Volume also shows higher activity during this move, indicating strength behind the recent price action.

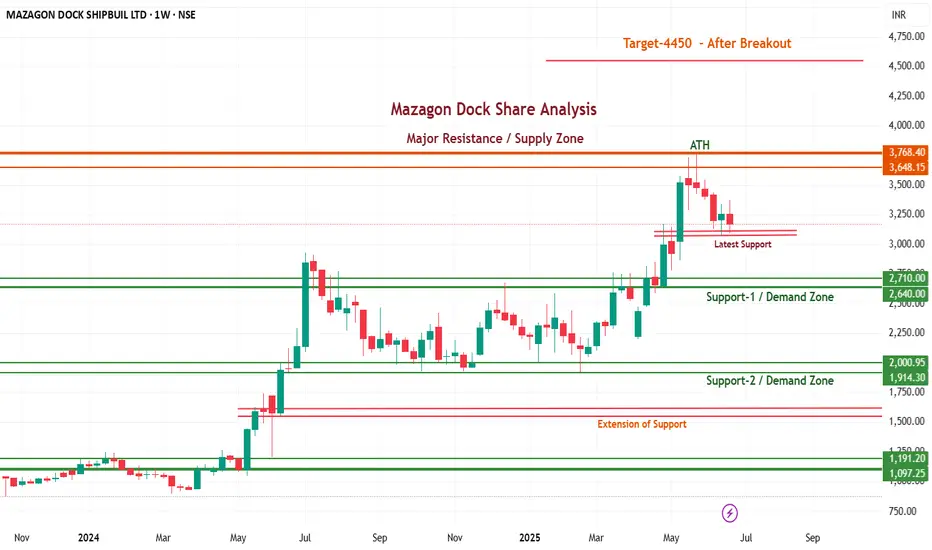
Mazagon Dock Share Price Analysis: Strong Technical Levels
Demand Zones – Ideal for Long-Term Investors
Demand zones are crucial areas where buying interest is strong, often due to institutional or big investor activity. Mazagon Dock has two well-marked demand zones:
Support-1 / Demand Zone: ₹2,640 – ₹2,710
Support-2 / Demand Zone: ₹1,914 – ₹2,000
Strategy: Long-term investors should look to accumulate or add quantity near these zones, especially if the stock sees a pullback. Historically, the price has shown strong reversal signals from these areas.
Latest Support – Swing Traders’ Focus
Current Swing Support: Around ₹3,100
This zone is crucial for swing traders. If the price holds this level and forms a bullish candle pattern, short-term upward movement may follow. However, a breakdown could lead to testing lower demand zones.
Supply Zone – Major Resistance for Breakout
Major Supply Zone: ₹3,648 – ₹3,768 (also near ATH – All-Time High)
This zone is where profit booking usually happens. Big investors often exit partial holdings near this level, awaiting a strong breakout confirmation. A successful breakout above ₹3,768 can initiate a move toward the next target of ₹4,450.
Extension of Support – Trap or Opportunity?
Levels: ₹1,400 – ₹1,500
In many cases, stocks break demand zones and trap retailers in a false breakdown. This zone is often used by smart money to accumulate quietly. A bounce from this level is a possible re-entry opportunity post-fake breakdown.
What’s the News?
Mazagon Dock has acquired a controlling stake in Colombo Dockyard (Sri Lanka) for ₹452 crore. This marks the company’s first major international acquisition, opening doors for cross-border defense and commercial shipbuilding collaboration.
Mazagon Dock’s strong technical structure and strategic international acquisition position it as a powerful stock for both investors and swing traders.
Stay Ahead in the Market!
If you found this analysis helpful, don’t forget to like, comment, and follow for more such chart updates.
Want regular updates on support/resistance zones, breakouts, and swing trading setups? Save this chart and turn on notifications.- Gift a TradingView Subscription
ASIAN PAINTS LTD. – INTRADAY ZONE ANALYSIS________________________________________________________________________________
📈 ASIAN PAINTS LTD. – INTRADAY ZONE ANALYSIS
📆 Date: June 29, 2025 | ⏱ Timeframe: 15-Minute Chart
🔍 Educational Analysis for Learning Purposes Only
________________________________________________________________________________
📊 Zone Breakdown:
• 🔴 Top Range Resistance – 2,364.50
Marked in Red: This is a potential supply zone, where price may face resistance after a strong move up. Ideal for observing bearish reversal patterns like a shooting star, bearish engulfing, or a doji — especially if volume drops or candles show exhaustion.
• 🟠 Neutral Zone – Avoid Trade Area (2,320–2,340)
Marked in Orange: Historically indecisive. Avoid trades here as price often moves sideways or with false breakouts.
• 🟢 Demand Zone – 2,302.90 to 2,293.70 | SL: 2,292
Marked in Green: Price broke out with strong volume from this area. A retest may offer bullish pullback opportunities with proper confirmation candles.
• 🟩 Bottom Support – 2,275.40
Important base level. Breakdown below this zone may change overall short-term bias.
________________________________________________________________________________
🔍 Candlestick Observation:
At the resistance zone, the last candle shows slight upper rejection and reduced body size.
🧠 Interpretation: A possible early signal of exhaustion. Traders can watch for confirmation via volume drop or follow-up bearish candle for a short bias — or wait for breakout strength for long continuation.
________________________________________________________________________________
⚙️ Educational Trade Ideas (Study Purpose Only)
▶️ Reversal Setup – Bearish Bias
• Entry: Below ₹2,358 on bearish candle confirmation
• Stop Loss: Above ₹2,365
• Risk-Reward: 1:1 | 1:2+
• 🧠 Ideal for studying price rejection after a rally into resistance
________________________________________________________________________________
▶️ Pullback Setup – Bullish Bias
• Entry: Near ₹2,300 with bullish confirmation at demand zone
• Stop Loss: ₹2,292
• Risk-Reward: 1:1 | 1:2+
• 🧠 Useful example of “breakout → retest → continuation” pattern
________________________________________________________________________________⚠️ Disclaimer (SEBI-Compliant):
This content is shared strictly for educational and informational purposes. It is not investment advice or a trading recommendation. Please consult a SEBI-registered financial advisor before taking any investment decisions.
STWP | Learn. Trade. Grow.
________________________________________________________________________________
💬 What do you think about this setup?
Did you observe any other key patterns or zones?
👇 Drop your thoughts in the comments — let’s grow together!
________________________________________________________________________________

MARUTI SUZUKI INDIA LTD. – INTRADAY ZONE ANALYSIS________________________________________________________________________________📈 MARUTI SUZUKI INDIA LTD. – INTRADAY ZONE ANALYSIS
📆 Date: June 29, 2025 | ⏱ Timeframe: 15-Minute Chart
🔍 Educational Analysis for Learning Purposes Only
________________________________________________________________________________
📊 Zone Breakdown:
• 🔴 Top Range Resistance – 12,848
Marked in Red: This area has previously acted as a supply zone, where prices were rejected sharply. It is a potential region to watch for bearish reversal patterns, especially if price rises into this zone on weak volume or shows rejection candles like shooting star or bearish engulfing.
• 🟠 Neutral Zone (No Trade Zone) – Between ~12,720 to ~12,680
Marked in Orange: This is an indecision zone, where price has shown choppiness in the past. It is advisable to stay cautious and avoid trades here, as clear momentum is often missing in this range.
• 🟢 Support Zone – 12,617
Marked in Green: This is the demand zone, where price previously reversed on higher volume. It is a good region to observe for bullish candlestick confirmation patterns (e.g., hammer, bullish engulfing, morning star) on intraday timeframes.
________________________________________________________________________________
🔍 Candlestick Pattern Observation:
At the support zone (12,617), the most recent candle (the last one) shows a long lower wick with a bullish body, forming a bullish hammer-like structure.
• 🧠 Interpretation: This suggests possible buying interest at lower levels, especially since it coincides with volume spike, indicating potential reversal.
• 📌 However, confirmation from the next candle (closing above 12,670 with decent volume) would be required before validating it as a bullish reversal.
________________________________________________________________________________
⚙️ Educational Trade Idea (For Study Purpose Only):
▶️ Potential Long Trade Setup (Bullish Bias)
• Entry (Low-Risk Learner Zone): Around 12,670–12,675, only if next candle shows bullish strength
• Stop Loss: Below 12,617 (zone low) → e.g., 12,600
🧠 Reasoning:
• Price is reacting from a well-identified demand zone
• Volume spike confirms possible accumulation
• Candle with rejection wick hints at reversal interest
• Risk-reward approx. 1:2 or better depending on exit point
________________________________________________________________________________
⚠️ Disclaimer (SEBI-Compliant):
This analysis is shared strictly for educational and informational purposes. It does not constitute investment advice or a recommendation to trade. Viewers are encouraged to use this for learning technical chart reading and should consult a registered advisor before making any financial decisions.
STWP | Learn. Trade. Grow.
________________________________________________________________________________
What do you think about this setup?
Did you spot any other patterns or zones?
👇 Drop your comments below — let’s grow together!
________________________________________________________________________________

Laurus Labs Limited - Breakout Setup, Move is ON...#LAURUSLABS trading above Resistance of 553
Next Resistance is at 699
Support is at 420
Here are previous charts:
Chart is self explanatory. Levels of breakout, possible up-moves (where stock may find resistances) and support (close below which, setup will be invalidated) are clearly defined.
Disclaimer: This is for demonstration and educational purpose only. This is not buying or selling recommendations. I am not SEBI registered. Please consult your financial advisor before taking any trade.

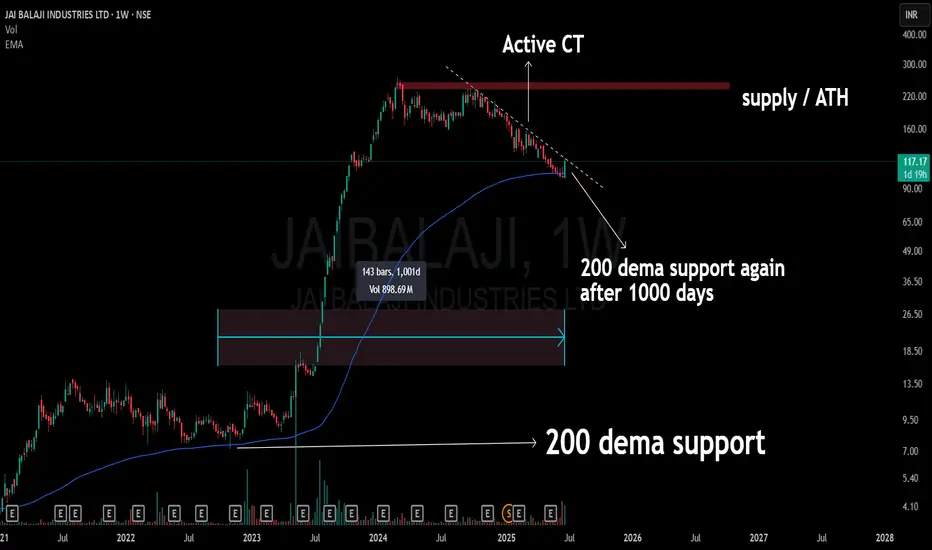
200 Dema Touched After 1000 Days !! 🔵 Stock: JAI BALAJI (Weekly)
🔥 Support Revisit: Back to the 200 DEMA after 1000 days
A level that once acted as the launchpad.
Current structure shows an active compression trend (CT) right into this long-term dynamic support.
The chart also aligns below a major supply zone / ATH band, keeping the broader context in check.
📉 No prediction. No call. Just structure, levels, and time-tested zones doing the talking.
Trent Price Action Decoded – Simplicity Wins!No calls, no forecasting — just pure price action. In this post, I’m simply sharing how I see Trent’s chart. Clean structure, organic movement, and a simple approach to reading the price. For those who enjoy observing the market without noise or bias.

RAJRATAN (Rajratan global wire ltd.)RAJRATAN is consolidating, making higher lows and equal highs, above 20-50ema.
Breakout may give a good upside move.
✅ If you like my analysis, please follow me as a token of appreciation :)
in.tradingview.com/u/SatpalS/
📌 For learning and educational purposes only, not a recommendation. Please consult your financial advisor before investing.

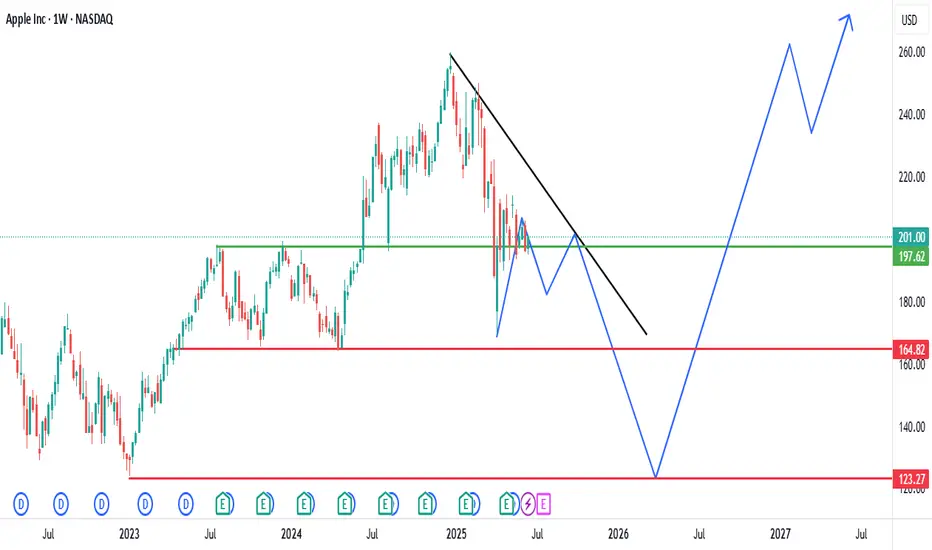
Analysis of Apple Inc. (AAPL) Weekly ChartHistorical Trend: The chart shows Apple Inc.'s stock price on a weekly timeframe from 2022 to mid-2025. The stock exhibited a strong upward trend from 2022 to early 2025, with notable growth followed by periods of consolidation and correction.
Key Levels:
Resistance: The $201.00-$197.62 range (green line) has acted as a significant resistance level. The price recently broke above this zone, suggesting potential bullish momentum.
Support: The $164.82 level (red line) has served as a major support zone. The stock tested this level during a recent decline and rebounded, indicating its strength.
Recent Price Action: After reaching a peak near $201.00, the stock entered a descending triangle pattern (black trendline). A breakout above the resistance at $201.00 is evident, accompanied by an upward projection (blue arrow), hinting at a possible continuation of the bullish trend.
Projected Movement: The upward projection suggests the stock could target levels around $240.00-$260.00 if the breakout holds. However, a failure to maintain above $201.00 might lead to a retest of the $164.82 support.
Volume and Indicators: The chart includes Bollinger Bands (O197.30 H201.70 L195.07 C201.00) with a -4.55 (-2.22%) change, indicating recent volatility. Specific volume data is not detailed, but the breakout suggests increasing buying pressure.
Outlook: The stock is currently in a bullish phase following the breakout above $201.00.
Maintaining above this level could drive further gains, while a drop below might signal a return to the $164.82 support. Close monitoring of price action around these levels is recommended.
Styrenix Performance Materials Ltd - Breakout Setup, Move is ON.#STYRENIX trading above Resistance of 2485
Next Resistance is at 3295
Support is at 1675
Here are previous charts:
Chart is self explanatory. Levels of breakout, possible up-moves (where stock may find resistances) and support (close below which, setup will be invalidated) are clearly defined.
Disclaimer: This is for demonstration and educational purpose only. This is not buying or selling recommendations. I am not SEBI registered. Please consult your financial advisor before taking any trade.

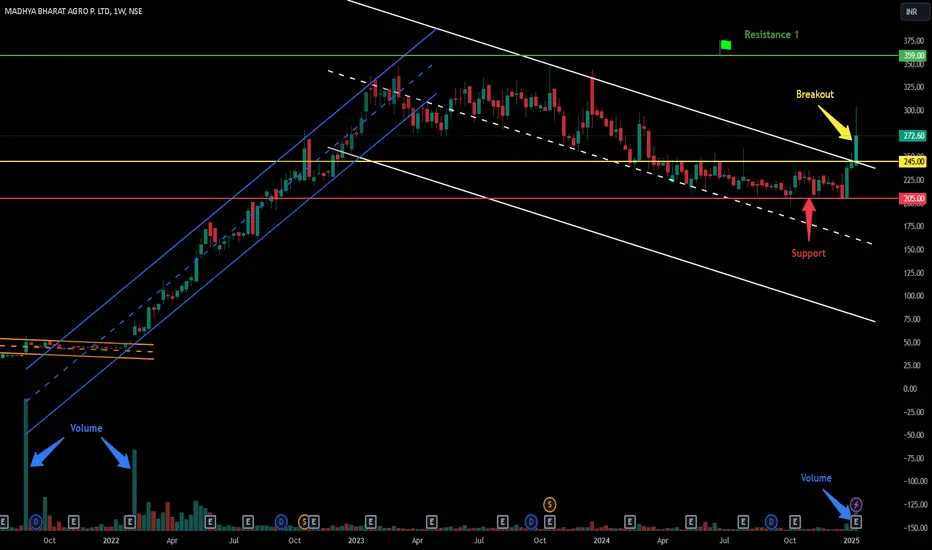
Breakout in Madhya Bharat Agro Products Ltd...Chart is self explanatory. Levels of breakout, possible up-moves (where stock may find resistances) and support (close below which, setup will be invalidated) are clearly defined.
Disclaimer: This is for demonstration and educational purpose only. This is not buying or selling recommendations. I am not SEBI registered. Please consult your financial advisor before taking any trade.
BIRLA CABLEBIRLA CABLE has tapped at the OB after making an impulsive move.
It's been consistently making HH-HL formation.
Reversal from here may give a good upside move.
✅ If you like my analysis, please follow me as a token of appreciation :)
in.tradingview.com/u/SatpalS/
📌 For learning and educational purposes only, not a recommendation. Please consult your financial advisor before investing.
