Gold (XAUUSD) 3100 Or 2900 ?🔍 15M Chart Analysis
📊 Trend: Ranging market
🔑 Key Levels:
✅All-Time High Zone ($3,057) – Major resistance
✅Support at $3,006-$3,010 – Key demand area
✅Current Range: $3,020 - $3,035
🚨 EMA Analysis:
✅ Price is fluctuating around the 50 EMA and 200 EMA, confirming consolidation.
Conclusion:
✅Market is in a ranging phase; a breakout above $3,035 could push the price toward the all-time high.
✅A drop below $3,020 could see price testing $3,006 support.
🔍 1H Chart Analysis
📊Trend: Short-term bearish to neutral
🔑 Key Observations:
✅Descending trendline (Orange Line) was broken, indicating potential bullish recovery.
✅POI Level ($3,006-$3,007) – Strong demand zone, price bounced from here.
✅Resistance Area ($3,035-$3,040) – If price reaches here, sellers may step in.
🚨 EMA Analysis:
✅Price broke above the 50 EMA (Red Line), indicating early bullish momentum.
200 EMA (Blue Line) still below, confirming overall bullish trend.
Conclusion:
✅If price sustains above the trendline breakout, next target would be $3,035-$3,040 resistance zone.
✅A rejection from the current level could push the price back to $3,006 POI.
🔍 4H Chart Analysis
📊Trend: Bullish (Price above 50 EMA & 200 EMA)
🔑 Key Support Levels:
✅$2,983 – Previous support level
✅$2,957 – Strong support zone
✅$2,930 – Near the 200 EMA, potential major support
Key Resistance Levels:
✅$3,022-$3,023 – Immediate resistance zone
🚨 EMA Analysis:
✅50 EMA (Red Line) is acting as dynamic support, price is currently hovering around it.
✅200 EMA (Blue Line) far below, indicating strong bullish momentum.
Conclusion:
✅As long as price holds above the 50 EMA, bulls remain in control.
✅A break below 50 EMA could lead to a retest of $2,983 or $2,957 support zones.
Overall Summary & Trade Ideas
✅ Bullish Bias on higher timeframes (4H), but short-term market is ranging (15M).
📌 🔑 Key Levels to Watch:
Above $3,035 → Bullish breakout towards $3,050+
Below $3,020 → Bearish pressure towards $3,006
⚠️ Trading Plan:
🔵For Long Positions : Buy above $3,025 with a target of $3,040-$3,050.
🔵For Short Positions : Sell below $3,020, targeting $3,006.
Wait for a breakout from the range for a clearer trade setup.
👉 Always follow TP/SL to protect your capital and maximize profits!
Stay tuned for updates once the confirmations are in place!
Please support me with your likes and comments to motivate me to share more analysis with you and share your opinion about the possible trend of this chart with me !
📢Best Regards , Silver Wolf Traders Community
Disclaimer: This is for educational purposes only.
Always trade responsibly and manage your risk effectively
Chartanalysis

HUDCO another fall?If that's an AB=CD pattern, still worse to come for HUDCO.
Bearish invalidation above 209-210 zone.
Analysing this stock for a sell/buy opportunity based on the breakout/rejection at this level of bearish invalidation.

Gold (XAU/USD) Next Possible Move?
🔍 4-Hour Chart Analysis:
Trend: The price was in an uptrend, but a potential reversal has formed.
✅Key Bearish Signal: The presence of an Evening Star candlestick pattern at resistance (~$3,038) signals a potential trend reversal.
✅ Moving Averages:
✅ 50 EMA (Exponential Moving Average): The price is testing this level as support.
✅ 200 EMA : Positioned lower, suggesting that the long-term trend is still bullish, but short-term weakness is visible.
📉 Support Levels:
✅$3,005 (Minor Support)
✅$2,981 (Stronger Support)
📉 Resistance Levels:
✅$3,038 (Key Resistance)
🔹 Summary:
The formation of an Evening Star at resistance suggests a potential downtrend unless the price strongly holds above the 50 EMA. A breakdown of $3,005 could accelerate selling toward $2,981.
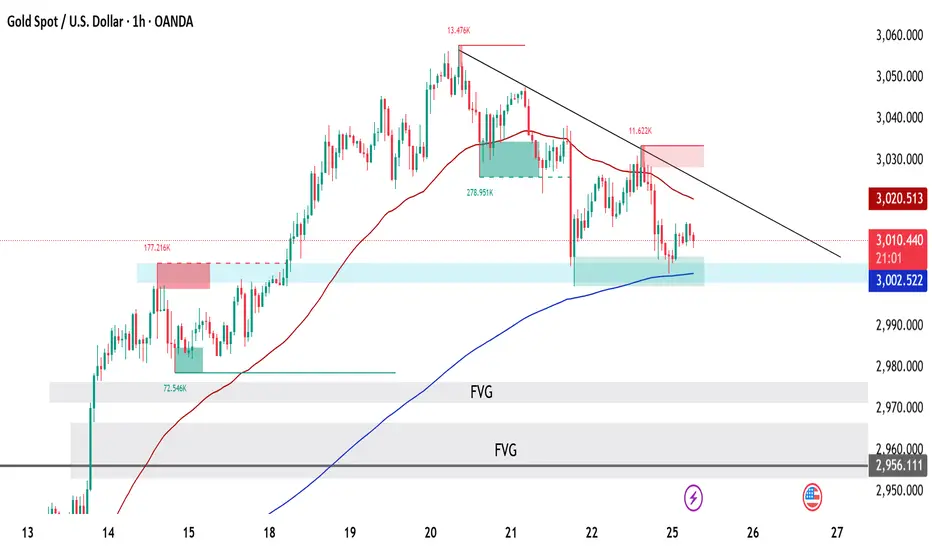
🔍 1-Hour Chart Analysis:
📊Key Observations:
Trendline Resistance : A descending trendline is pushing prices lower.
50 EMA Resistance : Price is failing to break above the 50 EMA, confirming selling pressure.
🚨 200 EMA Support : Price is holding above the 200 EMA, acting as a dynamic support.
🚨 Point of Interest (POI) Zone : The blue-shaded area is a key demand zone, where buying pressure might increase.
🚨 Fair Value Gap (FVG) Below: There’s an imbalance below $2,981, which price may fill before rebounding.
🔹 Summary :
If the 200 EMA support at $3,002 fails, a move toward the FVG zone near $2,981 is likely. A break above the trendline resistance and 50 EMA would signal a possible bullish reversal.
🔍 15-Minute Chart Analysis:
📊Key Observations:
📉 Bearish Crossover: The 50 EMA crossed below the 200 EMA, a bearish sign indicating selling pressure.
📉 Lower Highs Formation : Price is making lower highs, respecting the trendline resistance.
📉 Support Zone Holding : The blue POI level is still acting as a temporary support.
🔹 Summary:
The short-term momentum is bearish, as indicated by the EMA crossover and trendline rejection. However, if buyers step in at the POI level, a short-term bounce may occur. If support at $2,999-$3,002 breaks, expect further downside.
📌 Trading Plan & Key Levels to Watch
🟢 Bullish Scenario:
A break above the trendline and 50 EMA (~$3,020) could lead to a push toward $3,038.
A strong bounce from $2,981 (support level) could provide buying opportunities.
📍 Bearish Scenario:
A break below $3,002 (200 EMA support) may trigger a move toward $2,981.
If $2,981 breaks, the price could target the FVG area ($2,955 - $2,930).
📉 Conclusion
Short-Term Trend: Bearish unless the price reclaims $3,020+.
Key Support: $3,002, $2,981
Key Resistance: $3,020, $3,038
Strategy: Watch for a breakout above trendline for bullish confirmation or a break below $3,002 for bearish continuation.
👉 Always follow TP/SL to protect your capital and maximize profits!
Stay tuned for updates once the confirmations are in place!
Please support me with your likes and comments to motivate me to share more analysis with you and share your opinion about the possible trend of this chart with me !
📢 Best Regards , Silver Wolf Traders Community
Disclaimer: This is for educational purposes only.
Always trade responsibly and manage your risk effectively
Bitcoin (BTC/USD) Short Trade Setup – March 15, 2025This is a Bitcoin (BTC/USD) trading setup on a 30-minute timeframe from TradingView. Here's a breakdown of the analysis:
📌 Entry Price: 84,375
📌 Stop Loss: 85,500 (Red Zone - Risk Area 🚨)
📌 Take Profit Levels:
TP1: 83,429
TP2: 82,640
Final Target: 81,259
🔍 Analysis:
The trader is setting up a short position (expecting BTC to decline).
Risk-to-Reward Ratio (RRR) seems favorable, as the target is much lower than the stop loss.
If BTC drops below 83,429, further declines toward 81,259 are expected.
If BTC breaks above 85,500, the trade is invalidated.
🛑 Conclusion:
A bearish trade setup looking for BTC to decline. 📉
Watch for confirmation of downward movement before entering.

Gold On Monday💡Gold could breach $3,000 level soon, analyst says
💡Trumpdeclinedto predict if U.S. could face a recession
💡U.S. CPI data on Wednesday, PPI data on Thursday
15-Minute Chart Analysis
Key Zones:
Order Block (OB) at $2,895 - $2,900 – Strong demand zone
Order Block (OB) at $2,925 - $2,930 – Strong supply zone
Fair Value Gap (FVG) at $2,918 - $2,922 – Potential retracement area
📊Price Behavior:
Price is currently consolidating below the FVG area, which often acts as a magnet for price action.
📊 Conclusion: A potential bullish move may occur if price reclaims the FVG zone, targeting the OB at $2,925. Conversely, a break below $2,895 may trigger further downside pressure.
🔍1-Hour Chart Analysis
Key Resistance Levels:
$2,924 – Immediate resistance zone
$2,942 – Strong resistance with previous rejection
Key Support Levels:
$2,879 – Key support zone
$2,863 – Critical support below
Price Behavior: The market is moving in a consolidation phase, with multiple rejections from the resistance at $2,924.
Conclusion: The market is currently indecisive, consolidating between $2,900 and $2,924. A breakout in either direction may signal the next move.
🔍 4-Hour Chart Analysis
Key Resistance Levels:
$2,954 – Significant resistance zone
Key Support Levels:
$2,880 – Intermediate support
$2,846 – Major support zone
Market Condition: The market is clearly in a ranging phase between $2,880 and $2,925. This suggests indecision and a potential breakout on either side.
Conclusion: The range-bound structure favors breakout strategies. Monitoring volume and price action near these levels is crucial.
Trading Strategy Considerations
📌 Bullish Scenario
✅Wait for a breakout above $2,924 with strong volume confirmation.
📍Target: $2,942 or higher.
❌Stop Loss: Below $2,911 to manage risk.
📌 Bearish Scenario
✅Watch for a rejection at $2,924 or a breakdown below $2,900.
📍Target: $2,880 or lower.
❌Stop Loss: Above $2,924 for protection.
👉 Always follow TP/SL to protect your capital and maximize profits!
Stay tuned for updates once the confirmations are in place!
Please support me with your likes and comments to motivate me to share more analysis with you and share your opinion about the possible trend of this chart with me !
📢Best Regards , Silver Wolf Traders Community
Disclaimer: This is for educational purposes only.
Always trade responsibly and manage your risk effectively

KAMATHOTEL |Upcoming Trade set up|Hey Family, there is a one more stock Which is showing a great opportunity.
Key Points:-
* Formation of Range Bound Pattern in Daily TF.
* From Apr 2024 to Mar 2025 Tested & Moving Near Resistance Many times.
* It's Near resistance Zone and trying to Break Resistance Zone with good volume good closing required.
* Volume Accumulation (Volume is Rising).
* Got many DM about not uploading the idea those who want to trade and risk the capital they can take this risky trade. We have held off on publishing ideas on TradingView due to the bearish market trends observed over the past months.
What is your view please comment it down and also boost the idea this help to motivate us. We are Certified. All views shared on this channel are my personal opinion and is shared for educational purpose and should not be considered advise of any nature.

Coforge-A perfect watchlist stock!Coforge is an IT services company providing end-to-end software solutions and services and is among the top-20 Indian software exporters according to Screener data. Stock has give 20% compounded sales growth in last 5 years which is quite remarkable.
Hence, It can be a good stock to be kept in watchlist for medium to long term.
Stock had given breakout of cup and handle pattern in weekly time frame and is now retesting the same.
Stock has formed a kind of morning star pattern at the retest support zone. Need to watch if it sustains above this zone.
As you can see, retest zone also coincides with 50% fib retracement which makes it even stronger.
If we see good buying in this stock from here, we can see ATH levels soon and even bigger levels in coming years.
However, If stock goes below 61.8% retracement, it is not advisable to hold.

Breakdown in NIFTY...Nifty has broken it's channel support line (Lower Channel Level) on weekly closing basis. Nifty's next two support after breakdown are marked with green lines.
Disclaimer: This is for demonstration and educational purpose only. This is not buying or selling recommendations. I am not SEBI registered. Please consult your financial advisor before taking any trade.

GBPNZD - Channel Boundaries in Play! What’s Next?The weekly chart of GBPNZD shows price action respecting an ascending channel structure. The pair has been moving within a well-defined ascending channel since early 2023.
GBPNZD weekly chart highlights price action within an ascending channel structure with key levels in play. Watch for bullish opportunities near the support zone at 2.1400–2.1800 or bearish continuation if price breaks below this zone. What’s your bias? Let me know in the comments! #GBPNZD #Forex #TechnicalAnalysis
Disclaimer:
This analysis is for informational purposes only and should not be considered financial advice. Forex trading involves significant risk of loss and may not be suitable for all investors.

BEML - Confluence of Supports Suggests a Potential Reversal!The weekly chart of BEML indicates a potential reversal as the stock approaches a critical confluence of support levels. After a significant correction from its all-time high, the price is now testing key technical levels that could act as a strong base for a bullish reversal.
Key Observations:
1. 200-Week EMA Support:
- The price is currently hovering near the 200-week EMA, which has historically acted as a strong dynamic support zone in trending markets.
2. Fibonacci Retracement:
- The stock is approaching the 0.618 Fibonacci retracement level, which is widely regarded as a golden ratio for potential reversals during corrections.
3. Potential Bullish Reversal:
- If the stock holds above this critical support zone, it could initiate a reversal toward higher levels.
---
Let me know your thoughts in the comments! #BEML #TechnicalAnalysis #SwingTrading"
---
Disclaimer:
This analysis is for informational and educational purposes only and does not constitute financial advice. Trading involves risk, and past performance is not indicative of future results. Always conduct your own research and consult with a qualified financial advisor before making any investment decisions.

TCPL Packaging Ltd - Breakout Setup, Move is ON...#TCPLPACK trading above Resistance of 2747
Next Resistance is at 3613
Support is at 2365
Here are previous charts:
Chart is self explanatory. Levels of breakout, possible up-moves (where stock may find resistances) and support (close below which, setup will be invalidated) are clearly defined.
Disclaimer: This is for demonstration and educational purpose only. This is not buying or selling recommendations. I am not SEBI registered. Please consult your financial advisor before taking any trade.

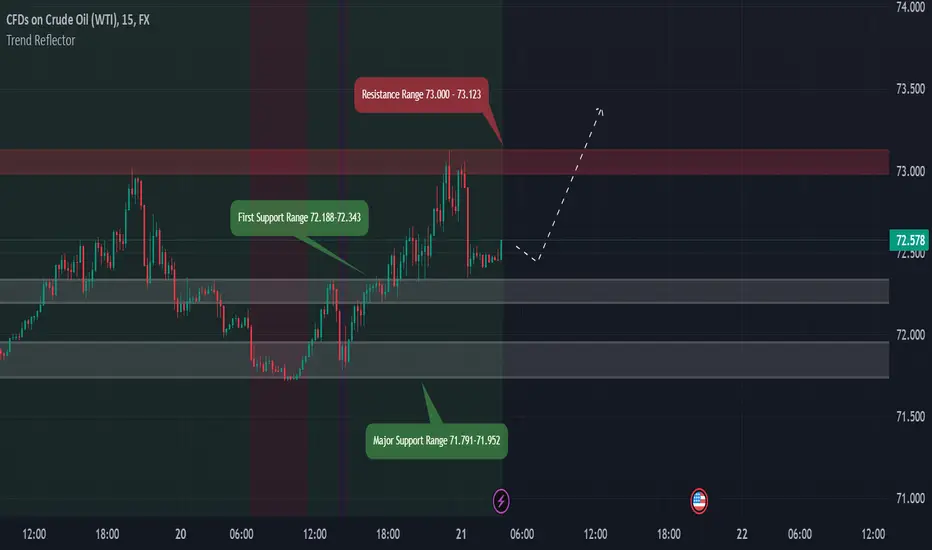
USOIL Chart analysis for Friday 21 Feb 25 Session 15M TFUSOIL last session closing was at 72.578 and made a high of 73.123 after studying it in higher TF i think if price comes downward then it's First Support Range is 72.188-72.343 if this range works as good support then we can see price upward movement from this range of support if it'll not sustain then Major Support Range is 71.791-71.952 it is good support it should sustain the price if it comes towards it in case it breaks then we can see bearish movement for the day , these support levels should work if we take a look in higher TF and our Trend Reflector also indicates bullish sentiment look for reversal price action if price comes to these levels , in case it breaks resistance zone of 73.000- 73.123 then we may get the level of 73.750 which is the next resistance , it's very clear look for bullish entry until major support breaks, it seems bullish for the day.
USOIL Chart Pattern for upcoming session's 15M TFWith accordance to 4H TF USOIL should fall to 71.500 to 71.200 with ease in this session but if we take a look to Daily TF we may see a price upper side when it touches 71.65-71.750 ,i've analysed it bit more it looks like if it goes to 71.500 then we should wait for 71.350 level to break and close below it and then short till 70.600 but in case it takes rejection at level of 71.350 - 71.500 then we can see 73.000 as our next target .

CreditAcess Grameen Standing near a crucial trendline support!Chart of Creditaccess is quite interesting.
Stock has a trendline support from which it has bounced multiple times in past.
Recently, stock has tried to bounce with very very very heavy volumes indicating big money getting exchange.
Given the history of the stock, we should at least expect 100% upside from this level. But it ccan also be a trap and stock can breakdown from here.
A safer level to watch is would be a weekly closing above 1110.
Support is 800 WCB for stock.
On upside, stock can go to 1480, 1710, 2000++
Very very risky. It can be a bottom fishing or a trap.
Idea shared for educational purposes only. We all should just watch what will happen from here and learn from it.

Natural Gas Confirm Targets 400 Natural Gas Price Analysis and Outlook
As of February 14, 2025, natural gas (NG) prices have exhibited significant volatility, influenced by various market dynamics.
Technical Analysis
Current Price Range : The latest support level for NG prices is identified between ₹286 and ₹293 per unit.
Major Support Level : A more substantial support zone exists between ₹250 and ₹260, indicating strong buying interest at these levels.
Major Resistance Level : On the upside, significant resistance is observed between ₹410 and ₹420, which may act as a barrier to price increases.
With increasing power demand, cold weather, rising forecasts, and strong exports, natural gas prices are likely to go up in the near future

Gold Next Target 3000$ ?Key points: fundamental
⚡Trump raises tariffs on steel and aluminum imports
⚡Bullion hits record high of $2,942.70 per ounce
⚡Gold bulls lock in $3,000/oz milestone in sight
📊 Market Overview:
Gold continues to break all-time highs, currently trading around $2940 - $2942. Despite a temporary pause at this resistance level, geopolitical uncertainty and economic conditions suggest that gold could soon reach the psychological $3000 mark .
✅ Trend Analysis:
The overall trend remains bullish, with price following an ascending trendline (dashed).
Strong buying momentum is visible, as price has made higher highs and higher lows.
Final Thoughts:
🚀 Gold remains bullish, but traders should watch how price reacts around key Fibonacci levels and the trendline.
📊 A break above $2,931 can push price higher, while a rejection could lead to a pullback before another bullish move.
📢 Keep an eye on key economic events (seen on chart) that may impact volatility!
Would you like me to suggest entry/exit points based on your strategy? 🎯
👉 Always follow TP/SL to protect your capital and maximize profits!
Stay tuned for updates once the confirmations are in place!
Please support me with your likes and comments to motivate me to share more analysis with you and share your opinion about the possible trend of this chart with me !
📢Best Regards , Silver Wolf Traders Community
Disclaimer: This is for educational purposes only.
Always trade responsibly and manage your risk effectively

Gold Break All Time High Again And Again🌍 Market Overview: Gold Bullish Expansion
Continues bullish momentum, reaching a new All-Time High (ATH).
Driven by USD weakness and improved global sentiment.
Key Drivers:
🔹 Postponed Tariffs: Delay on tariffs for Canada & Mexico boosted investor confidence.
🔹 China's Retaliation: Symbolic tariff actions by China, with minimal real economic impact.
15-Minute Chart
• Key Observations:
o Strong bullish momentum is evident, with price repeatedly breaking previous highs.
o A key support zone is established around $2,840, reflecting strong buying interest.
o Recent bullish movement aligns with improved investor confidence due to postponed
tariffs on Canada & Mexico and symbolic Chinese tariff retaliation.
• Market Sentiment:
o Bullish sentiment is dominant, likely fueled by favorable
geopolitical and economic developments.
o Immediate resistance is near the all-time high levels;
a clear breakout could indicate further upside.
________________________________________
4-Hour Chart
🚀 Key Observations:
Price is trading within an upward parallel channel, confirming a consistent bullish trend.
A breakout and successful retest of the upper boundary of the channel signals potential continuation of the bullish move.
The price has established higher highs and higher lows, indicating a strong uptrend.
Technical Levels:
Resistance: Near $2,860-$2,865 (current high levels).
Support: $2,820 (middle channel boundary).
________________________________________
Conclusion:
• Overall Bias: Strongly bullish in both short and medium time frames.
• Trading Strategy:
o 🔵For buyers: Consider entries on pullbacks toward $2,840-$2,845 (support zone).
o For breakout traders: A clear break above $2,865 with strong volume may
present an opportunity to ride the trend.
o For risk management: Place stop-loss below $2,820,
as a breach could indicate a potential reversal.
⚡️The Result?
👉Gold continues to break records, hitting 2848 - 2850 this morning, a key Fibonacci
Extension (FE) resistance zone. However, selling pressure remains weak, and price
action still favors bulls. NO FOMO SELL at this level!
👉 Always follow TP/SL to protect your capital and maximize profits!
Stay tuned for updates once the confirmations are in place !
Please support me with your likes and comments to motivate me to share more analysis with you and share your opinion about the possible trend of this chart with me !
📢 Best Regards , Silver Wolf Traders Community
Disclaimer: This is for educational purposes only.
Always trade responsibly and manage your risk effectively

Tata Motors-2-Chart AnalysisTata motors CMP:786.45; RSI: 36.35;
TATAMOTORS has completed 5 wave impulsive -Primary Bull cycle phase on weekly chart basis and now in corrective of ABC wave in formation . Corrective Wave-A has bottomed out and wave-B may give a swing trade opportunity for aggressive trader . This wave-B may take the Tata Motors shares at levels of 969-980 levels.
In Long term view is still avoid and fresh entry is suggested only for swing trade.
On daily chart basis, also 5 wave structure has formed as identified in chart structure, It suggest script will now reverse as it has entered wave-a formation.
Chart structure suggest a swing trade is open. The key crucial levels are listed below
Swing Trade Target 1: 969-980; Target 2: 1000-1020.
Stop Loss : 710
✅ For more trading ideas like this, please like, share, and follow my Idea Stream ✅

Analysis Of Gold (XAUUSD)💡 Key Economic Updates for the Week:
Nonfarm Payrolls (Friday):
Expected to indicate solid job growth.
Likely to influence USD strength.
Impact on Gold: May react inversely to USD performance based on labor market data.
ISM Services PMI (Thursday):
Provides insights into economic activity and inflation trends.
Federal Reserve Watch:
Traders will monitor speeches from Fed officials for hints on future rate decisions.
________________________________________
📊 1. Trend Analysis:
• Higher Timeframe (4H Chart):
o The price is trading within an ascending channel (marked by red trendlines),
indicating a bullish structure overall.
o However, the recent rejection from the upper boundary of the channel and
subsequent pullback suggests a potential retracement phase.
• Lower Timeframe (1H and 15M Charts):
o The price has entered a significant demand zone (highlighted in light blue)
after breaking below a minor consolidation range.
o Fibonacci retracement levels are being used to determine possible
Take Profit (TP) levels during the pullback.
________________________________________
2. Key Levels Identified:
• Resistance Levels (Supply Zones):
o $2,788–$2,790 (Red Zone):
A strong supply area where price has rejected multiple times.
This zone aligns with liquidity above recent highs.
• Immediate Resistance:
o $2,796 (Liquidity Zone):
A potential target if price attempts to retest liquidity near this level.
________________________________________
• 📊 Support Levels (Demand Zones):
o $2,764 (Fib TP1):
This is the first target level from Fibonacci retracement analysis.
o $2,751.5 (Fib TP2):
A deeper retracement target, aligning with a significant
point of interest (POI) on the chart.
o Channel Support (~$2,750):
The lower boundary of the ascending channel, acting as dynamic support.
________________________________________
⚠️ Possible Scenarios:
1. Bullish Scenario:
o If price holds above $2,764 (Fib TP1), expect a reversal toward
$2,788–$2,790 (supply zone) or even the liquidity zone at $2,796.
2. Bearish Scenario:
o If price breaks below $2,764, further downside toward $2,751.5 (Fib TP2) or
the ascending channel support near $2,750 is likely.
________________________________________
4. Key Takeaways:
• Short-Term Levels:
o Support: $2,764, $2,751.5, and $2,750.
o Resistance: $2,788, $2,790, and $2,796.
• Mid-Term Levels:
o Focus on how the price reacts at $2,764 and the ascending channel's
lower boundary for clearer direction.
________________________________________
👉 Always follow TP/SL to protect your capital and maximize profits!
Stay tuned for updates once the confirmations are in place!
Please support me with your likes and comments to motivate me to share more analysis with you and share your opinion about the possible trend of this chart with me !
📢Best Regards , Silver Wolf Traders Community
Disclaimer: This is for educational purposes only.
Always trade responsibly and manage your risk effectively

BTC#6: SW is uncomfortable but coming to the breakthrough.💎 💎 💎 Plan #5 first helps you make a profit. Please leave a comment and tag your friends' names to share. 💎 💎 💎
1️⃣ ** Basic analysis: **
📊 Trump signed the executive command on cryptocurrencies: Clarifying the framework of management and discovery of national cryptocurrency reserves
Buffett of Buffett's Berkshire Hathaway is gradually grasping cryptocurrencies.
🚀 Ohio state proposes a Bitcoin reserve bill
📌 A series of information that brings optimistic psychology to the cryptocurrency market in general and BTC in particular.
2️⃣ ** Technical analysis: **
🔹 ** Frame D **: The price is still swing in the past few days
🔹 ** H4 **: Price structure is still increasing and has not changed.
🔹 ** Frame H1 **: The price is still swing in the triangle and progresses to the breakthrough
3️⃣ ** Transaction plan: **
⛔ This is the SW area that is not suitable for the command. It is difficult to predict the price line in the current area. Control greed.
✅ My personal opinion that about the structure of large and small frame prices is increasing. If there is a structure, we can confirm about a adjustment beat. The current trend should wait for Buy when the price is important.
💪 ** Wish you successful transactions! **
📌 Any questions please contact directly. I am ready to answer for free
#trading #trade #tradeindia #newtrader #newbie #Blockchain #Forex #tradingView #plants #trader #tradingforex #btcusd #bitcoin

HDFC stock Buy Sell or Hold ? HDFC Bank Stock: Is It Better to Buy Before or After the Union Budget
Support and Resistance Levels for HDFC Bank Stock
Support Level:
The major support for HDFC Bank is around ₹1550.
Until the Union Budget 2025, the market and HDFC Bank stock may show some upward momentum.
For now, you can consider buying the stock with ₹1600 as a support level.
Resistance Level:
The major resistance is at ₹1770.
There is a possibility of reaching this target near the resistance level.
If a weekly candle closes above ₹1770, the stock could gain further momentum.
Post the Union Budget, if HDFC Bank holds above the major support, the stock can be held for the long term. Keep a close watch on HDFC Bank and track these critical levels.
Why Buy Before the Budget?
Chance to Gain Early: Stocks often go up before the budget due to positive market sentiment.
Why Buy After the Budget?
Better Deals: If the stock price drops after the budget, you can buy at a lower price.
#HDFCBank #StockMarket #SupportResistance #UnionBudget2025 #InvestmentTips

BankNifty Analysis
Bank Nifty is currently facing resistance at 49,650. If it breaks above this level and moves past 49,750 , it may turn bullish. The 49,650 level will then act as a support, helping the price to stay up.
Key Levels:
Resistance Level: 49,650 (Current Trend Line)
Breakout Level: 49,750 (Key psychological level for confirmation)
Support Level (if breakout occurs): 49,650 (Will act as a new support)

TARIL - Breakout Setup, Move is ON...#TARIL trading above Resistance of 1024
Next Resistance is at 1300
Support is at 846
Here are previous charts:
Chart is self explanatory. Levels of breakout, possible up-moves (where stock may find resistances) and support (close below which, setup will be invalidated) are clearly defined.
Disclaimer: This is for demonstration and educational purpose only. This is not buying or selling recommendations. I am not SEBI registered. Please consult your financial advisor before taking any trade.
