CreditAcess Grameen Standing near a crucial trendline support!Chart of Creditaccess is quite interesting.
Stock has a trendline support from which it has bounced multiple times in past.
Recently, stock has tried to bounce with very very very heavy volumes indicating big money getting exchange.
Given the history of the stock, we should at least expect 100% upside from this level. But it ccan also be a trap and stock can breakdown from here.
A safer level to watch is would be a weekly closing above 1110.
Support is 800 WCB for stock.
On upside, stock can go to 1480, 1710, 2000++
Very very risky. It can be a bottom fishing or a trap.
Idea shared for educational purposes only. We all should just watch what will happen from here and learn from it.
Chartanalysis

Natural Gas Confirm Targets 400 Natural Gas Price Analysis and Outlook
As of February 14, 2025, natural gas (NG) prices have exhibited significant volatility, influenced by various market dynamics.
Technical Analysis
Current Price Range : The latest support level for NG prices is identified between ₹286 and ₹293 per unit.
Major Support Level : A more substantial support zone exists between ₹250 and ₹260, indicating strong buying interest at these levels.
Major Resistance Level : On the upside, significant resistance is observed between ₹410 and ₹420, which may act as a barrier to price increases.
With increasing power demand, cold weather, rising forecasts, and strong exports, natural gas prices are likely to go up in the near future

Gold Next Target 3000$ ?Key points: fundamental
⚡Trump raises tariffs on steel and aluminum imports
⚡Bullion hits record high of $2,942.70 per ounce
⚡Gold bulls lock in $3,000/oz milestone in sight
📊 Market Overview:
Gold continues to break all-time highs, currently trading around $2940 - $2942. Despite a temporary pause at this resistance level, geopolitical uncertainty and economic conditions suggest that gold could soon reach the psychological $3000 mark .
✅ Trend Analysis:
The overall trend remains bullish, with price following an ascending trendline (dashed).
Strong buying momentum is visible, as price has made higher highs and higher lows.
Final Thoughts:
🚀 Gold remains bullish, but traders should watch how price reacts around key Fibonacci levels and the trendline.
📊 A break above $2,931 can push price higher, while a rejection could lead to a pullback before another bullish move.
📢 Keep an eye on key economic events (seen on chart) that may impact volatility!
Would you like me to suggest entry/exit points based on your strategy? 🎯
👉 Always follow TP/SL to protect your capital and maximize profits!
Stay tuned for updates once the confirmations are in place!
Please support me with your likes and comments to motivate me to share more analysis with you and share your opinion about the possible trend of this chart with me !
📢Best Regards , Silver Wolf Traders Community
Disclaimer: This is for educational purposes only.
Always trade responsibly and manage your risk effectively

Gold Break All Time High Again And Again🌍 Market Overview: Gold Bullish Expansion
Continues bullish momentum, reaching a new All-Time High (ATH).
Driven by USD weakness and improved global sentiment.
Key Drivers:
🔹 Postponed Tariffs: Delay on tariffs for Canada & Mexico boosted investor confidence.
🔹 China's Retaliation: Symbolic tariff actions by China, with minimal real economic impact.
15-Minute Chart
• Key Observations:
o Strong bullish momentum is evident, with price repeatedly breaking previous highs.
o A key support zone is established around $2,840, reflecting strong buying interest.
o Recent bullish movement aligns with improved investor confidence due to postponed
tariffs on Canada & Mexico and symbolic Chinese tariff retaliation.
• Market Sentiment:
o Bullish sentiment is dominant, likely fueled by favorable
geopolitical and economic developments.
o Immediate resistance is near the all-time high levels;
a clear breakout could indicate further upside.
________________________________________
4-Hour Chart
🚀 Key Observations:
Price is trading within an upward parallel channel, confirming a consistent bullish trend.
A breakout and successful retest of the upper boundary of the channel signals potential continuation of the bullish move.
The price has established higher highs and higher lows, indicating a strong uptrend.
Technical Levels:
Resistance: Near $2,860-$2,865 (current high levels).
Support: $2,820 (middle channel boundary).
________________________________________
Conclusion:
• Overall Bias: Strongly bullish in both short and medium time frames.
• Trading Strategy:
o 🔵For buyers: Consider entries on pullbacks toward $2,840-$2,845 (support zone).
o For breakout traders: A clear break above $2,865 with strong volume may
present an opportunity to ride the trend.
o For risk management: Place stop-loss below $2,820,
as a breach could indicate a potential reversal.
⚡️The Result?
👉Gold continues to break records, hitting 2848 - 2850 this morning, a key Fibonacci
Extension (FE) resistance zone. However, selling pressure remains weak, and price
action still favors bulls. NO FOMO SELL at this level!
👉 Always follow TP/SL to protect your capital and maximize profits!
Stay tuned for updates once the confirmations are in place !
Please support me with your likes and comments to motivate me to share more analysis with you and share your opinion about the possible trend of this chart with me !
📢 Best Regards , Silver Wolf Traders Community
Disclaimer: This is for educational purposes only.
Always trade responsibly and manage your risk effectively

Tata Motors-2-Chart AnalysisTata motors CMP:786.45; RSI: 36.35;
TATAMOTORS has completed 5 wave impulsive -Primary Bull cycle phase on weekly chart basis and now in corrective of ABC wave in formation . Corrective Wave-A has bottomed out and wave-B may give a swing trade opportunity for aggressive trader . This wave-B may take the Tata Motors shares at levels of 969-980 levels.
In Long term view is still avoid and fresh entry is suggested only for swing trade.
On daily chart basis, also 5 wave structure has formed as identified in chart structure, It suggest script will now reverse as it has entered wave-a formation.
Chart structure suggest a swing trade is open. The key crucial levels are listed below
Swing Trade Target 1: 969-980; Target 2: 1000-1020.
Stop Loss : 710
✅ For more trading ideas like this, please like, share, and follow my Idea Stream ✅

Analysis Of Gold (XAUUSD)💡 Key Economic Updates for the Week:
Nonfarm Payrolls (Friday):
Expected to indicate solid job growth.
Likely to influence USD strength.
Impact on Gold: May react inversely to USD performance based on labor market data.
ISM Services PMI (Thursday):
Provides insights into economic activity and inflation trends.
Federal Reserve Watch:
Traders will monitor speeches from Fed officials for hints on future rate decisions.
________________________________________
📊 1. Trend Analysis:
• Higher Timeframe (4H Chart):
o The price is trading within an ascending channel (marked by red trendlines),
indicating a bullish structure overall.
o However, the recent rejection from the upper boundary of the channel and
subsequent pullback suggests a potential retracement phase.
• Lower Timeframe (1H and 15M Charts):
o The price has entered a significant demand zone (highlighted in light blue)
after breaking below a minor consolidation range.
o Fibonacci retracement levels are being used to determine possible
Take Profit (TP) levels during the pullback.
________________________________________
2. Key Levels Identified:
• Resistance Levels (Supply Zones):
o $2,788–$2,790 (Red Zone):
A strong supply area where price has rejected multiple times.
This zone aligns with liquidity above recent highs.
• Immediate Resistance:
o $2,796 (Liquidity Zone):
A potential target if price attempts to retest liquidity near this level.
________________________________________
• 📊 Support Levels (Demand Zones):
o $2,764 (Fib TP1):
This is the first target level from Fibonacci retracement analysis.
o $2,751.5 (Fib TP2):
A deeper retracement target, aligning with a significant
point of interest (POI) on the chart.
o Channel Support (~$2,750):
The lower boundary of the ascending channel, acting as dynamic support.
________________________________________
⚠️ Possible Scenarios:
1. Bullish Scenario:
o If price holds above $2,764 (Fib TP1), expect a reversal toward
$2,788–$2,790 (supply zone) or even the liquidity zone at $2,796.
2. Bearish Scenario:
o If price breaks below $2,764, further downside toward $2,751.5 (Fib TP2) or
the ascending channel support near $2,750 is likely.
________________________________________
4. Key Takeaways:
• Short-Term Levels:
o Support: $2,764, $2,751.5, and $2,750.
o Resistance: $2,788, $2,790, and $2,796.
• Mid-Term Levels:
o Focus on how the price reacts at $2,764 and the ascending channel's
lower boundary for clearer direction.
________________________________________
👉 Always follow TP/SL to protect your capital and maximize profits!
Stay tuned for updates once the confirmations are in place!
Please support me with your likes and comments to motivate me to share more analysis with you and share your opinion about the possible trend of this chart with me !
📢Best Regards , Silver Wolf Traders Community
Disclaimer: This is for educational purposes only.
Always trade responsibly and manage your risk effectively

BTC#6: SW is uncomfortable but coming to the breakthrough.💎 💎 💎 Plan #5 first helps you make a profit. Please leave a comment and tag your friends' names to share. 💎 💎 💎
1️⃣ ** Basic analysis: **
📊 Trump signed the executive command on cryptocurrencies: Clarifying the framework of management and discovery of national cryptocurrency reserves
Buffett of Buffett's Berkshire Hathaway is gradually grasping cryptocurrencies.
🚀 Ohio state proposes a Bitcoin reserve bill
📌 A series of information that brings optimistic psychology to the cryptocurrency market in general and BTC in particular.
2️⃣ ** Technical analysis: **
🔹 ** Frame D **: The price is still swing in the past few days
🔹 ** H4 **: Price structure is still increasing and has not changed.
🔹 ** Frame H1 **: The price is still swing in the triangle and progresses to the breakthrough
3️⃣ ** Transaction plan: **
⛔ This is the SW area that is not suitable for the command. It is difficult to predict the price line in the current area. Control greed.
✅ My personal opinion that about the structure of large and small frame prices is increasing. If there is a structure, we can confirm about a adjustment beat. The current trend should wait for Buy when the price is important.
💪 ** Wish you successful transactions! **
📌 Any questions please contact directly. I am ready to answer for free
#trading #trade #tradeindia #newtrader #newbie #Blockchain #Forex #tradingView #plants #trader #tradingforex #btcusd #bitcoin

HDFC stock Buy Sell or Hold ? HDFC Bank Stock: Is It Better to Buy Before or After the Union Budget
Support and Resistance Levels for HDFC Bank Stock
Support Level:
The major support for HDFC Bank is around ₹1550.
Until the Union Budget 2025, the market and HDFC Bank stock may show some upward momentum.
For now, you can consider buying the stock with ₹1600 as a support level.
Resistance Level:
The major resistance is at ₹1770.
There is a possibility of reaching this target near the resistance level.
If a weekly candle closes above ₹1770, the stock could gain further momentum.
Post the Union Budget, if HDFC Bank holds above the major support, the stock can be held for the long term. Keep a close watch on HDFC Bank and track these critical levels.
Why Buy Before the Budget?
Chance to Gain Early: Stocks often go up before the budget due to positive market sentiment.
Why Buy After the Budget?
Better Deals: If the stock price drops after the budget, you can buy at a lower price.
#HDFCBank #StockMarket #SupportResistance #UnionBudget2025 #InvestmentTips

BankNifty Analysis
Bank Nifty is currently facing resistance at 49,650. If it breaks above this level and moves past 49,750 , it may turn bullish. The 49,650 level will then act as a support, helping the price to stay up.
Key Levels:
Resistance Level: 49,650 (Current Trend Line)
Breakout Level: 49,750 (Key psychological level for confirmation)
Support Level (if breakout occurs): 49,650 (Will act as a new support)

TARIL - Breakout Setup, Move is ON...#TARIL trading above Resistance of 1024
Next Resistance is at 1300
Support is at 846
Here are previous charts:
Chart is self explanatory. Levels of breakout, possible up-moves (where stock may find resistances) and support (close below which, setup will be invalidated) are clearly defined.
Disclaimer: This is for demonstration and educational purpose only. This is not buying or selling recommendations. I am not SEBI registered. Please consult your financial advisor before taking any trade.

Kovai Medical Center & Hospital Ltd - Breakout Setup, Move is ON#KOVAI trading above Resistance of 5727
Next Resistance is at 6757
Support is at 4807
Here are previous charts:
Chart is self explanatory. Levels of breakout, possible up-moves (where stock may find resistances) and support (close below which, setup will be invalidated) are clearly defined.
Disclaimer: This is for demonstration and educational purpose only. This is not buying or selling recommendations. I am not SEBI registered. Please consult your financial advisor before taking any trade.

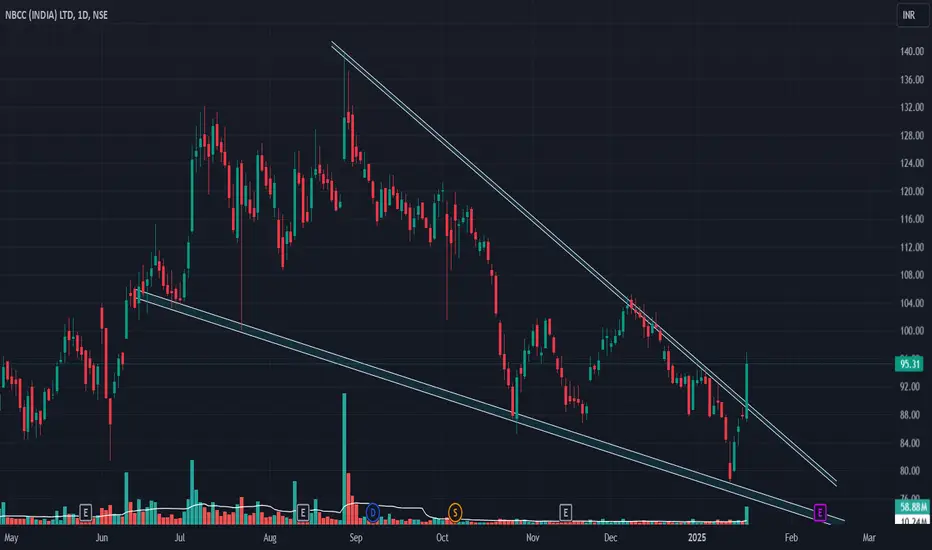
NBCC INDIADisclaimer : Trade at your own risk this is not buy - sell recommendation, I'm not sebi registered.
NBCC looks very bullish on daily, weekly and monthly charts keep on radar.
Pearl Global Industries Limited - Breakout Setup, Move is ON...#PGIL trading above Resistance of 1595
Next Resistance is at 2352
Support is at 1095
Here are previous charts:
Chart is self explanatory. Levels of breakout, possible up-moves (where stock may find resistances) and support (close below which, setup will be invalidated) are clearly defined.
Disclaimer: This is for demonstration and educational purpose only. This is not buying or selling recommendations. I am not SEBI registered. Please consult your financial advisor before taking any trade.

Goldiam International Ltd - Breakout Setup, Move is ON...#GOLDIAM trading above Resistance of 491
Next Resistance is at 728
Support is at 343
Here are previous charts:
Chart is self explanatory. Levels of breakout, possible up-moves (where stock may find resistances) and support (close below which, setup will be invalidated) are clearly defined.
Disclaimer: This is for demonstration and educational purpose only. This is not buying or selling recommendations. I am not SEBI registered. Please consult your financial advisor before taking any trade.

Goldiam International Ltd - Breakout Setup, Move is ON...#GOLDIAM trading above Resistance of 395
Next Resistance is at 491
Support is at 299
Here are previous charts:
Chart is self explanatory. Levels of breakout, possible up-moves (where stock may find resistances) and support (close below which, setup will be invalidated) are clearly defined.
Disclaimer: This is for demonstration and educational purpose only. This is not buying or selling recommendations. I am not SEBI registered. Please consult your financial advisor before taking any trade.

ASHAPURMIN is Set to rally! Time to go Long!Hey Family, there is a one more stock Which is showing a great opportunity.
Key Points:-
* Formation of Ascending Triangle Pattern in Daily TF.
* From Dec 2023 to Jan 2025 Tested Resistance Many times.
* It's Break resistance Zone and trying to Sustain above Resistance Zone with good volume good closing required.
* Volume Accumulation (Volume is Rising).
What is your view please comment it down and also boost the idea this help to motivate us. We are Certified. All views shared on this channel are my personal opinion and is shared for educational purpose and should not be considered advise of any nature.

INDIACEM Breakout Possible with a good upside potentialHey Family, there is a one more stock Which is showing a great opportunity.
Key Points:-
* Formation of Rectangular box Pattern in Daily TF.
* From Jul 2024 to Jan 2025 its in range.
* From Jul 2024 to Jan 2025 Tested & Moving Near Resistance Many times.
* It's Near resistance Zone and trying to Break Resistance Zone Only Enter when good volume good closing.
* Volume is not Rising.
* We have held off on publishing ideas on TradingView due to the bearish market trends observed over the past month..
What is your view please comment it down and also boost the idea this help to motivate us. We are Certified. All views shared on this channel are my personal opinion and is shared for educational purpose and should not be considered advise of any nature.

FLAG PATTERN BREAKOUTEID Parry has given flag pattern breakout. The breakout candle is supported by rising volume indicating a strong momentum for short term and mid momentum also long term momentum is good. the R:R we can achieve in the trade is 1:4.

MAN INFRA: potential upside move<Man infra has successfully given breakout of two good chart patterns.
<Flag and pole which is clearly visible.
<Triangle pattern which can be seen if we draw a line from top red candle to the <breakout candle respecting all the wicks.
<We are learning this trade respecting the flag pattern.
<The stock has given upside breakout with good volume indicating bulls hold.
<The risk reward ratio for the trade is 1:5.

Stock Analysis: #ZOMATO – The Ride Seems to Have Ended (For Now)Hello, Traders! 👋
#ZOMATO is showing signs of weakness after facing rejection at its all-time high (ATH). Here’s the technical breakdown:
📉 Technical Overview:
🔹 The stock is trading below its long-term 150-day EMA, a bearish signal.
🔹 Critical moving averages are sloping downward, further confirming the negative trend.
🔹 Rejection at ATH suggests the bullish momentum has paused or reversed for the time being.
💡 My View:
I was holding this stock, but given the current setup, it seems the ride has ended for now. I’ll be watching for stabilization or signs of a reversal before reconsidering any position.
⚠️ Disclaimer:
🔹 I am not a SEBI-registered advisor.
🔹 This analysis reflects my personal views and is not a recommendation to buy or sell.
🔹 Shared for learning purposes only—please do your own research or consult a professional.
What’s your take on #ZOMATO? Let’s discuss!
#TradingView #StockAnalysis #MomentumTrading #ZOMATO
ZLong

flag pattern breakout Pitti Engineering has broke the flag pattern. This trade is little risky because the candle next to breakout candle has shown resistance to bulls and also the volume is very high but since it is Doji candle there is indecisiveness. To swing high in this trade entry could be made tomorrow or we can wait for this week's closing. Breakout candle has good volume.

Coromandel International - Breakout Setup, Move is ON...#COROMANDEL trading above Resistance of 1938
Next Resistance is at 2310
Support is at 1545
Here are previous charts:
Chart is self explanatory. Levels of breakout, possible up-moves (where stock may find resistances) and support (close below which, setup will be invalidated) are clearly defined.
Disclaimer: This is for demonstration and educational purpose only. This is not buying or selling recommendations. I am not SEBI registered. Please consult your financial advisor before taking any trade.

Blue Star Ltd - Breakout Setup, Move is ON...#BLUESTARCO trading above Resistance of 2154
Next Resistance is at 2798
Support is at 1782
Here are previous charts:
Chart is self explanatory. Levels of breakout, possible up-moves (where stock may find resistances) and support (close below which, setup will be invalidated) are clearly defined.
Disclaimer: This is for demonstration and educational purpose only. This is not buying or selling recommendations. I am not SEBI registered. Please consult your financial advisor before taking any trade.
