Federal BankFederal Bank
Time frame - Monthly
Study - Inverted Head and Shoulder Pattern, Also good volume ticks seen on monthly chart.
Daily Chart - Breakout given above 128
Fundamentals - Maximum profit gained all time high
Buy Range - 110-120
Target - 200 ++
SL - 82
This chart is for only educational purpose
Chartanalysis

Texmaco Rail and Engineering - Breakout Setup, Move is ON...#TEXRAIL trading above Resistance of 241
Next Resistance is at 383
Support is at 154
Here are previous charts:
Chart is self explanatory. Levels of breakout, possible up-moves (where stock may find resistances) and support (close below which, setup will be invalidated) are clearly defined.
Disclaimer: This is for demonstration and educational purpose only. This is not buying or selling recommendations. I am not SEBI registered. Please consult your financial advisor before taking any trade.

MIC Electronics Ltd - Breakout Setup, Move is ON...#MICEL trading above Resistance of 82
Next Resistance is at 110
Support is at 55
Here are previous charts:
Chart is self explanatory. Levels of breakout, possible up-moves (where stock may find resistances) and support (close below which, setup will be invalidated) are clearly defined.
Disclaimer: This is for demonstration and educational purpose only. This is not buying or selling recommendations. I am not SEBI registered. Please consult your financial advisor before taking any trade.

OFSS - Breakout Setup, Move is ON...#OFSS trading above Resistance of 9759
Next Resistance is at 12911
Support is at 6606
Here are previous charts:
Chart is self explanatory. Levels of breakout, possible up-moves (where stock may find resistances) and support (close below which, setup will be invalidated) are clearly defined.
Disclaimer: This is for demonstration and educational purpose only. This is not buying or selling recommendations. I am not SEBI registered. Please consult your financial advisor before taking any trade.

BBTC - Breakout Setup, Move is ON...#BBTC trading above Resistance of 1776
Next Resistance is at 3091
Support is at 1461
Here is previous chart:
Chart is self explanatory. Levels of breakout, possible up-moves (where stock may find resistances) and support (close below which, setup will be invalidated) are clearly defined.
Disclaimer: This is for demonstration and educational purpose only. This is not buying or selling recommendations. I am not SEBI registered. Please consult your financial advisor before taking any trade.

Pnb Gilts Limited - Breakout Setup, Move is ON...#PNBGILTS trading above Resistance of 136
Next Resistance is at 180
Support is at 92
Here are previous charts:
Chart is self explanatory. Levels of breakout, possible up-moves (where stock may find resistances) and support (close below which, setup will be invalidated) are clearly defined.
Disclaimer: This is for demonstration and educational purpose only. This is not buying or selling recommendations. I am not SEBI registered. Please consult your financial advisor before taking any trade.

Texmaco Rail and Engineering - Long Setup, Move is ON...#TEXRAIL trading above Resistance of 154
Next Resistance is at 241
Support is at 123
Here are previous charts:
Chart is self explanatory. Levels of breakout, possible up-moves (where stock may find resistances) and support (close below which, setup will be invalidated) are clearly defined.
Disclaimer: This is for demonstration and educational purpose only. This is not buying or selling recommendations. I am not SEBI registered. Please consult your financial advisor before taking any trade.

Kddl Limited - Breakout Setup, Move is ON...#KDDL trading above Resistance of 3064
Next Resistance is at 4196
Support is at 2157
Here are previous charts:
Chart is self explanatory. Levels of breakout, possible up-moves (where stock may find resistances) and support (close below which, setup will be invalidated) are clearly defined.
Disclaimer: This is for demonstration and educational purpose only. This is not buying or selling recommendations. I am not SEBI registered. Please consult your financial advisor before taking any trade.

Gulf Oil Lubricants India Limited - Breakout Setup, Move is ON..#GULFOILLUB trading above Resistance of 1100
Next Resistance is at 1546
Support is at 925
Here are previous charts:
Chart is self explanatory. Levels of breakout, possible up-moves (where stock may find resistances) and support (close below which, setup will be invalidated) are clearly defined.
Disclaimer: This is for demonstration and educational purpose only. This is not buying or selling recommendations. I am not SEBI registered. Please consult your financial advisor before taking any trade.

Ntpc Limited- Breakout Setup, Move is ON...#NTPC trading above Resistance of 375
Next Resistance is at 515
Support is at 291
Here are previous charts:
Chart is self explanatory. Levels of breakout, possible up-moves (where stock may find resistances) and support (close below which, setup will be invalidated) are clearly defined.
Disclaimer: This is for demonstration and educational purpose only. This is not buying or selling recommendations. I am not SEBI registered. Please consult your financial advisor before taking any trade.

Black Box Ltd - Breakout Setup, Move is ON...#BBOX trading above Resistance of 293
Next Resistance is at 514
Support is at 217
Here are previous charts:
Chart is self explanatory. Levels of breakout, possible up-moves (where stock may find resistances) and support (close below which, setup will be invalidated) are clearly defined.
Disclaimer: This is for demonstration and educational purpose only. This is not buying or selling recommendations. I am not SEBI registered. Please consult your financial advisor before taking any trade.

Raymond - Breakout Setup, Move is ON...#RAYMOND trading above Resistance of 2676
Next Resistance is at 3621
Support is at 1734
Here are previous charts:
Chart is self explanatory. Levels of breakout, possible up-moves (where stock may find resistances) and support (close below which, setup will be invalidated) are clearly defined.
Disclaimer: This is for demonstration and educational purpose only. This is not buying or selling recommendations. I am not SEBI registered. Please consult your financial advisor before taking any trade.

Amara Raja Energy & Mobility Ltd - Breakout Setup, Move is ON...#ARE_M trading above Resistance of 1480
Next Resistance is at 2389
Support is at 970
Here is previous chart:
Chart is self explanatory. Levels of breakout, possible up-moves (where stock may find resistances) and support (close below which, setup will be invalidated) are clearly defined.
Disclaimer: This is for demonstration and educational purpose only. This is not buying or selling recommendations. I am not SEBI registered. Please consult your financial advisor before taking any trade.

Oracle Financial Services Software Ltd - Long Setup, Move is ON.#OFSS trading above Resistance of 6606
Next Resistance is at 9759
Support is at 4658
Here is previous chart:
Chart is self explanatory. Levels of breakout, possible up-moves (where stock may find resistances) and support (close below which, setup will be invalidated) are clearly defined.
Disclaimer: This is for demonstration and educational purpose only. This is not buying or selling recommendations. I am not SEBI registered. Please consult your financial advisor before taking any trade.

Breakout in Bombay Burmah Trading Corporation Limited...Chart is self explanatory. Levels of breakout, possible up-moves (where stock may find resistances) and support (close below which, setup will be invalidated) are clearly defined.
Disclaimer: This is for demonstration and educational purpose only. This is not buying or selling recommendations. I am not SEBI registered. Please consult your financial advisor before taking any trade.

Pnb Gilts Limited - Long Setup, Move is ON...#PNBGILTS trading above Resistance of 103
Next Resistance is at 136
Support is at 84
Here is previous chart:
Chart is self explanatory. Levels of breakout, possible up-moves (where stock may find resistances) and support (close below which, setup will be invalidated) are clearly defined.
Disclaimer: This is for demonstration and educational purpose only. This is not buying or selling recommendations. I am not SEBI registered. Please consult your financial advisor before taking any trade.

Kalyan Jewellers India Ltd - Long Setup, Move is ON...#KALYANKJIL trading above Resistance of 341
Next Resistance is at 463
Support is at 241
Here are previous charts:
Chart is self explanatory. Levels of breakout, possible up-moves (where stock may find resistances) and support (close below which, setup will be invalidated) are clearly defined.
Disclaimer: This is for demonstration and educational purpose only. This is not buying or selling recommendations. I am not SEBI registered. Please consult your financial advisor before taking any trade.

Kddl Limited - Long Setup, Move is ON...#KDDL trading above Resistance of 2359
Next Resistance is at 3064
Support is at 1830
Here are previous charts:
Chart is self explanatory. Entry, Resistances and Support are mentioned on the chart.
Disclaimer: This is for demonstration and educational purpose only. This is not buying or selling recommendations. I am not SEBI registered. Please consult your financial advisor before taking any trade.

Ganesha Ecosphere - Long Setup, Move is ON...#GANECOS trading above Resistance of 1025
Next Resistance is at 1363
Support is at 739
Here is previous chart:
Chart is self explanatory. Entry, Resistances and Support are mentioned on the chart.
Disclaimer: This is for demonstration and educational purpose only. This is not buying or selling recommendations. I am not SEBI registered. Please consult your financial advisor before taking any trade.

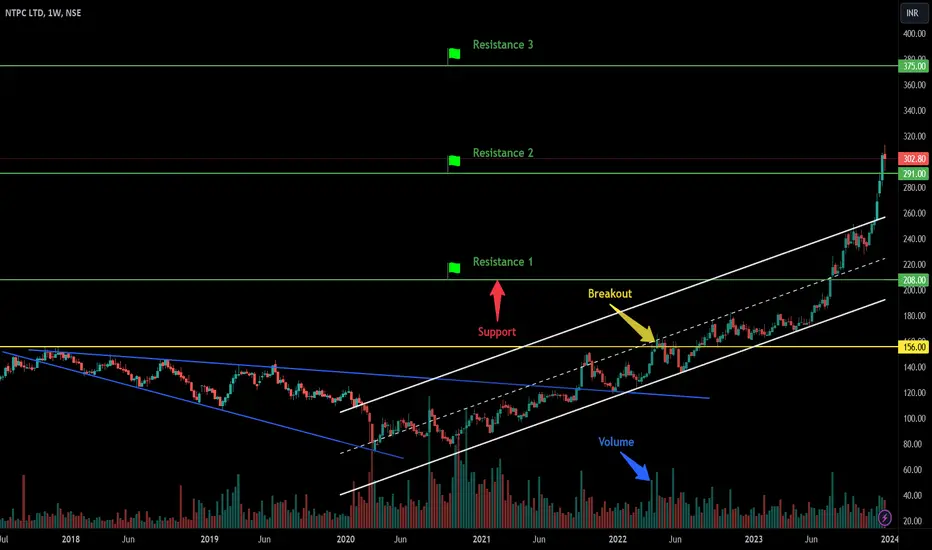
Ntpc Limited- Long Setup, Move is ON...#NTPC trading above Resistance of 291
Next Resistance is at 375
Support is at 208
Here are previous charts:
Chart is self explanatory. Levels of breakout, possible up-moves (where stock may find resistances) and support (close below which, setup will be invalidated) are clearly defined.
Disclaimer: This is for demonstration and educational purpose only. This is not buying or selling recommendations. I am not SEBI registered. Please consult your financial advisor before taking any trade.
Reliance Big Move AheadHey Family, there is a one more stock Which is showing a great opportunity.
Key Points:-
* Forming Ascending Triangle Pattern in daily TF.
* From Jan 2024 to June 2024 Moving in a 200-300 Points range.
* From Mar 2024 to June 2024 Tested Resistance Many times.
* It's Already Break resistance Zone and trying to Sustain Above Resistance Zone and follow up buying is coming.
* Volume Accumulation (Volume is Rising).
What is your view please comment it down and also boost the idea this help to motivate us. We are Certified. All views shared on this channel are my personal opinion and is shared for educational purpose and should not be considered advise of any nature. Minor Retest is Possible after big move.

Bullish Flag pattern breakout in BATAINDIABATA INDIA LTD
Key highlights: 💡⚡
✅On 1 Day Time Frame Stock Showing Breakout of Bullish Flag Pattern.
✅Strong Bullish Candlestick Form on this timeframe.
✅It can give movement up to the Breakout target of 1630+.
✅Can Go Long in this Stock by placing a stop loss below 1432-.

JaiCorp Ltd Forming Momentum for a big move Hey Family, there is a one more stock Which is showing a great opportunity.
Key Points:-
* Forming Pole & Flag Pattern in daily TF.
* Rectangular Box Pattern in week TF.
* From Oct 2023 to June 2024 Tested Resistance Many times.
* It's Near resistance Zone and trying to breakout.
* If Stock break's resistance zone then we can see a move to 500 & if Sustain above 500 then we can see move to 560 to 700, let's see breakout sustain or not.
What is your view please comment it down and also boost the idea this help to motivate us. We are Certified. All views shared on this channel are my personal opinion and is shared for educational purpose and should not be considered advise of any nature.
