Nifty 50 Price Structure Analysis [08/12/2025: Monday]Top-Down Nifty 50 Price Structure Analysis for 08th December 2025. The day is Monday.
(1) Monthly Time Frame:
Red paper umbrella candle. The body is smaller compared to the lower wick. So far, it is an indecisive market. The main trend is bullish, but the present scenario is indecisive. The major support zone is at 26100 and 26000. Major resistance is at 26300. The view is bullish to indecision.
(2) Weekly Time Frame:
Red paper umbrella candle. The body is smaller compared to the lower wick. There is no upper wick. Thus, there is good buyer participation. Looking at the combination of 3 candles, buyers (or bulls) are getting stronger. The lower wicks are getting longer every week. For the past 3 weeks, the price has been taking very good support at the zone (25850 - 25900). In the present scenario, levels 26100 and 26000 are major support zones. Major resistance is at 26300. Considering, past 8 weeks, the price is in the structure of higher highs and lower lows. Thus, bullishness is intact. Take no bearish trade until the price starts to trade below the zone of 26100 - 26050. Presently, the view is bullish to indecision. If the price keeps sustaining above the level 26200, then probably, the previous all-time high (ATH) will be breached.
(3) Daily Time Frame:
The past 2 days are green days. On 05th December price gave a 200-point bullish rally. However, price is still in the range of the bullish marubozu formed on 26th November (Wednesday). Price needs a stable movement above the level 26200. Presently, 3 levels have emerged as a strong support zone - 26100, 26050, and 26000. So, take no short position unless the price starts to trade below 26000. Any downward move should be doubted. The view is bullish to indecision as the previous ATH and level 26300 are very close.
(4) 30-Minute Time Frame:
The complex correction since 17th October 2025 continues. Presently, price is trying to trade in the upper zone of the rising channel. The direction of the complex correction is bullish but with high volatility and indecisive moves. A strong support zone is formed at the levels 26100 - 26000. A minor resistance is at 26200. Major resistance is at 26300 and the previous ATH (26277.35). Every down move should be doubted. Institutional bias is bullish. The view is bullish.
Event:
No expiries on Monday. No high-impact event. However, the U.S. Fed Interest Rate Decision is on 11th December (Thursday) - a high-impact event in the next week.
Bullish Scenario Set-Up:
(i) Price sustains above the opening price.
(ii) Price sustains above the level 26200 and shows promise of reaching levels 26277.35 (ATH) and level 26300.
Bearish Scenario Set-Up:
(i) Price sustains below the opening price.
(ii) Price starts to sustain below the level 26050 and starts to form a lower lows, lower highs structure below 26000.
No Trading Zone (NTZ): 26200 - 26100.
Expectations (Hypothesis and Insights from Trading Plan):
(i) Take bullish trades only. Price must start to trade above the level 26200.
(ii) Every down move should be doubted. Levels 26100 - 26050 are very strong support.
(iii) Be skeptical of executing trades in the first half of Monday, as level 26277.35 (previous ATH) and level 26300 are close. Also, in case of a gap up or a gap down, be very cautious. A clear price structure is needed for trend clarity.
(iv) Trade only when bullish/ bearish conditions are fulfilled. Otherwise, don't trade. Protect your resources.
NOTE:
"Mark your points. Trade your points. Price is God. Anything can happen. Therefore, trade what you see, not what you believe."
Happy Trading!
Chartanalysis

TATASTEEL 1 Day Time Frame 📌 Current status
Price is hovering around ₹166–167.
52‑week range: low ≈ ₹122.6, high ≈ ₹186.9.
✅ What This Means for Near‑Term Trading / Observation
As of now, the stock is in a neutral / consolidation phase — price sitting between support (~ ₹165) and resistance (~ ₹170–172).
A break below ~ ₹165 might open path toward ~₹163–164, or lower, depending on volume and market sentiment.
A break above ~ ₹170–172 — especially on good volume — could trigger upward movement toward ~₹180+ zones (with key watch on 52‑wk highs around ₹185–187).
Because we are closer to middle of the 52‑wk range rather than extremes, price volatility remains possible — so risk management (stop‑loss, position sizing) matters.

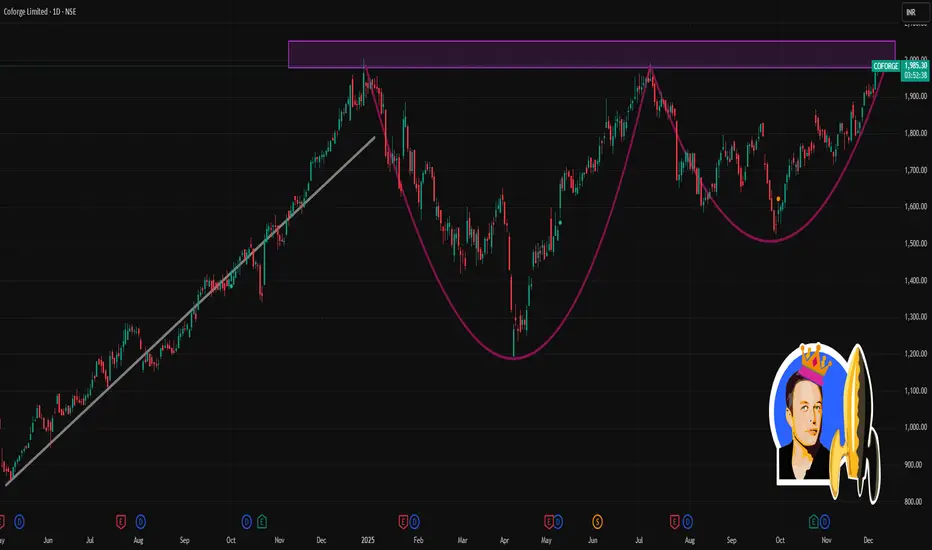
COFORGE 1 Day Time Frame 📈 Current Price & Range (as on recent close)
Last traded price: ~ ₹1,966.20
Day’s low–high: ~ ₹1,917.80 – ₹1,986.00
🧭 Key Moving‑Average & Technical Context
On daily chart, short‑ and medium‑term SMAs/EMAs (5‑, 10‑, 20‑, 50‑, 100‑, 200‑day) are all in “outperform” configuration — indicating bullish bias.
Other indicators on daily chart — RSI, MACD, Stochastic, ROC, CCI etc — are also showing strength (many in “outperform” zone).
⚠️ What to Monitor / What Can Happen
If Coforge breaks above ~₹1,986 with good volume — could extend higher, possibly retesting upper ranges near ₹2,000 (52‑week highs ~₹2,005).
If price falls below ~₹1,915 and fails to hold, next support zones around ~₹1,900 — and if that breaks, ~₹1,840‑₹1,850 becomes the important cushion.
Given strong moving‑average alignment plus bullish oscillator values, trend bias remains upward — but day‑to‑day volatility can still cause swings, so intraday trades should use tight stop‑loss.
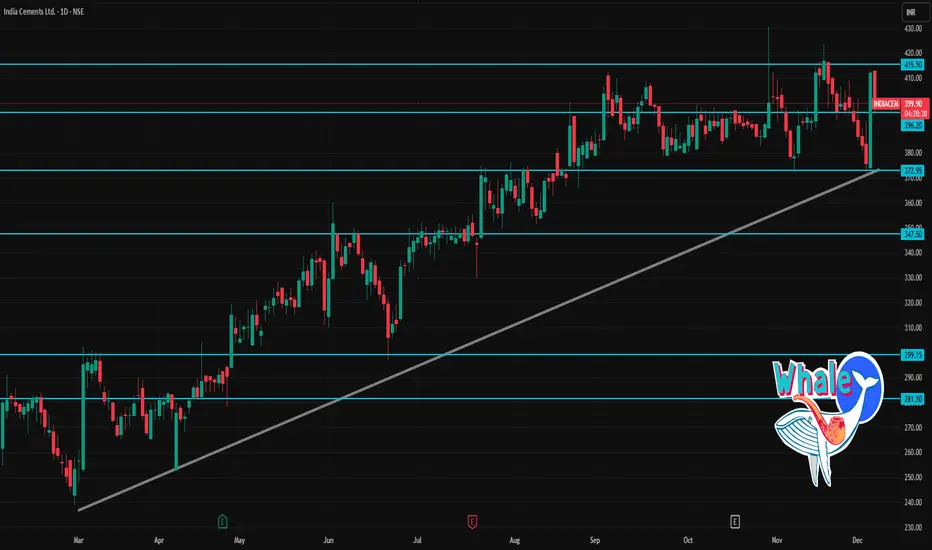
INDIACEM 1 Day Time Frame 📈 Key Recent Data & Context
Recent closing price was ~ ₹412.15, with VWAP ~ ₹402.10. That means price closed above VWAP — often seen as a short-term bullish signal.
The stock has experienced a significant volume spike recently (much higher than its 2-week average), which may suggest stronger conviction in current move.
According to one daily technical indicator set, the stock shows “neutral to slightly bullish” — RSI near mid-range, MACD modestly positive.
🔎 1-Day Pivot & Support / Resistance Levels
Using standard pivot-point calculations for INDIACEM:
Level Type Price (₹)
Daily Pivot 364.95
Support 1 (S1) 359.90
Support 2 (S2) 351.00
Support 3 (S3) 345.95
Resistance 1 (R1) 373.85
Resistance 2 (R2) 378.90
Resistance 3 (R3) 387.80
Interpretation:
If price retraces, the pivot ~ ₹365 may act as first “balancing” zone.
Key supports below are between ₹346–351 — failure below could weaken short-term bullishness.
Upside resistances from today’s pivot are ₹374 → ₹379 → ₹388 — crossing these may signal stronger bullish momentum for the day.
✅ My Trading-day “Game Plan” (Hypothetical)
If I were trading INDIACEM today (intraday or short-term):
Could consider a long entry if the stock sustains above ₹402–405, with stop-loss near ₹377–380 (just below R2/R3).
If price slips back and tests pivot ~ ₹365 or support ~ ₹350–355, that could be a buy-on-dip zone.
On the upside, a move beyond ₹388 could open up short-term upside toward ₹395–405 (given stock’s recent volatility).
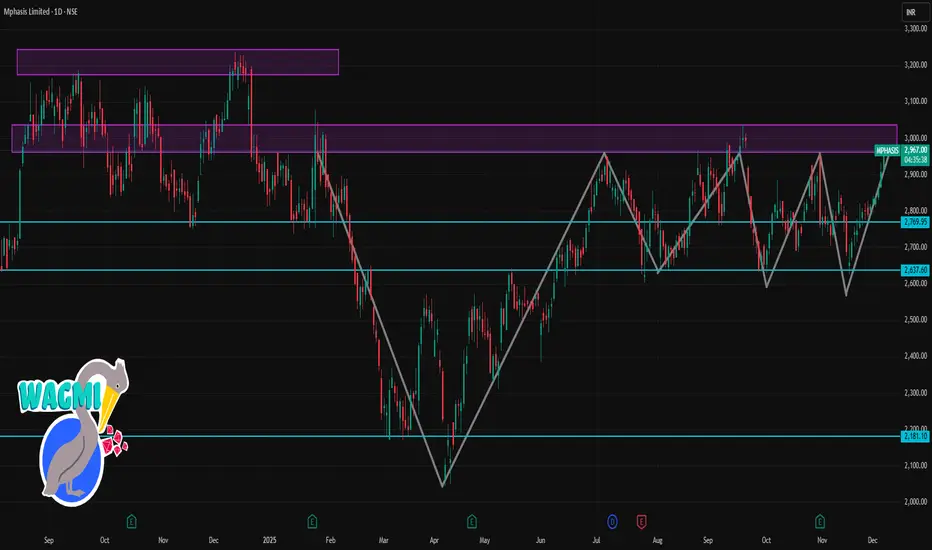
MPHASIS 1 Day Time Frame 📌 Key intraday / near-term levels & technicals
1. Current price (NSE) is around ₹2,908–₹2,927.
2. Day’s low ~ ₹2,865, day’s high ~ ₹2,933.
3. According to a recent “trade spotlight” technical view:
Immediate support near ₹2,800 (close to 20-day EMA).
Immediate resistance near ₹2,920. A clean breakout above this with volume might signal further upside.
If price dips below support zone (₹2,800), watch for weak momentum or a pullback.
4. Technical indicators (on daily chart) suggest a bullish / “buy” bias — moving averages (short and mid-term) are bullish.
5. According to one weekly-based analysis, key support/resistance zones for the week are: Support ~ ₹2,766.40, major support ~ ₹2,721.40; Resistance ~ ₹2,841.70, next resistance ~ ₹2,872.00.
✅ What this means for 1-day / short-term trading
If Mphasis stays above ~₹2,900 and breaks clearly above ~₹2,920 with volume → could test higher intraday levels or even aim for a swing up.
On a dip, watch ₹2,800 as first buffer/support; a drop below this might open possibility of larger retracement.
Given bullish structure, intraday bounce or continuation is likely if broader market supports IT/sector strength.
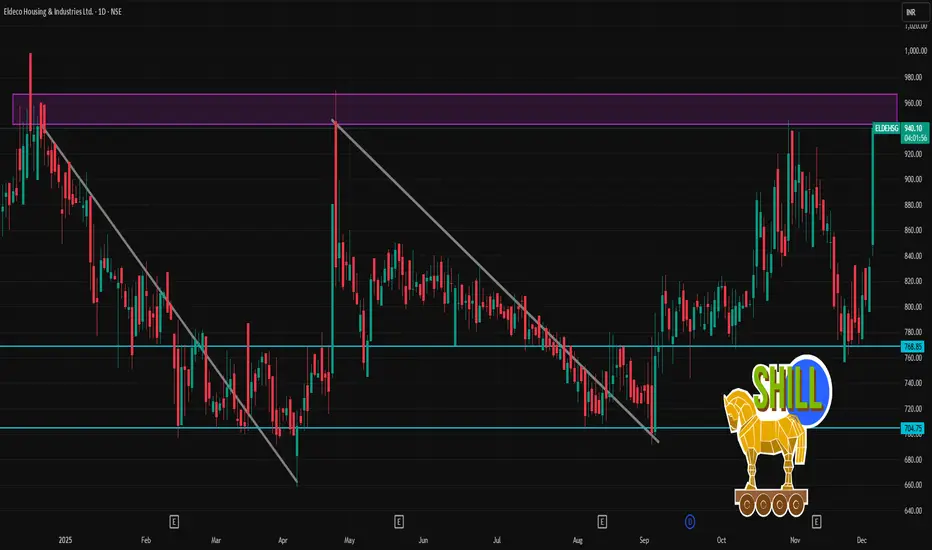
ELDEHSG 1 Day Time Frame 📈 Key Recent Price & Stats
According to a recent quote, ELDEHSG traded around ₹ 940.00 during a session where it jumped ~13% on the day.
52‑week range: ₹ 658.10 (low) — ₹ 998.90 (high).
VWAP for the day (on one snapshot) was ~₹ 924.48.
⚠️ What to Watch Out For / Consider
The stock appears volatile: large swings (e.g. from ~₹ 800s to ~₹ 940 in a day) — intraday volumes and momentum matter.
The valuation is relatively high (P/E ratio is elevated; book value vs price indicates premium).
Given volatility and wide 52‑week range, risk of sharp retracement — if market sentiment or sectoral/regulatory triggers change — remains.
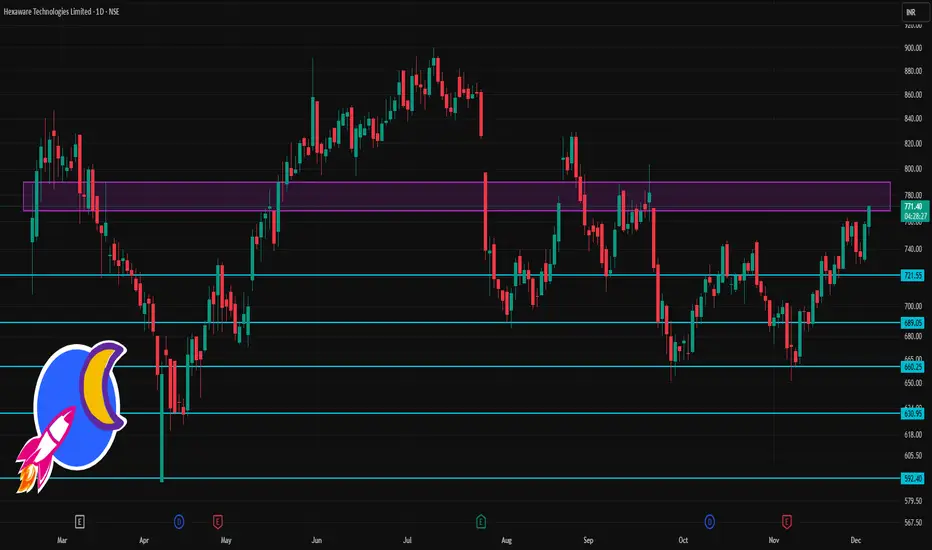
HEXT 1 Day Time Frame 🔎 Current Context & Price
Latest price: ~ ₹770–771.
Day’s trading range seen: roughly ₹750–772.
52-week range: ₹590.30 (low) – ₹900 (high).
⚠️ What to Watch / Risk Zones
If price falls below ~₹745–750 (support zone), risk of more significant slip toward ₹738–740.
Resistance around ₹775–785 could trigger profit-taking or consolidation — strength of buying volume matters.
As with all mid-cap IT stocks, macro factors (global demand, forex, sector sentiment) may override technicals.
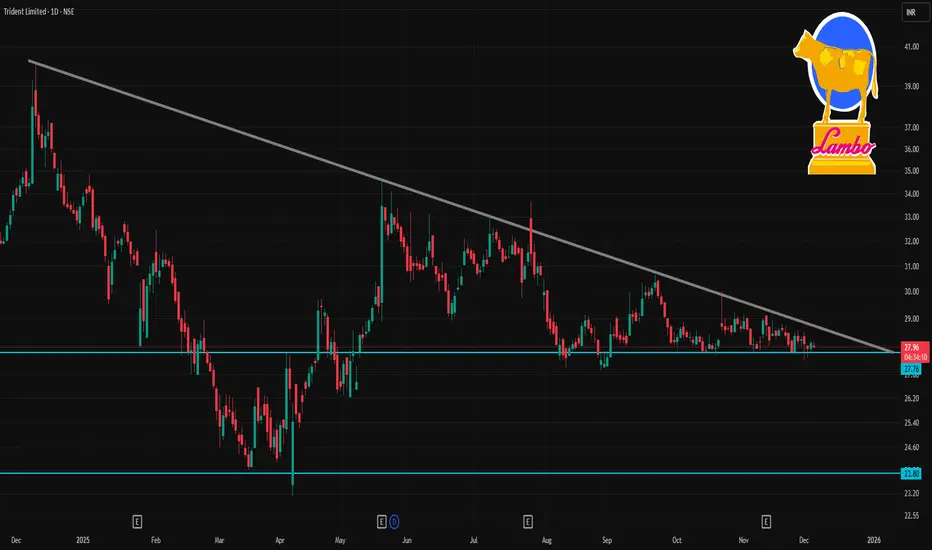
TRIDENT 1 Day Time Frame 📌 Key data
Current price: ~₹28.2.
52-week high / low: ₹40.20 / ₹23.11.
🧭 Pivot / Support / Resistance (1-day based)
Based on a daily pivot-point analysis:
Level Price
Pivot (daily mid) ~ ₹28.02
Resistance 1 (R1) ~ ₹28.32
Resistance 2 (R2) ~ ₹28.53
Support 1 (S1) ~ ₹27.81
Support 2 (S2) ~ ₹27.51
Because the stock is already around ₹28.2, intraday traders might treat ~₹28.5 as a near-term resistance, and ~₹27.5–₹27.8 as the support zone (on a breakdown).
⚠️ What to watch / Risks
Technical signals are mixed: some moving averages are “outperform/positive”, but many oscillators and technical-indicator-based services are still flagging a “sell/neutral” bias on the daily chart.
The stock has underperformed over long term — price is much below 52-wk high, returns have been weak — so volatility or broader market sentiment could sway levels significantly.
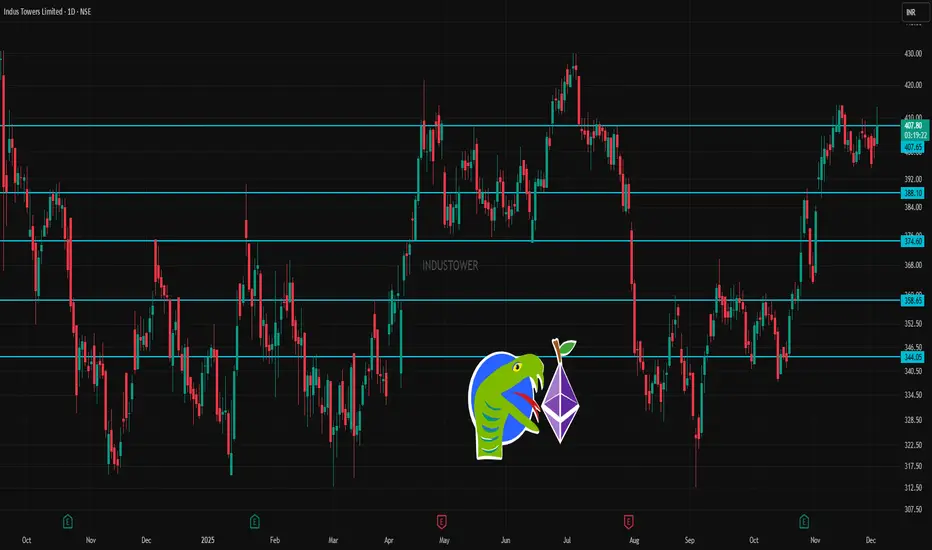
INDUSTOWER 1 Day Time Frame 📌 Key Data & Trend Context
Recent price: around ₹ 404 (or in the ~₹ 401–409 range depending on source/time).
52‑week range: Low ≈ ₹ 312.55, High ≈ ₹ 430.00.
According to moving averages (short‑, mid‑ & long‑term), trend is marked “outperform” / bullish.
✅ What This Suggests (in 1‑day / Short-Term Context)
As long as price holds above ₹ 388–392, the near‑term trend remains stable / bullish.
A close above ₹ 405–408 on decent volume may signal a bullish breakout — could push toward ₹ 424–438 range.
On a drop below ₹ 338–346, the stock could weaken significantly — suggesting caution or a bearish tilt.
Given moving averages (short + mid + long) are in bullish alignment, intermediate‑term bias remains positive.
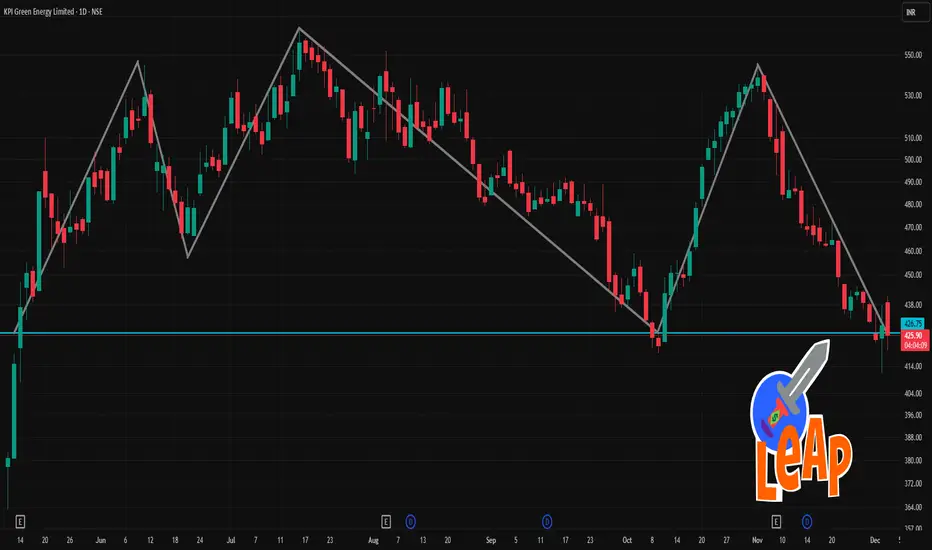
KPIGREEN 1 Day Time Frame 📈 Current Snapshot (as per latest available sources)
Several platforms list the share price around ₹ 429.9 – ₹ 431.4 on NSE in recent sessions.
The 52‑week range for KPI Green remains roughly ₹ 313.40 (low) to ₹ 588.80 (high).
On a recent day, typical intraday swings showed lows around ₹ 430‑431 and highs near ₹ 437‑438, indicating a moderate intraday move.
🧮 What This “Level” Suggests Today
The current price (~₹ 430–431) places the stock substantially above the 52‑week low, but significantly below the 52‑week high — suggesting the stock is in a lower‑to‑mid zone of its yearly range.
Intraday volatility seems modest; the share hasn’t shown large spikes today, indicating relatively stable trading so far.
This could imply either consolidation or market caution — not a strong upward breakout, but also not near floor levels.
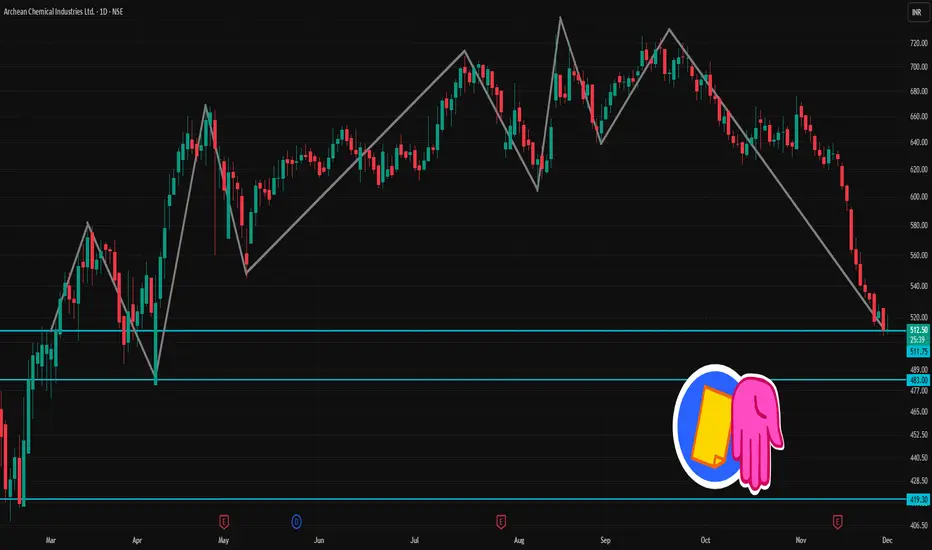
ACI 1 Day Time Frame 📊 Latest snapshot
Recent price ~ ₹ 512 – ₹ 513
52-week range: ~ ₹ 408 (low) to ~ ₹ 730 (high)
Recent technical-analysis summary: Mixed/Neutral to bearish — some moving averages give bullish bias but oscillators appear weak.
⚠️ Technical Signals (Short-Term)
According to one technical summary, short-term trend is marked as “sell”.
Oscillators (e.g. RSI/Stochastic) recently suggest weak or bearish momentum.
✅ What to Watch / Trading Cautions
Momentum is weak; oscillators don’t suggest a strong bullish bounce yet.
If price drops below support (~₹ 508), downside risk increases; need close stop-loss discipline.
Volume & broader market/sector conditions could swing price sharply — stay alert for volatility.
On a bounce, watch if resistance zones get challenged — a breakout may change short-term trend.
NIFTY MIDCAPNIFTY MIDCAP formed with DOUBLE TOP with DIVERGENCE with first target 14,403, and next support at 13,995. If it didn't take supports at 13,995 we can see further downside with FINAL TRAGET 13,900.

XRPUSDT – 4H | Channel Rejection + Re-Test | High RR Long SetupXRP is respecting a long-term descending channel, and the recent price action shows a strong bullish reaction from the lower boundary of the channel. After sweeping liquidity at the lows, price has broken back above the inner trendline and is now retesting it as support.
🔍 Key Technical Points
Price bounced from the channel bottom, showing buyer strength.
Clear break and retest of the minor descending trendline.
Price holding above the retest zone (grey demand area).
Targeting the upper channel resistance + higher-timeframe supply zone.
Attractive Risk-to-Reward setup if the retest holds.
📈 Long Setup
Entry: Around 2.20 – 2.22
SL: Below 2.06 (structure invalidation)
TP: 2.65 – 2.70 zone
R:R: ~4.5R (High reward potential)
📌 Why I Like This Setup
This setup aligns with:
Trendline confluence
Demand zone reaction
Clear momentum shift
Liquidity grab at the lows
Room to move higher towards channel top
If bulls hold the retest, XRP could push toward the 2.65–2.70 target area.
⚠️ Disclaimer
This is only my personal analysis and not financial advice. Always trade with proper risk management.

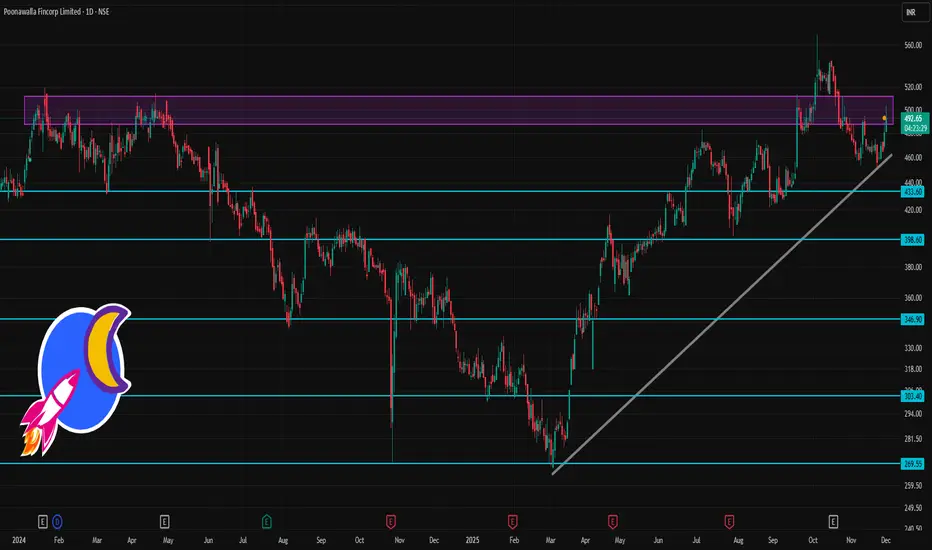
POONAWALLA 1 Day Time Frame 📌 Latest price & context
On one of the latest snapshots, the share price was ~ ₹ 492.65 (as per a public chart)
The stock remains among relatively volatile mid-cap / NBFC counters, with a fairly high beta (i.e. sensitivity to market swings).
✅ Technical Momentum & Risk Profile
Technical sources currently signal a “bullish / buy-leaning” bias based on moving averages (from short-term to long-term) for Poonawalla.
But high volatility & elevated beta mean risk — sharp swings are possible in either direction depending on market sentiment, NBFC-sector news, and macro cues.
⚠️ What to watch out for
The pivot-based levels assume relatively normal volatility — big sector-wide moves, news, or NBFC-specific developments can render them less reliable.
As an NBFC / mid-cap, the stock remains sensitive to interest-rate outlook, credit-sector sentiment, and macroeconomic conditions — not just its own chart.
The “buy bias” from moving averages doesn’t guarantee a smooth upward path — you should watch volume, daily chart pattern, and broader market context.
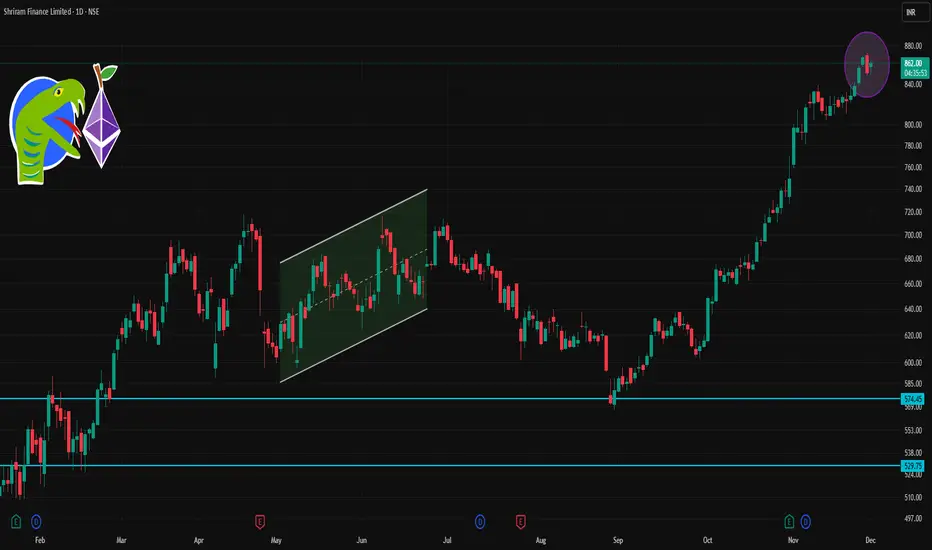
SHRIRAMFIN 1 Day Time Frame 📊 Current Snapshot
Latest live price: ~ ₹852–857 (depending on trade moment).
Today’s high / low range: ~ ₹861.95 high / ~ ₹850.40 low.
52-week range: ₹493.35 (low) ↔ ₹872.00 (high).
✅ What This Means for Intraday / Next Sessions
If price stays above ~₹857–858 (pivot) — bias remains bullish → could target ₹866 → ₹880–881.
If price dips but finds support near ₹842–843, watch for bounce (possible buying opportunity).
A break below ₹834 → ₹820 downward zone might signal risk of further downside — monitor overall market and sector trend.
Use stop-loss (if trading) near support zones to manage risk, given volatility and sensitivity to overall market moves.
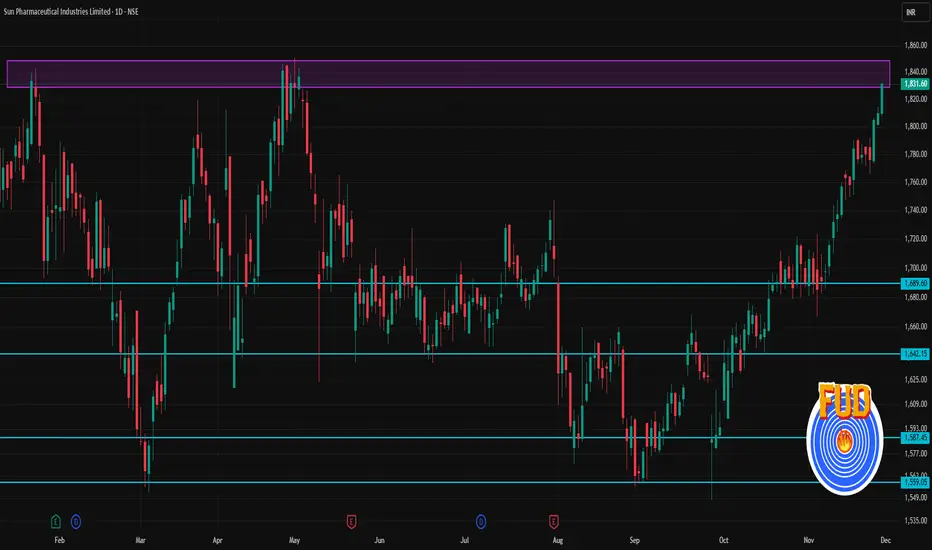
SUNPHARMA 1 Day Time Frame 📈 Key numbers & technical indicators
Last close: ~₹ 1,831.60
Pivot point: ~₹ 1,824.03
Immediate resistance (R1‑R3): ~₹ 1,840.6 → ₹ 1,849.5 → ₹ 1,866.1
Immediate support (S1‑S3): ~₹ 1,815.1 → ₹ 1,798.5 → ₹ 1,789.6
Moving averages: 20‑day ~₹ 1,758.6, 50‑day ~₹ 1,711.7, 100‑day ~₹ 1,690.8, 200‑day ~₹ 1,686.6 — stock is comfortably above all, indicating overall bullishness.
✅ What this suggests now (1‑day / short‑term view)
As long as price stays above pivot (~₹ 1,824), the near‑term bias remains mildly bullish.
If price breaks and sustains above first resistance levels (~₹ 1,840–1,850), next resistance zone near ~₹ 1,865 may come into play.
On downside, if price slips below support zone (~₹ 1,815–₹ 1,798), watch for further weakness toward ~₹ 1,789–₹ 1,775.
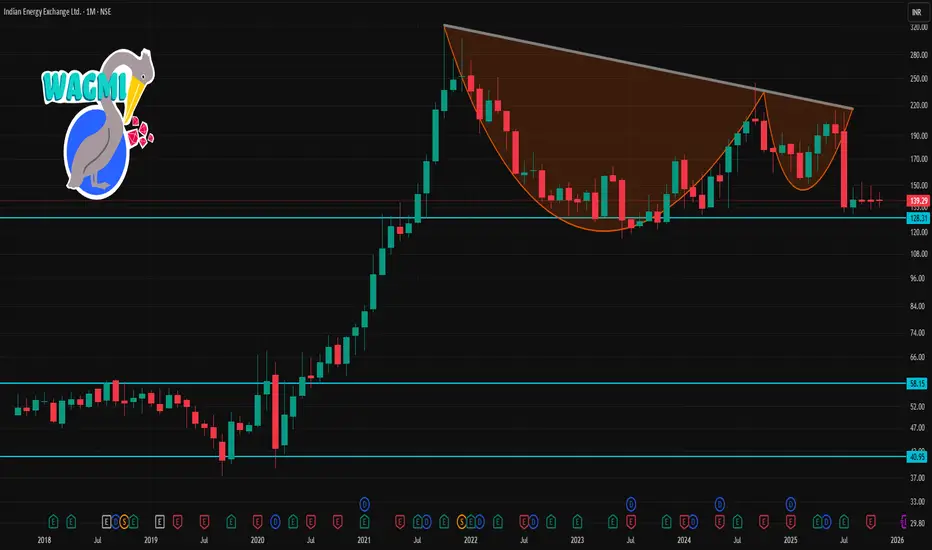
IEX 1 Month Time Frame 📈 Current snapshot
As of late November 2025, IEX trades around ₹139–140/share.
The 52-week range remains ~₹130.26 (low) to ~₹215.40 (high).
Recent trading has seen a dip from earlier resistance around ₹145–150 down to ~₹139.
🎯 1-Month Scenarios for IEX
Neutral / Range-bound → ₹138–145: If markets stay sideways and no big catalyst arrives.
Mild Rebound → ₹145–149: If there’s some buying interest (maybe due to broader market recovery or stabilization), price could test the higher resistance.
Downside Risk → ₹135–137: If sentiment worsens (e.g. fear around regulatory changes, weak volumes), stock could retest lower support.
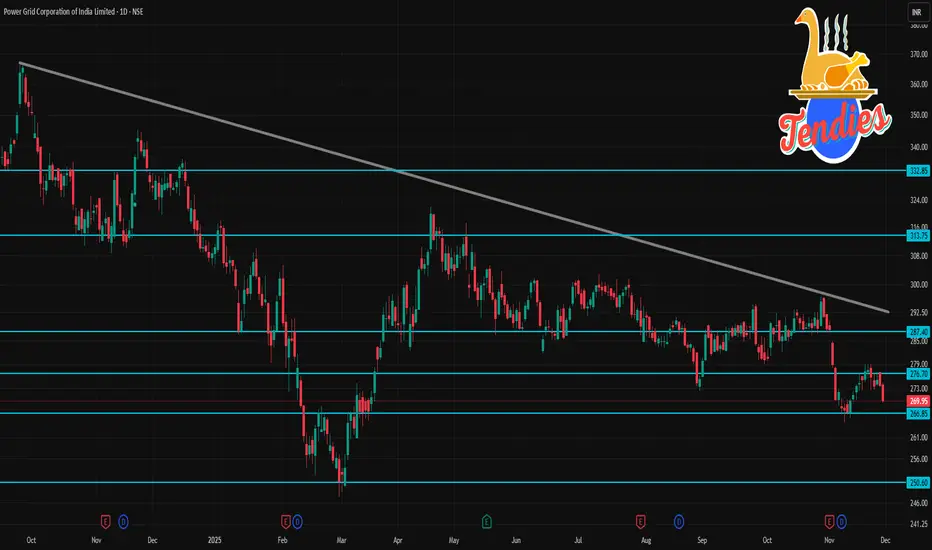
POWERGRID 1 Day Time Frame 📊 POWERGRID — Current snapshot (daily timeframe)
As of last close, POWERGRID was trading around ₹ 269.95.
The 52-week trading range is roughly ₹ 247.30 (low) to ₹ 336.25 (high).
Over the past week, the share price is down about 2.76%, and over the last 6 months, down about 7.3%.
📈 Technical Indicators (Daily Chart)
According to a technical-analysis summary, moving averages and oscillators on daily timeframe show a “Strong Sell” signal for POWERGRID.
The 14-day RSI is near 31, which is close to oversold territory — indicating potential weakness or risk of a further drop.
Some charting platforms show mixed signals (some “sell”, some “neutral”), but overall bias remains bearish to weak, not bullish.
Vimta Labs Limited - Breakout Setup, Move is ON...#VIMTALABS trading above Resistance of 607
Next Resistance is at 1113
Support is at 498
Here are previous charts:
Chart is self explanatory. Levels of breakout, possible up-moves (where stock may find resistances) and support (close below which, setup will be invalidated) are clearly defined.
Disclaimer: This is for demonstration and educational purpose only. This is not buying or selling recommendations. I am not SEBI registered. Please consult your financial advisor before taking any trade.

Vimta Labs Limited - Breakout Setup, Move is ON...#VIMTALABS trading above Resistance of 952
Next Resistance is at 1214
Support is at 691
Here are previous charts:
Chart is self explanatory. Levels of breakout, possible up-moves (where stock may find resistances) and support (close below which, setup will be invalidated) are clearly defined.
Disclaimer: This is for demonstration and educational purpose only. This is not buying or selling recommendations. I am not SEBI registered. Please consult your financial advisor before taking any trade.

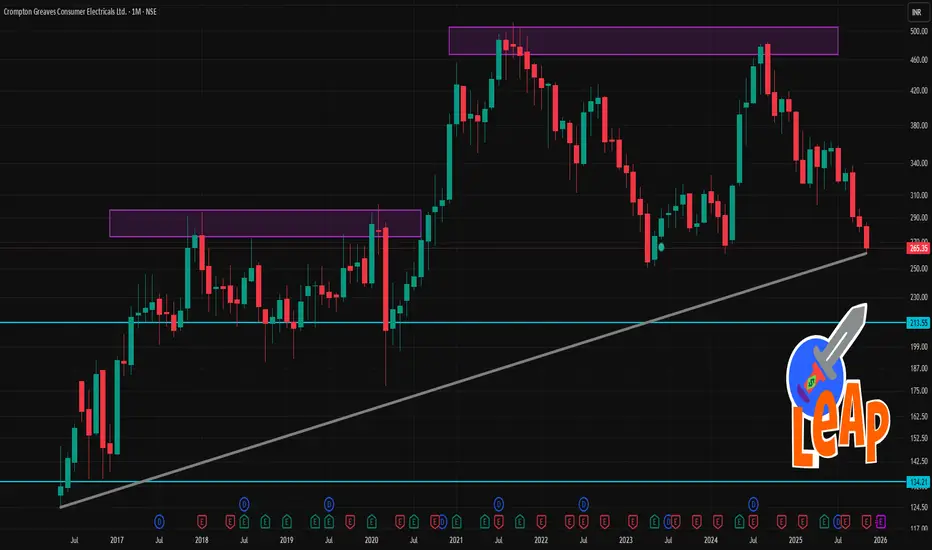
Crompton 1 Month Time Frame 📉 Recent context & background
The stock recently hit a fresh 52-week low — around ₹267.5–₹271.25.
Latest quarter (Q2 Sep-2025) saw a sharp profit drop: net profit fell ~43% YoY, with EBITDA margin under pressure due to commodity cost inflation and restructuring costs.
On the flip side, the company’s broader business mix (like pumps / small domestic appliances / solar-rooftop orders) and some analyst estimates still see potential for recovery.
🧭 What could move the price in next 1 month
Positive triggers: Any signs of margin recovery, easing of commodity inflation, good order wins (e.g. solar-segment orders or domestic appliance demand), supportive news or institutional interest.
Negative triggers: Continuation of margin pressure, weak demand in core categories, negative macro / interest-rate or inflation environment, or broader investor risk-off sentiment.
🎯 My Base-Case 1-Month Scenarios
Bearish to neutral scenario: Price may hover or drift around ₹260–₹285, possibly bouncing between support (₹265–₹270) and resistance (₹280–₹290).
Bullish/recovery scenario: If sentiment improves, stock could aim for ₹300–₹330 over the next 3–4 weeks — especially if company provides encouraging updates or sector environment improves.
Upside breakout scenario (less likely in short 1-month): A push toward ₹340 is possible only if there’s a strong catalyst (e.g., margin rebound, big orders, broadly bullish market) — but that feels optimistic for just 1 month.
KAZIA THERAPEUTICS LTD SPONSORED ADRKZIA made double bottom with divergence with good volume and breakout at $4.45 with first target of $22.5, if and second target of $41.7 and with can expect strong resistance at $41.7 and reverse might happen. If KZIA did breakout at this level we can expect rally till $79.
Analysis is made on weekly time fame for long term view
It is just my chart analysis upto best of my knowledge. As it is share market anything happen because market effects on many things happen in the world.
Thank you

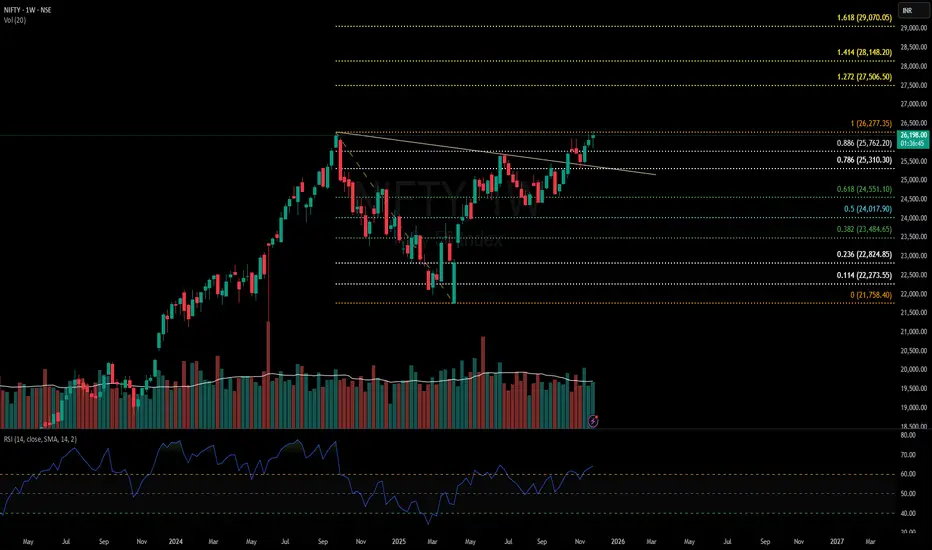
NIfty50 Analysis: Is it start of new bull run or a bull trap?Nifty50 Has given a cup& handle breakout and has already retested this breakout.
Currently, it is hovering near ATH and already looks ready for a breakout.
If this breakout sustains, we might see a good rally coming till budget(Feb'26) and levels to watch according to fib are 27500, 28150 & 29000.
However, December is a favourite season for FIIs to offload money and a correction is historically seen during Christmas season. So, there is a high probability of a bull trap formation as well.
25300 will be a crucial support for Nifty. a breakdown of this level will be confirmation of bull trap and we might see a sharp fall towards 24000 level.
I will suggest to keep a watch on Nifty price action if you have any swing trades open.