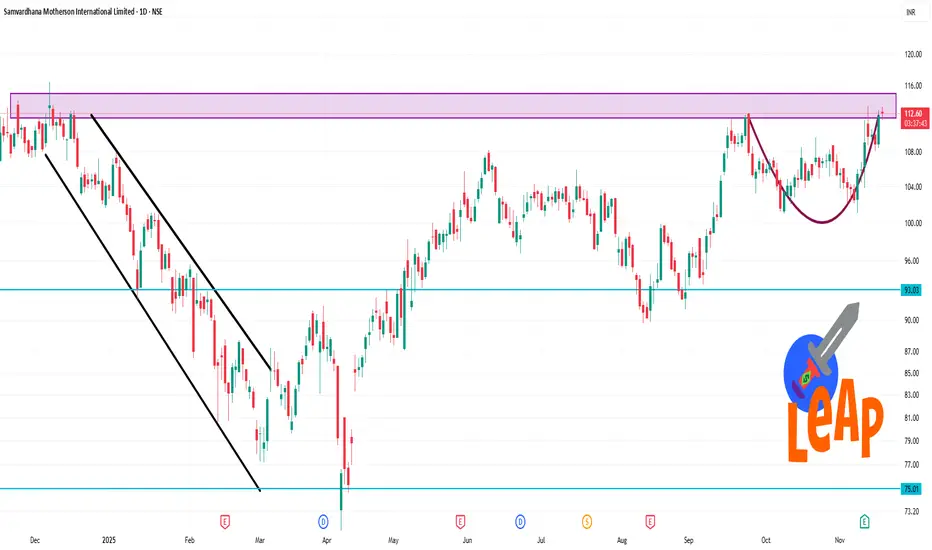
MOTHERSON 1 Day Time Frame 📊 Latest Price & Range
Last traded around ₹112.40 (as of 20 Nov 2025) on NSE.
Day’s intraday high ~ ₹113.39, intraday low ~ ₹111.78.
52-week range: ~₹71.50 (low) to ~₹116.38 (high).
✅ What to Watch Today
If price holds above ~₹112.50 and moves toward ~₹113.50-₹115, bullish bias.
If price fails to hold support near ~₹111.50 or drops below ~₹110, risk of pull-back.
Volume & broader auto-ancillaries sector trend will matter — weak sector may weigh.
Time-frame is short (intraday / daily) so tight stops and quick reactions recommended.
Chartanalysis
[INTRADAY] #BANKNIFTY PE & CE Levels(20/11/2025)Bank Nifty will open with a slight gap-up, indicating early strength and positive sentiment carrying forward from the previous session. As long as the index holds above the 59050–59100 zone after the opening, the market is likely to remain bullish, activating the buying range with potential upside targets of 59250, 59350, and 59450+. If the momentum pushes further toward the upper resistance zone near 59550–59600, the next bullish leg may extend toward 59750, 59850, and even 59950+.
However, any weakness will be confirmed only if the price slips below 58950, where a selling trade becomes active with downside targets of 58750, 58650, and 58550-. Overall, the opening bias remains positive, and buyers are expected to dominate as long as key support levels hold strong.

GOLD MARKET UPDATE 11/19 – STRUCTURE HAS SHIFTED1. Market Structure
Gold has broken above the H4 downtrend line and completed a successful retest around 4,060–4,070.
The strong push toward 4,100 confirms a transition from bearish → short-term bullish.
Structural Signals:
Buyers are gaining control as price continues forming higher lows
The POC zone 4,072–4,075 has turned into strong support
Intraday structure is leaning clearly toward a bullish recovery
2. Technical Breakdown – H1 & H4
H4 Trend
After the previous strong drop, price is forming a potential bottom around 4,030–4,050
H1 Trend
The short-term bullish trend is confirmed after breaking and retesting the descending trendline
3. Key Levels to Watch
Support Zones
4,072–4,075 → POC – major support maintaining the bullish structure
4,060–4,065 → minor support – quick-reaction area
Resistance Zones
4,108–4,112 → first resistance (H1/H4 confluence)
4,147–4,150 → strong H4 resistance, potential higher target if bullish continuation remains
⚠️ Disclaimer
This analysis is for informational and educational purposes only and does not constitute financial advice. Trading involves risk, and you should always conduct your own research before making any trading decisions.

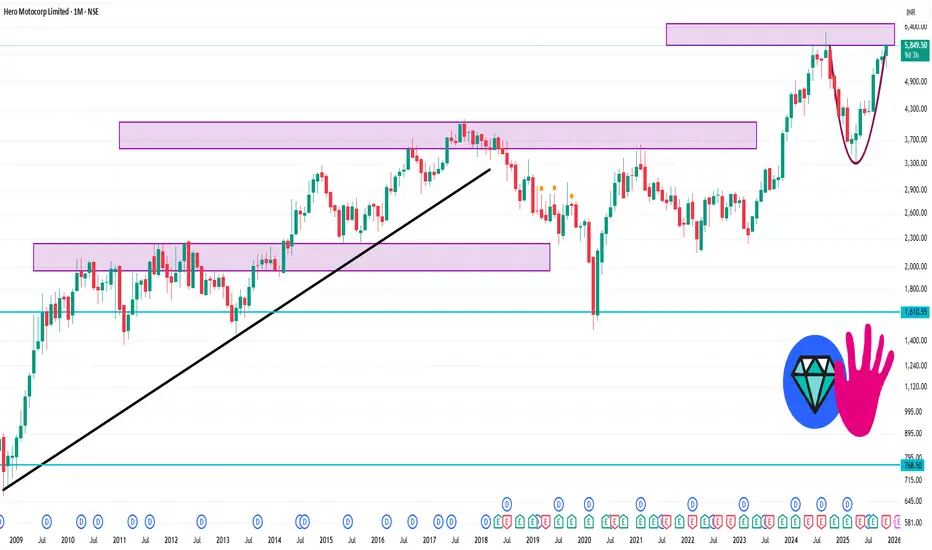
HEROMOTOCO 1 Month Time Frame 🎯 Key Price Levels (1-Month Timeframe)
Here are approximate support & resistance levels you may watch in the next month:
Resistance levels:
~ ₹5,850-₹5,900: Price is already trading around this band (Trendlyne shows ~₹5,850).
Next major resistance might lie closer to ~ ₹6,000-₹6,100 if momentum carries on (psychological level + prior swing highs).
Support levels:
First major support: ~ ₹5,600-₹5,650 (just under current trading zone)
Secondary support: ~ ₹5,300-₹5,400 zone — a deeper pull-back level if the first support gives way.
Pivot / mid-zone:
A pivot or neutral zone around ~ ₹5,700-₹5,800 may act as a battleground between bulls & bears.
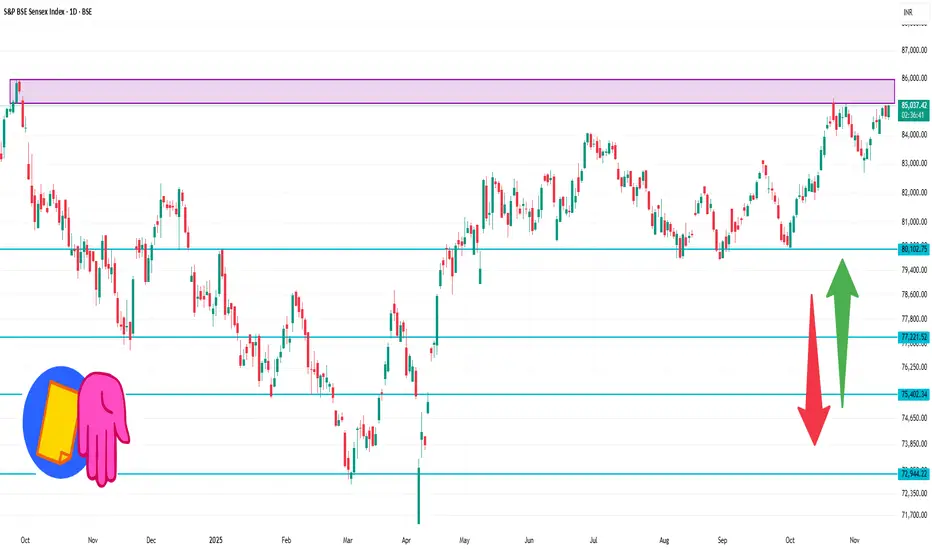
Sensex 1 Day Time Frame ✅ Current value
The index is trading around ~ 85,040 points.
Today’s high has been ~ 85,080 and low ~ 84,525.
📍 Key pivot & support/resistance levels (Daily)
From recent technical data:
Pivot Point: ~ 84,757.93
Resistance 1 (R1): ~ 84,957.50
Resistance 2 (R2): ~ 85,241.98
Support 1 (S1): ~ 84,473.45
Support 2 (S2): ~ 84,273.88
Support 3 (S3): ~ 83,989.40
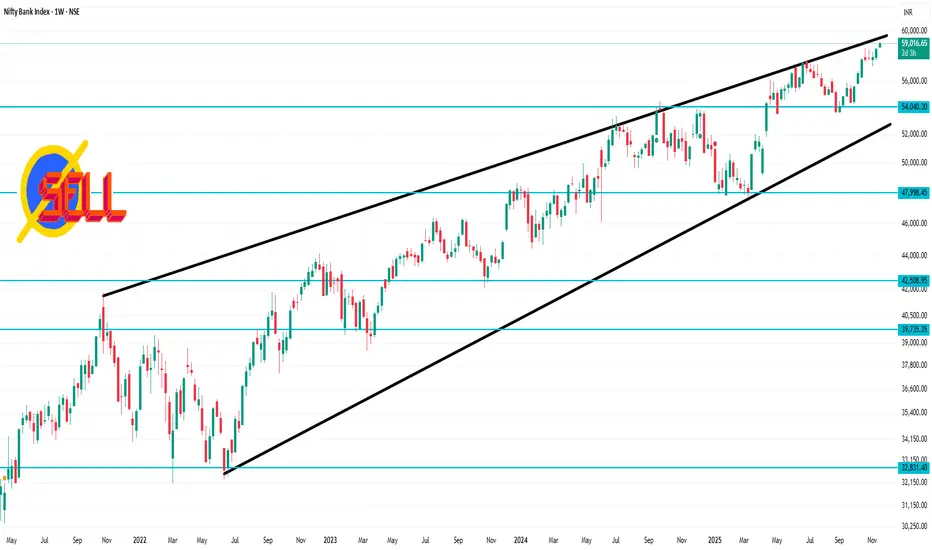
Bank Nifty 1 Week Time Frame🔍 Current snapshot
The index is trading around ~ 58,900-59,000 points.
It recently hit a fresh all-time high of around 59,100 points in recent sessions.
The structure shows it is near upper-resistance territory and signs of short-term exhaustion appear.
✅ Key Weekly Time-Frame Levels
Resistance zones
~ 59,100 – 59,300 points: This is the immediate upper resistance (recent ATH level) which bulls need to clear for a fresh leg up.
On a breakout above ~59,300, the next psychological target zone might be ~59,500-60,000+.
Support zones
~ 58,600 – 58,300 points: A key near-term support zone. Breakdown below ~58,800 may trigger weakness toward this zone.
A stronger support below that is around ~ 57,500 – 57,200 points, which becomes relevant if heavy selling or structural break occurs.
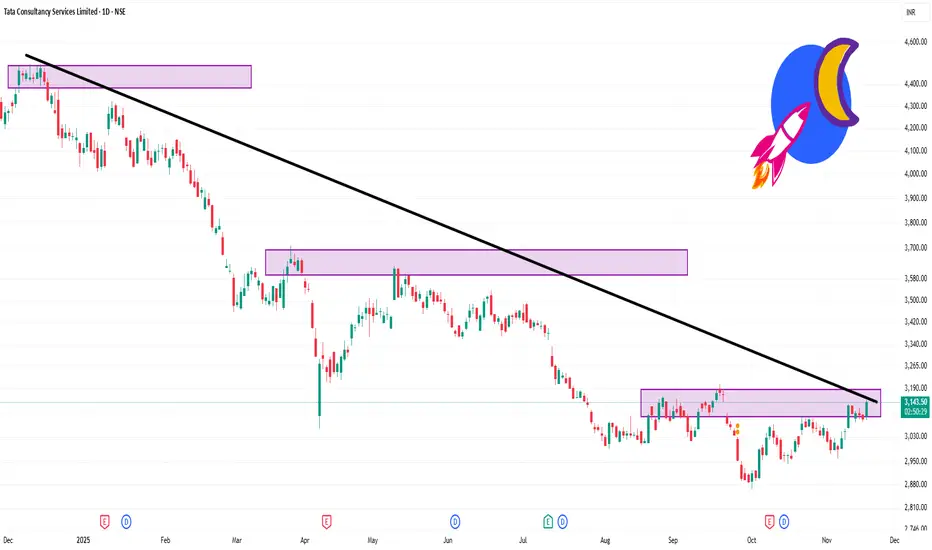
TCS 1 Day Time Frame ✅ Key numbers
Current price: ~ ₹3,147 (NSE)
Today’s range: Low ~ ₹3,083.50, High ~ ₹3,149.90
Previous close: ~ ₹3,087.10
📊 Key levels to watch on daily timeframe
Support zone: If price drops, watch around ~ ₹3,080-₹3,100 (today’s low region)
Immediate resistance: Today’s high ~ ₹3,149.90. If that breaks, next resistance may show up near ~ ₹3,200-₹3,250 (psychological + recent historic minor highs)
Trend pivot: The open of ~ ₹3,097 suggests a pivot point; staying above this gives short-term bullish lean, dropping back below may bring weakness
Risk zone: If price falls back and breaks below ~ ₹3,050, it may test lower support around ~ ₹2,990-₹3,000 (recent structural support area)
BUY AGAIN BREAKOUT TREND LINE🕯SELL GOLD: 4018- 4015
⚠️ SL: 4015
✔️ TP: 4024→ 4030→3934( 60- 170 pips)
The 4018–4015 zone has just been broken, and with the temporary bearish structure on M15 also violated, there is a high probability that price will pull back and retest this zone.
If that happens, we’ll have a beautiful and technically clean BUY pullback opportunity aligned with the post-breakout structure.
📌 Notes:
This is a BUY pullback setup based on the M15 break of structure
Only BUY with clear candle confirmation
Small lot size + tight SL for safety
I’ll update again when price approaches the retest zone. 🔔🔥

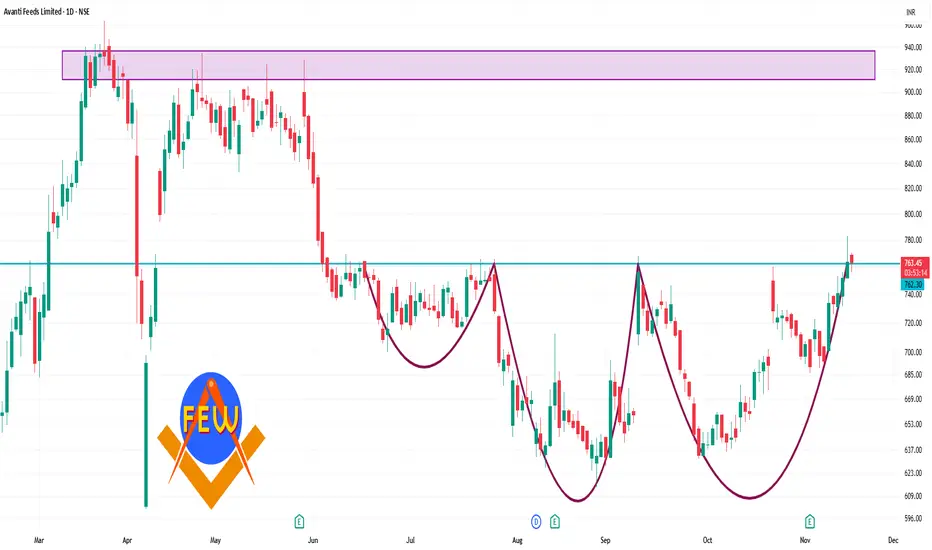
AVANTIFEED 1 Day Time Frame 🔍 Key Levels
Pivot (Daily): ~ ₹ 746.47
Resistance levels:
R1 ~ ₹ 761.48
R2 ~ ₹ 770.92
R3 ~ ₹ 785.93
Support levels:
S1 ~ ₹ 737.03
S2 ~ ₹ 722.02
S3 ~ ₹ 712.58
✅ Interpretation & Use
If price holds above ~₹ 746.47 and shows strength, the next meaningful resistance zone is ~ ₹ 761-771.
If price drops below the pivot, then supports around ~ ₹ 737, and further down ~ ₹ 722 or ~ ₹ 712 become relevant.
The momentum indicators (RSI ~67.6, MACD positive) suggest bullish bias but note: when RSI gets high → risk of pull-back increases.
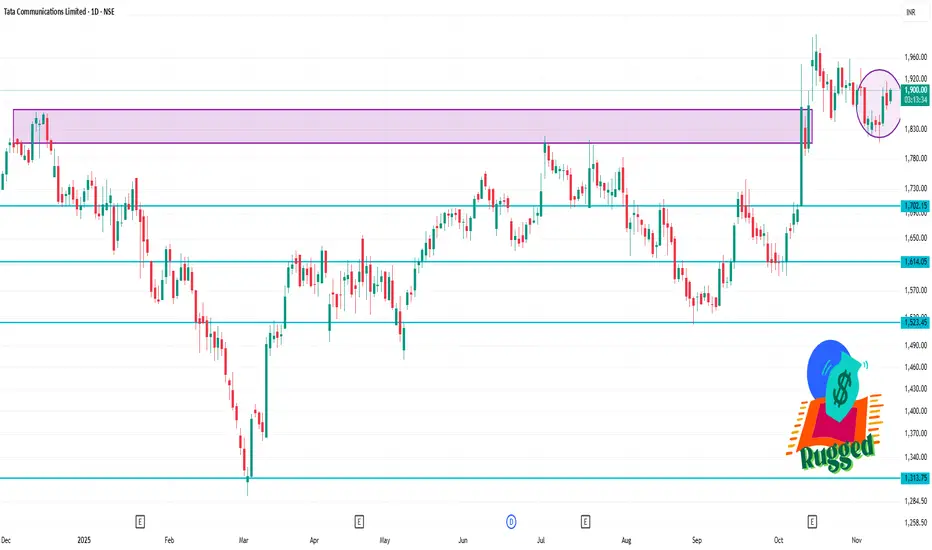
TATACOMM 1 Day Time Frame 🎯 Key Levels
Current price (recent quote): ~ ₹1,876.
Pivot levels (daily classic):
Pivot ≈ ₹1,895.73
Support 1 (S1) ≈ ₹1,890.36
Resistance 1 (R1) ≈ ₹1,900.86
Additional support/resistance: S2 ≈ ₹1,885.23, R2 ≈ ₹1,906.23
Moving Average supports:
50-day SMA ≈ ₹1,858.81
100-day SMA ≈ ₹1,882.54
200-day SMA ≈ ₹1,846.83
✅ Trading Implications
If the stock manages to break and hold above the pivot (~₹1,895.7), then the next target is near ₹1,900–₹1,906 (R1/R2 area).
If it fails and drops below support levels (~₹1,890 and ~₹1,885), then watch for deeper support around the 50-day SMA (~₹1,858) or even ~₹1,846 (200-day SMA) in a more significant correction.
Given the bullish indicators, the preferred scenario is a break to the upside, but one must be aware of risk of reversal/weakness if momentum fades.
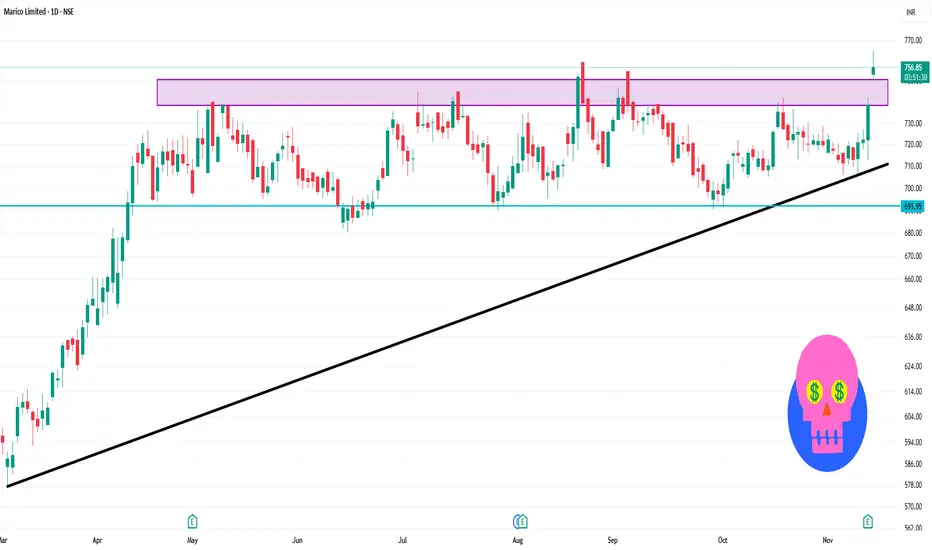
MARICO 1 Day Time Frame 📌 Key Price & Technical Status
Current market quote: ~ ₹758 on 17 Nov 2025.
RSI (14) on daily basis: ~77.46 → Overbought zone.
Moving averages (daily) for 5/10/20/50/100/200 periods are all showing “Buy” signals.
🎯 Interpretation & Short-Term Outlook
Given the current price (~₹758) is above many of the standard resistance/pivot levels, the stock is in a relatively strong upward momentum phase.
Overbought RSI suggests risk of pull-back or consolidation.
Key support zone to watch in case of reversal: ~ ₹730-₹720 (S1-S2 region)
On the upside, if momentum continues: ~ ₹760-₹780 region appears to be the next resistance cluster.
Since the price is already above many pivots and in “overbought” territory, caution is warranted for fresh long positions — better to wait for confirmation (e.g., breakout & volume) or a pull-back to support.
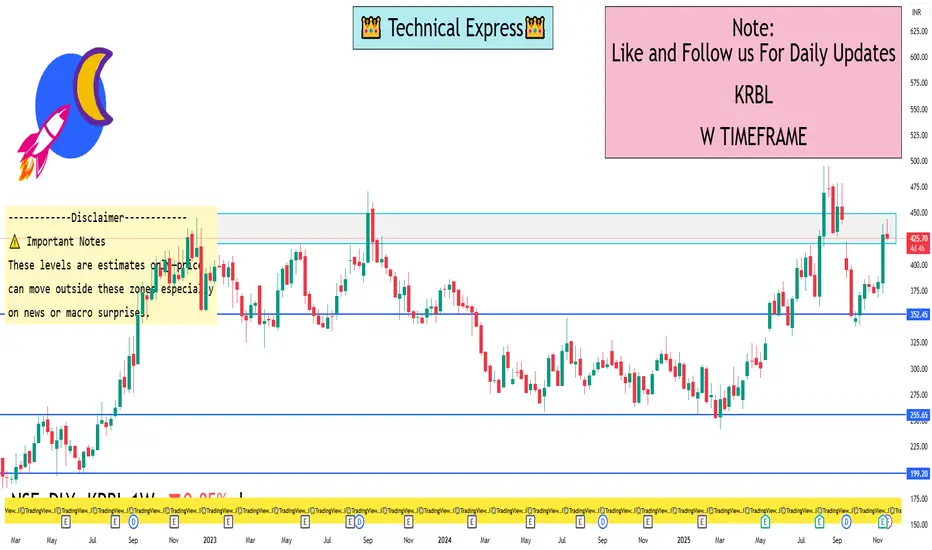
KRBL 1 Week View 🔍 Current data snapshot
Last quoted price: ~ ₹ 425 to ₹ 430.
Recent high trades around ~ ₹ 443.90 (1-day high) and low around ~ ₹ 424-425.
On the weekly view, the stock is in an upward leg, with recent momentum.
📊 1-Week Timeframe Support & Resistance Estimate
Support zone: ~ ₹ 410-420 — a near-floor based on recent consolidation around ~₹ 424-425.
Key pivot zone: ~ ₹ 430-435 — if price stays above this range, the short-term bullish bias remains intact.
Resistance zone: ~ ₹ 450-460 — an approximate upper barrier if momentum continues; the chart mentions ~₹ 480-490 as a broader resistance.
⚠️ Important Notes
These levels are estimates only—price can move outside these zones especially on news or macro surprises.
Use this as part of broader strategy (volume, trend, risk management) rather than relying solely on the levels.
Because the stock just bounced strongly, the risk of a short-term pullback to support is present.
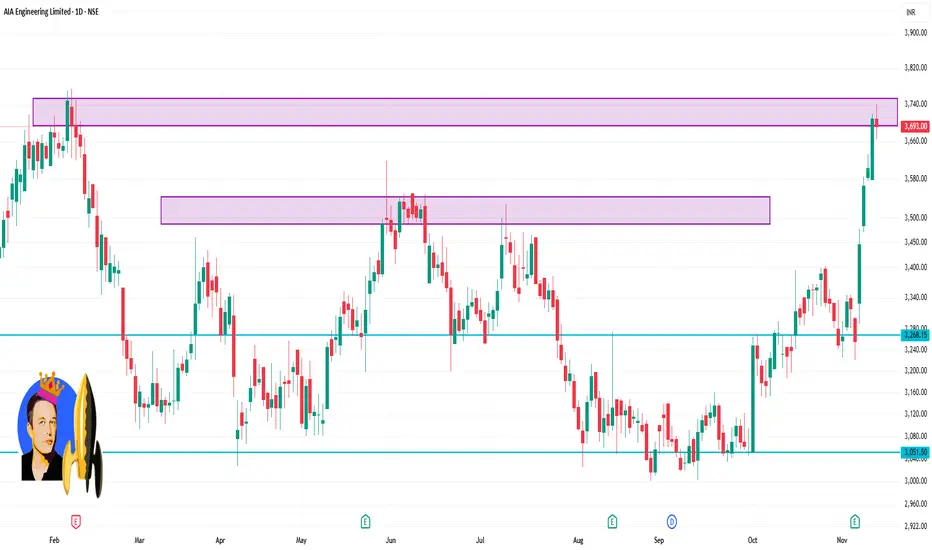
AIAENG 1 Day Time Frame Last close: ₹ 3,693.00.
Day’s range: Approx ₹ 3,665.50 to ₹ 3,740.30.
52-week high/low: ~ ₹ 3,774.60 / ₹ 3,001.10.
⚠️ Risks / Things to Watch Today (Intraday)
If price drops below the pivot ~ ₹3,311, it could test support around ₹3,280 or even further.
Strong intraday resistance around mid-MA levels — especially if it rejects around the ₹3,600+ mark.
Volume risk: without strong buying volume, momentum might fade later in the day.
Macro or sector news (mining, cement) could sharply influence this stock intraday.
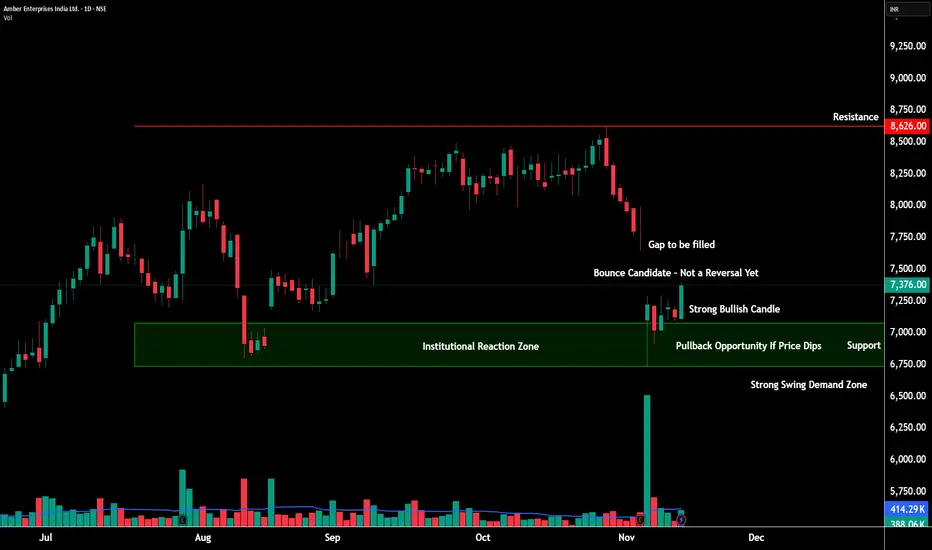
AMBER at a Critical Turning Point – Trend Shift or Just a Bounce💹 Amber Enterprises Ltd (NSE: AMBER)
Sector: Consumer Durables | CMP: 7376 | View: Early Reversal Attempt Inside Downtrend Structure
Chart Pattern: NA
Candlestick Pattern: Bullish Engulfing
📊 Price Action – What’s Really Happening?
Amber finally showed signs of life after a sharp slide from 8600 levels.
Buyers stepped in near 7180–7200, creating a clean intraday reversal base.
But — the larger trend is still down, so this bounce must prove itself above 7480–7536.
🧭 Support & Resistance
Resistances: 7484 | 7536 | 7592 | 7785
Supports: 7183 | 7090 | 6990 | 6882
Demand zones are strong → resistance zones are layered and heavy.
This is why confirmation matters.
📈 STWP Trading Analysis:
Bullish Breakout: 7400 | Stop Loss: 7180
A clean bounce developed from the swing demand zone after strong absorption of selling pressure. Despite this intraday strength, the daily chart remains in a downtrend with lower highs and lower lows. A possible close above 7480–7535 could shift bias to short-term bullish continuation. Below 7180, weakness can reappear quickly.
🧩 Final STWP Outlook
Momentum: Mild |Trend: Bearish | Risk: Moderate | Volume: Improving
⚠️ Disclosure & Disclaimer – Please Read Carefully
This content is strictly for educational and informational purposes.
It is not a buy/sell recommendation and should not be treated as investment advice.
I am not a SEBI-registered investment adviser.
Markets carry risk, and price can move unpredictably.
Always evaluate your risk, position size, and suitability before trading.
Consult a SEBI-registered adviser before making any financial decision.
Position Status: No active STWP position in AMBER at the time of analysis.
Data Source: TradingView & Market Data Snapshot.
💬 Found this breakdown useful?
🔼 Boost this post to help more traders learn structured analysis
✍️ Comment your views or setups — let’s grow together
🔁 Share it with traders who want clean, disciplined analysis
👉 Follow @STWP for more structured trade setups, zone-based insights, and disciplined trading approach.
🚀 Stay Calm. Stay Clean. Trade With Patience.
Trade Smart | Learn Zones | Be Self-Reliant 📊
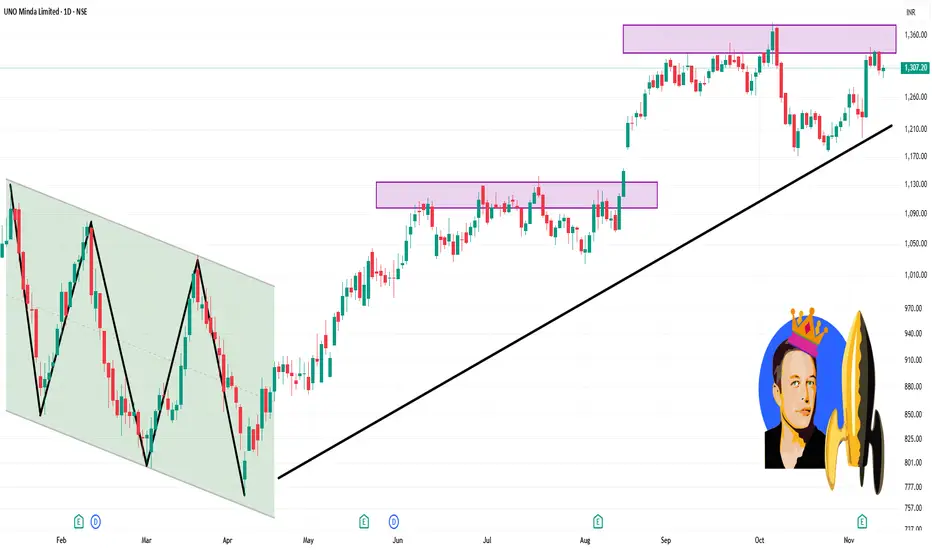
UNOMINDA 1 Day Time Frame 🔍 Current Price & Range
Last close: ~ ₹1,307.20.
Day range: ~ ₹1,290.05 (Low) → ₹1,311.05 (High).
VWAP: ~ ₹1,302.08.
✅ How to use these levels
If price holds above ₹1,290 and moves upward past ₹1,311 with volume, then a move toward ₹1,330-₹1,340 becomes plausible.
If price breaks below ₹1,290 on strong volume, watch for decline toward ~ ₹1,280 or worse.
Use stop-losses and manage risk, especially since the stock is trading near its 52-week high (~ ₹1,382) which may create stronger resistance.
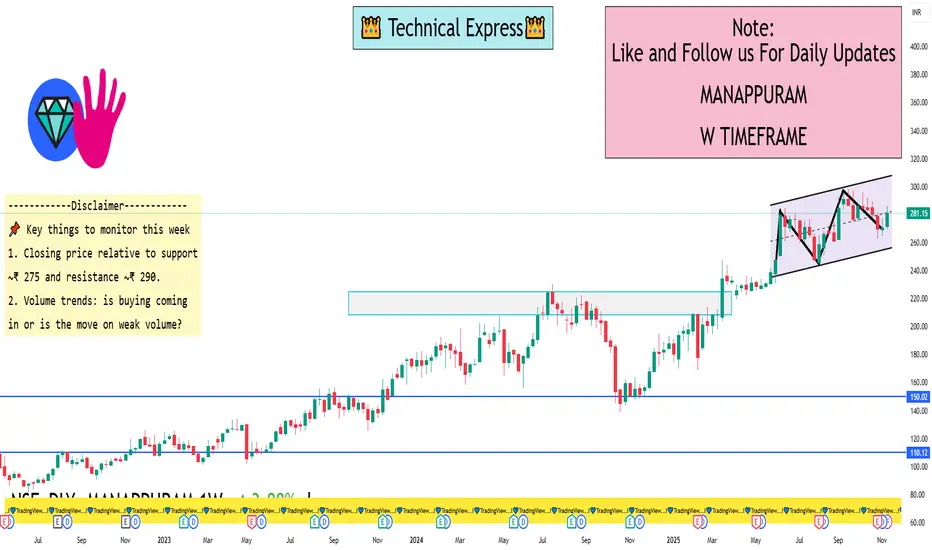
MANAPPURAM 1 Week View✅ Current state & context
The stock is trading around ₹ 281.15 as of 14 Nov 2025.
Recent technical scan shows a “Buy” to “Strong Buy” rating in the 1-week horizon via trading-view style indicators.
From the weekly performance note: the 20-day moving average crossover appeared recently, which historically has seen a ~3.9% average gain in ~7 days (on this stock) when that signal appears.
On the fundamental side, the stock is trading at relatively high valuations (P/E ~ 50+ times) and has seen significant price appreciation in recent months.
🎯 Key support & resistance levels for the next week
From the recent price action and technical indicators:
Support zones to watch
Near the recent swing low / consolidation area around ₹ 270-275. If price pulls back, this zone could act as first buffer.
Next deeper support around ₹ 260-265, which might catch if a stronger correction shows up.
Resistance zones to watch
Immediate resistance around the recent high ~ ₹ 290-295 (given the 52-week high is ~₹ 298).
If momentum continues, a break above ~₹ 300 might open further upside, but that would require strong volume and favourable catalyst.
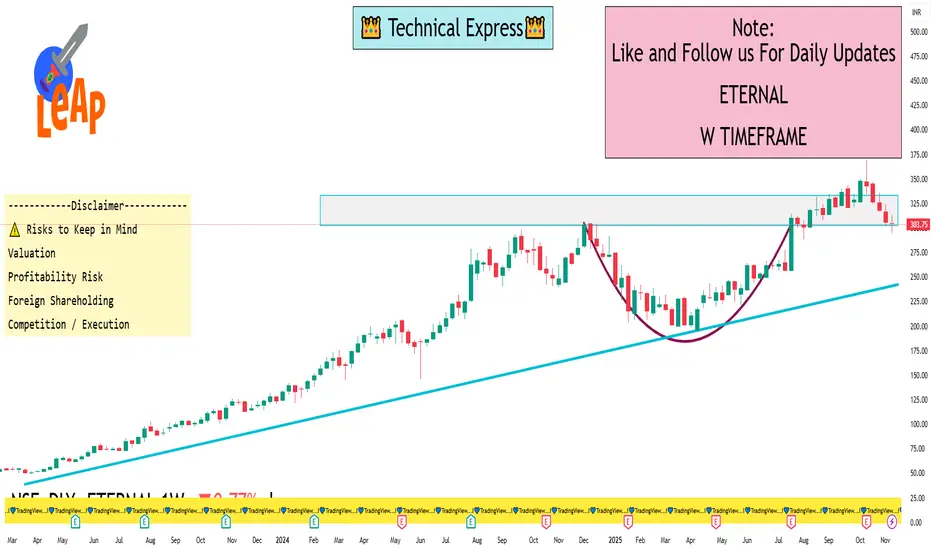
ETERNAL 1 Week View🔎 Weekly Timeframe Levels & Technical Picture
1. Current Price Context
a) Eternal is trading around ~₹303–306.
b) On 5paisa, support levels: ~₹297.3 (S1), then ~₹290.8 (S2).
c) Their 200-day SMA (on weekly or daily) is around ~₹280.2 (etMoney data).
2. Trend Structure & Key Zones
a) Major Support Zone: ~₹290–300 — this is a psychologically important zone, and there’s technical support around here.
b) Resistance / Key Level: ~₹320 — based on multiple trader viewpoints, breaking decisively above 320 could change short-term bias.
c) According to etMoney, RSI on weekly is not overly strong; momentum is somewhat neutral-to-down.
3. Chart Patterns / Candlestick Signal
a) Some traders point to a bearish engulfing pattern on the weekly.
b) If the weekly closes below ~₹320 with this pattern, the bearish case gains strength (according to those traders).
c) On the flip side, if 320 holds and price bounces, we might see a retracement or consolidation rather than a full breakdown.
4. Valuation Risk / Fundamental Pressure
a) Eternal’s valuation is very rich: its P/E is extremely high, which concerns some market participants.
b) On the fundamental side: strong revenue growth is being driven by Blinkit (quick commerce), but profit pressures remain.
c) According to a report, losses might have peaked, but execution risk remains.
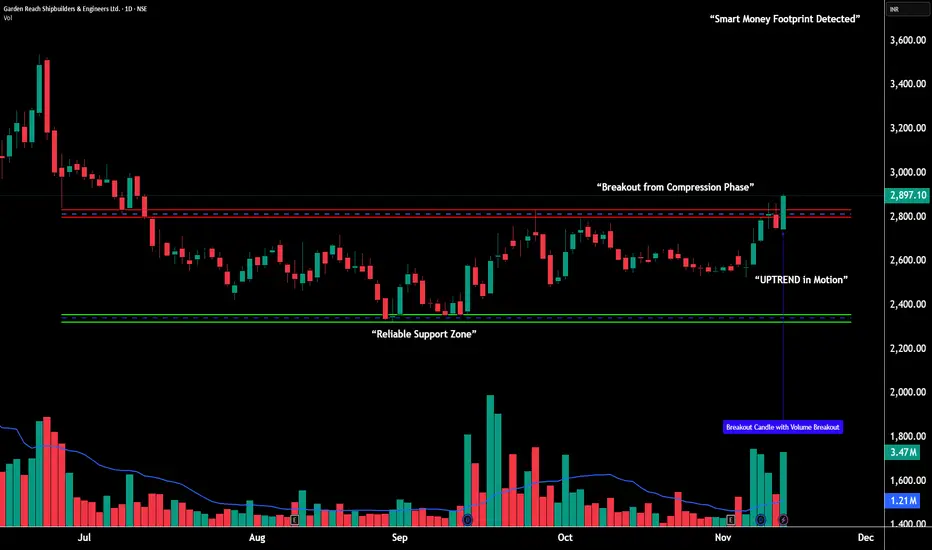
GRSE – Bullish Continuation Breakout |________________________________________
💹 Garden Reach Shipbuilders & Engineers Ltd (NSE: GRSE)
Sector: Defence & Engineering | CMP: 2,897.10
View: Bullish Momentum Breakout with Institutional Strength
________________________________________
📊 Price Action (Explained Simply):
GRSE has shifted from a slow sideways phase into a strong uptrend after rising from the 2,323 swing low to 2,904 with two powerful, wide-range green candles.
The most important part of this move is the huge jump in volume — 3.47M shares traded vs 1.21M average — which clearly signals institutional accumulation.
This breakout shows that the stock has moved from “quiet preparation” into “active momentum,” and holding above the 2,790–2,820 zone will be crucial for the continuation of this trend.
________________________________________
📉 Chart Pattern – Continuation Breakout:
After multiple accumulation attempts between 2,500–2,650, GRSE broke out with a clean, strong bullish marubozu candle.
This candle confirms buyer dominance throughout the session and typically marks the start of a new trending leg.
The structure now supports sustained follow-through as long as the stock maintains support above key zones.
________________________________________
📈 STWP Trading Analysis:
Bullish Breakout Zone: 2,897.10 - 2,904.40
Stop Loss: 2,735
The stock is now trading above short- and mid-term EMAs with trend alignment visible across daily, weekly, and monthly charts.
Sustaining above 2,790–2,820 keeps the bullish structure intact, while a strong close above 3,100 can trigger the next momentum wave.
________________________________________
🕯️ Candlestick Structure – Bullish Engulfing + Bullish Marubozu:
The current breakout session displays a Bullish Engulfing candle followed by a strong Bullish Marubozu, showing complete dominance from buyers. The engulfing pattern absorbed the previous red candle entirely, signaling a clear shift in control, while the marubozu confirms uninterrupted buying pressure throughout the session. When these two patterns appear together — backed by a sharp surge in volume — it reflects institutional accumulation and high conviction demand entering the stock. Such powerful candlestick combinations near breakout zones often act as trend-continuation triggers, indicating that buyers are firmly in charge and gearing up for the next upward expansion.
________________________________________
📏 Fibonacci Analysis:
Using swing low 2,323 → swing high 3,538:
38.2%: 2,787 → Strong support
50%: 2,930 → Active consolidation zone
61.8%: 3,047 → First major resistance
78.6%: 3,278 → Extended resistance
As long as the stock holds above 2,790–2,820, the Fibonacci map supports continuation toward higher levels.
________________________________________
🧭 Support & Resistance (STWP Levels):
Resistances: 2,955 | 3,010 | 3,116
Supports: 2,791 | 2,685 | 2,628
The zone around 2,790–2,820 is now the primary demand base and acts as the key level to protect for bullish continuation.
________________________________________
📊 Volume & Technical Setup:
Volume: 3.47M vs 1.21M → Clear institutional activity
RSI: 69 → Strong but healthy momentum
Stochastic: 98 → Buyer dominance
CCI: 205 → Strong trend confirmation
MACD: Bullish → Trend aligned across timeframes
Trend Direction: UPTREND
Volume Confirmation: Strong institutional participation
________________________________________
🧩 STWP Summary View:
Momentum: Strong
Trend: Bullish
Risk: Moderate
Volume: High
GRSE has entered a clean breakout phase supported by strong volume, supportive sector sentiment, and consistent institutional footprints.
As long as the stock protects the 2,790–2,820 zone, the path remains open toward 3,075 → 3,275 and, in a strong extension, toward 3,538.
________________________________________
⚠️ Disclosure & Disclaimer – Please Read Carefully
This analysis is for educational purposes only and should not be treated as investment advice or a buy/sell recommendation.
I am not a SEBI-registered investment adviser. All insights are based on price action, technical structure, and publicly available data.
Trading involves risk — always manage position size, stop-loss, and discipline.
Please consult a SEBI-registered financial advisor before trading based on any analysis.
________________________________________
Position Status: No active position in (GRSE) at the time of posting.
Data Source: TradingView & NSE India
________________________________________
💬 Found this useful?
🔼 Boost this post to help more learners discover structured analysis.
💭 Share your thoughts — can GRSE carry this momentum above 3,100?
🔁 Share with traders tracking defence-sector strength.
👉 Follow for more clean, price-action based institutional setups.
🚀 Stay Calm. Stay Clean. Trade With Patience.
Trade Smart | Learn Zones | Be Self-Reliant 📊
________________________________________
Thyrocare-A beautiful breakout is done!Thyrocare has given a good closing today above its previous ATH.
Stock has formed a beautiful rounding bottom pattern. Volumes buildup before breakout is decent as well.
Previously, i had covered Policybazar & Zomato with such patterns and they have given amazing returns.
Keep this stock in watchlist. This can give similar move as well.
Entering at ATH levels is tricky but these stocks come with excellent reward opportunity.
I am NISM certified RA and not SEBI registered.
This is not a recommendation but is shared for you to learn.

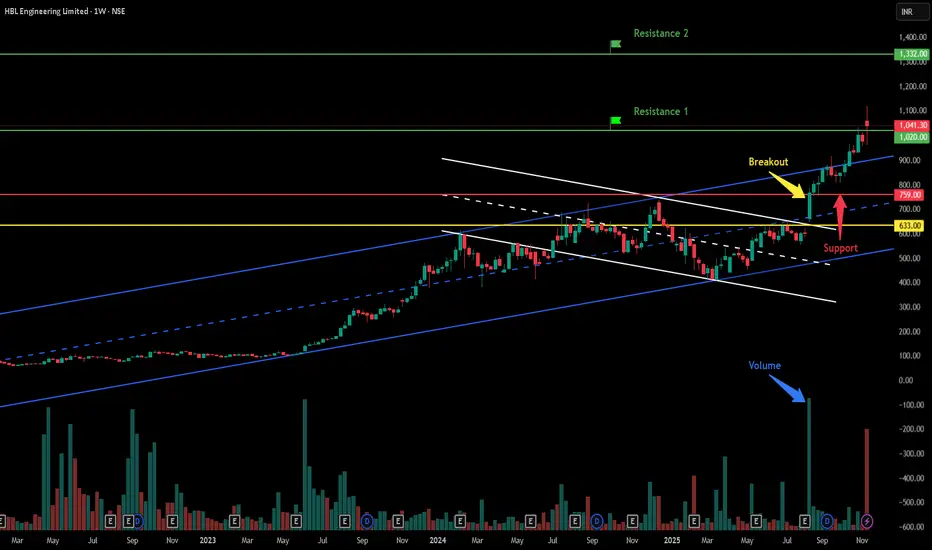
HBL Engineering Ltd - Breakout Setup, Move is ON...#HBLENGINE trading above Resistance of 1020
Next Resistance is at 1332
Support is at 759
Here is previous chart:
Chart is self explanatory. Levels of breakout, possible up-moves (where stock may find resistances) and support (close below which, setup will be invalidated) are clearly defined.
Disclaimer: This is for demonstration and educational purpose only. This is not buying or selling recommendations. I am not SEBI registered. Please consult your financial advisor before taking any trade.
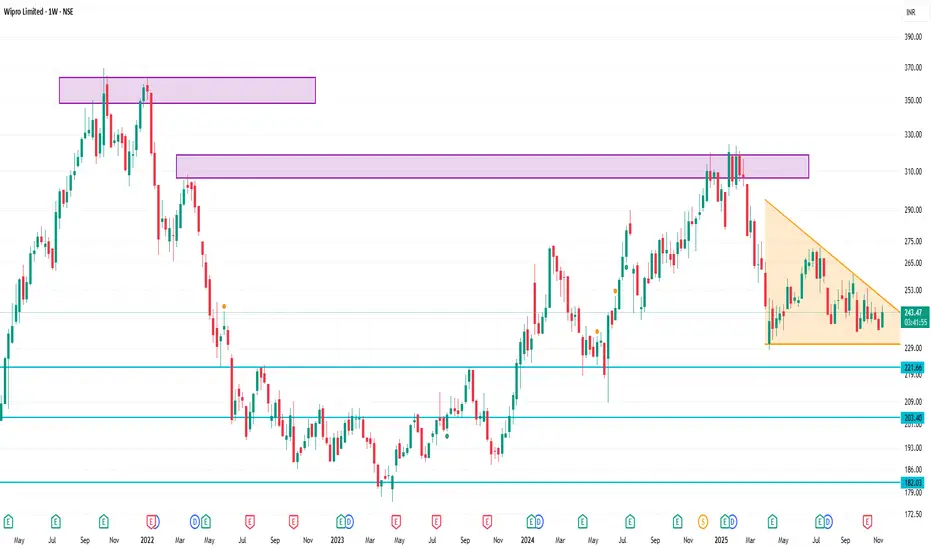
WIPRO 1 Week Time Frame🔍 Key levels
Current price (approx): ₹ 236.49.
Recent weekly low zone / support: around ₹ 235–238. (Recent lows noted ~₹ 236.00)
Near-term resistance / recent highs: around ₹ 243–245.
Technical sentiment: The 1-week technical rating from one source shows a “Sell” bias.
🎯 Implication for the next week
If WIPRO holds above the support ~₹235-238, it could attempt a bounce toward ~₹243-245.
If support breaks below ~₹235, next downside risk could open up (so watch for a break).
Because sentiment is weak (Sell bias), expect any rebound to be modest unless strong catalyst appears.
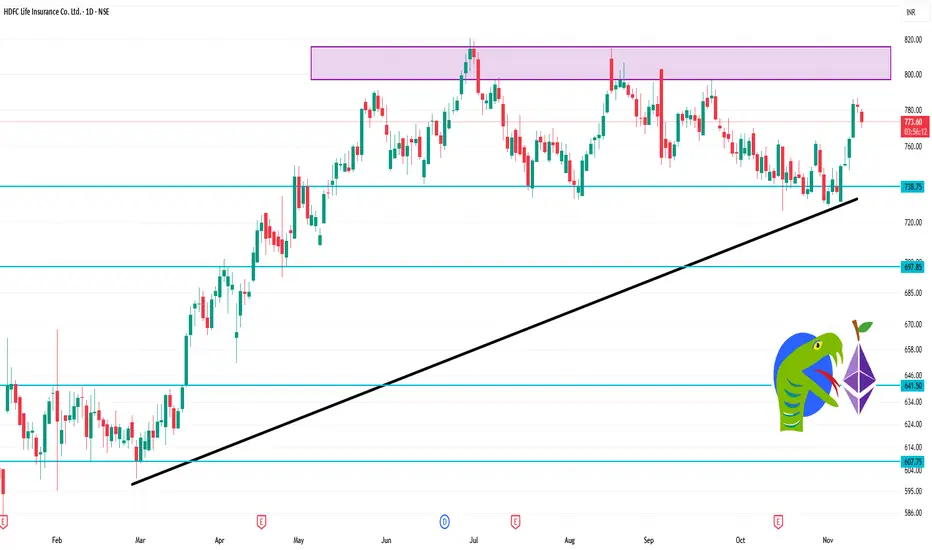
HDFCLIFE 1 Day Time Frame level Current/Live price: ~ ₹ 774.15 (down ~1.03 %)
Today’s high: ~ ₹ 780.30
Today’s low: ~ ₹ 770.10
⚠️ Important Caveats
This is not investment advice. Intraday price action is inherently volatile and can change quickly.
I don’t have full access to live tick-by-tick data or order-book depth in this summary.
Broader market, sector news, and company-specific announcements could abruptly change the trajectory.
For trading, risk management (stop loss, position size) is crucial especially in a large-cap like HDFC Life.
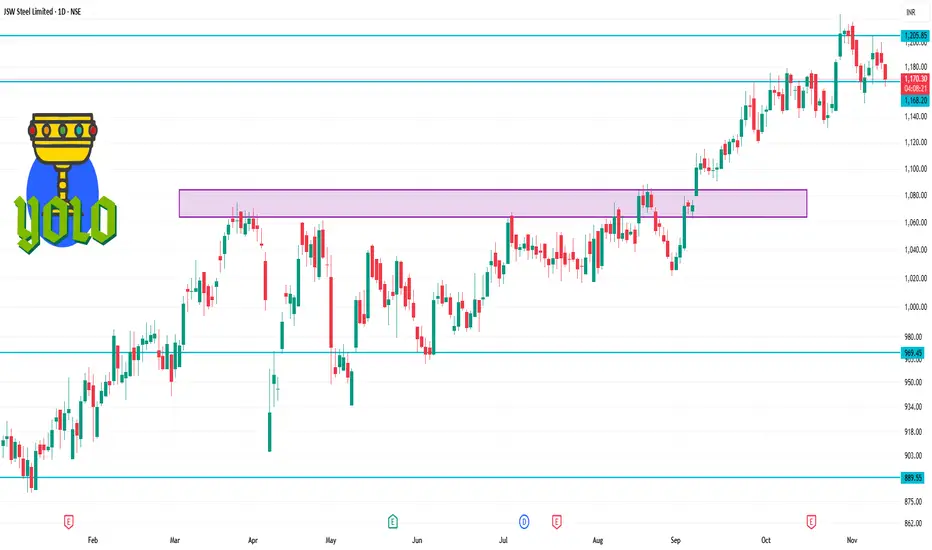
JSWSTEEL 1 Day Time Frame 🔍 Key Levels
Support zone: ~ ₹1,175–₹1,158 (some analyses list support at ~₹1,175, ~₹1,168, ~₹1,158)
Immediate resistance zone: ~ ₹1,192–₹1,209 (resistance at ~₹1,192, ~₹1,202, ~₹1,209)
Pivot point (daily-style): ~ ₹1,070.90 (from one pivot table)
📌 My commentary
The chart suggests if the price falls below ~₹1,175–₹1,158, further downside risk may increase in the short term.
On the upside, a breakout above ~₹1,200–₹1,209 could signal upside momentum building.
Because the pivot (~₹1,070) is significantly lower than current prices in many analyses, it may be less relevant for very short-term trades but still a longer-term structural reference.