DIXON 1 Day Time Frame 📊 Current Price Snapshot (Daily)
Latest traded price: ~₹10,300 – ₹10,460 approx on NSE/BSE (mid-day range).
Today’s price range: ₹9,835 (low) – ₹10,843 (high).
52-week range: ₹9,835 – ₹18,471.
Bias: The stock remains below key short-term averages (e.g., 20/50/100-day EMAs), indicating a bearish daily trend until price successfully closes above resistance levels.
📈 Daily Pivot & Technical Levels (1-Day Time Frame)
🔹 Pivot Point (Daily Centre)
• Pivot: ~₹10,276 – ₹10,496 (central reference for today’s bias)
🚧 Resistance Levels (Upside)
1. R1: ~₹10,496 – ₹10,500 (1st resistance zone)
2. R2: ~₹10,656 – ₹10,660 (daily push-back region)
3. R3: ~₹10,876 – ₹10,880 (higher barrier)
👉 A sustained daily close above ~₹10,500–₹10,650 is needed to reduce near-term bearish momentum.
📉 Support Levels (Downside)
1. S1: ~₹10,116 – ₹10,120 (initial support)
2. S2: ~₹9,896 – ₹9,900 (secondary cushion)
3. S3: ~₹9,736 – ₹9,740 (deeper support)
👉 Breach of ₹9,900 and then ₹9,740 could expand downside risk on the daily chart.
💡 Quick Trading Reference — Today
Bullish bias resume only if price closes above:
✔️ ₹10,500 (initial breakout)
✔️ ₹10,650+ (confirmation of relief rally)
Bearish pressure sustained while below these:
⏬ ₹10,116 → first downside target
⏬ ₹9,896 – ₹9,740 → strong support zones
Chartbychart

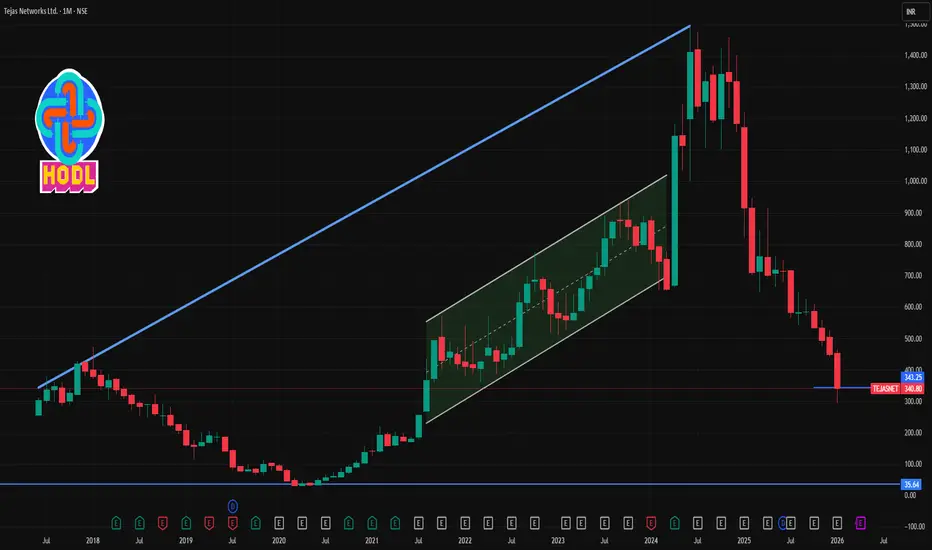
TEJASNET 1 Month Time Frame 📊 Current Price Snapshot (Approx)
Last traded price ~ ₹330-₹345 on NSE/BSE during late Jan 2026, after recent volatility and sell-offs.
📉 1-Month Timeframe — Key Levels
🔻 Support Levels (Downside)
These are levels where the stock could find buyers or pause losses on a 1-month chart:
Support Zone Significance
₹320 – ₹325 Immediate support; recent intraday floor (current price region)
₹301 – ₹315 Secondary support zone from pivot breakdowns
₹285 – ₹300 Deeper support if broader bearish momentum continues
📈 Resistance Levels (Upside)
Resistance Zone Importance
₹355 – ₹360 1st resistance from short-term moving average relevance
₹370 – ₹375 Next resistance cluster near recent intraday reactions
₹390 – ₹395 Higher resistance if bounce gains strength
🧠 Technical Indicator Context (1-Month)
📉 Trend Bias: Bearish overall, price trading significantly below major moving averages (20-day, 50-day, etc.).
📊 RSI: Near oversold but not confirmed bottom — suggests bearish momentum but potential for short-term rebounds.
📉 MACD & STOCH: Bearish signals persist, indicating weak price action on the 1-month chart.
🗂 Summary — 1-Month View
⚠️ Bearish Bias: The stock is in a short-term downtrend, trading below key moving averages and suffering weak momentum.
🛑 Support in Focus: ₹320-₹315 first; further deeper zone near ₹285-₹300 if bears intensify.
📈 Resistance Roadblock: ₹355-₹360 key for initial bounce; stronger rally needs break above ₹370+.
📉 Bearish Technicals: RSI not strongly indicating reversal yet; MACD remains bearish.
ASIANPAINT 1 Week Time Frame 📊 Current Price Context
Recent share price was trading around ₹2,423–₹2,515 range (latest intraday/previous close range) according to market data.
📈 Weekly Timeframe Levels — Asian Paints (NSE)
🔴 Resistance (Upside)
These are levels where price may face selling pressure or pause on the upside in the coming week:
1. ₹2,560–₹2,565 — Immediate near‑term resistance zone seen from short weekly consolidations.
2. ₹2,720–₹2,760 — Mid resistance zone where upside moves often stall on weekly/daily clusters.
3. ₹2,820–₹2,860+ — Higher weekly resistance zone — breakout above this could indicate stronger momentum.
🟢 Support (Downside)
These are levels where price might find buying interest or a floor on weekly charts:
1. ₹2,440–₹2,460 — Immediate support from weekly lower bands and short pivot support.
2. ₹2,340–₹2,380 — Secondary support zone seen from historical price clusters and volatility bands.
3. ₹2,300–₹2,250 — Major structural support — breakdown here could lead to deeper correction.
📉 Pivot Zone
₹2,500–₹2,530 — A central pivot/neutral range this week; trading above suggests short bullish bias, below suggests bearish.
📌 Weekly Technical Bias (Summary)
Bullish Scenario: A sustained weekly close above ₹2,560–₹2,565 opens path toward ₹2,720–₹2,860.
Bearish Scenario: Failure to hold ₹2,440–₹2,460 could drag price toward ₹2,340–₹2,300 on the weekly chart.
Range Play: Price oscillating between ₹2,440 – ₹2,560 indicates consolidative behavior typical in neutral markets.

JLHL 1 Day Time Frame 📌 Current Live Price (1‑Day)
Last traded price: ~₹1,305–₹1,322 range today on NSE/BSE.
Day’s range: ~₹1,301–₹1,359.
📊 Intraday Technical Levels (1‑Day Time Frame)
🔹 Pivot & Reference
No concrete official pivot published for today across many free data sites, but general intraday pivot technique (based on brokers’ short‑term screens) focuses around mid‑range prices near ₹1,310–₹1,320 as neutral area.
🔼 Resistance Levels (Upside)
These are zones where the price may face selling pressure on the same trading day:
1️. ₹1,350–₹1,360 — initial resistance zone (recent intraday high area).
2️. ₹1,375–₹1,390 — secondary resistance if price clears the initial zone.
🔽 Support Levels (Downside)
These are zones where buyers may step in intraday:
1️. ₹1,290–₹1,300 — nearest support band (recent intraday low).
2️. ₹1,270–₹1,280 — next lower support cluster (near the 52‑week low region).
🧠 Intraday Trading Interpretation
Bullish bias intraday if:
Price breaks above ₹1,350–₹1,360 with volume → could test higher around ₹1,375–₹1,390.
Bearish bias intraday if:
Price loses ₹1,290 support → risk of slide toward ₹1,270+ zone.
Range‑bound scenario:
Price oscillates between ₹1,290–₹1,350 if participation stays muted.

HPCL 1 Month Time Frame 📌 Current Price Reference
HPCL’s share price is around ₹410 – ₹435 in late January 2026.
📊 1‑Month Technical Levels
🔵 Support Levels (Downside)
These are zones where the price historically finds buying interest or could rebound if selling increases:
1. Major Support: ~ ₹449–₹454 — key near‑term support zone (weekly lower support).
2. Secondary Support: ~ ₹460 — if price consolidates above this level, trend may hold.
3. Deeper Support Zone: ~ ₹454–₹449 (extended pullback).
4. Additional Lower Band: Recent pivot around ₹440–₹435 from broader charts (may act short‑term cushion).
➡️ Break below these can signal further downside to the 1‑month range.
🔴 Resistance Levels (Upside)
These are levels where price might face selling pressure or may struggle to sustain gains:
1. Immediate Resistance: ~ ₹478–₹481 — short‑term ceiling.
2. Next Key Barrier: ~ ₹484–₹486 — stronger resistance zone.
3. Stretch/Upper Target: ~ ₹490–₹494 (+) — if momentum continues bullishly.
⚖️ Pivot Reference
Pivot Level: ~ ₹449 — central point indicating bias above this tends mildly bullish, below could favor sellers.

HMVL 1 Month Time Frame 📊 Current Price Snapshot (Latest Close)
- Approximate latest price: ₹70.9 – ₹72.2 per share (data from multiple live sources on 23 Jan 2026) showing HMVL trading around ~₹71–₹72 levels.
- Intraday range: ₹69.00 – ₹72.00 recently observed.
- 52‑week range: ₹61.76 (low) to ₹103.40 (high).
📈 1‑Month Performance
- Over the past 1 month, the stock’s performance shows a slight decline or mild sideways move: approx −1 % to −3 % change depending on the exact start/end dates used (TradingView indicated ~‑2.75 % monthly fall).
- Other data suggests very modest monthly change (slight positive/negative depending on source).
📅 Recent Daily Price Levels (Indicative)
From historical price data for the first half of January 2026:
01 Jan 2026: ~₹68.5
06 Jan 2026: ~₹70.4
09–12 Jan 2026: ~₹66‑₹69
16–23 Jan 2026: ~₹69‑₹72
→ This shows a 1‑month trading range roughly between ~₹65 and ~₹72.
📍 1‑Month Key Levels to Watch
Support zone: ~₹65 – ₹67 (recent lows).
Near‑term resistance: ~₹72 – ₹74 (recent highs).
Mid‑range pivot: ~₹69 – ₹71 — recent close vicinity area.

WAAREEENER 1 Week View📍 Live Price Snapshot (Approximate)
The stock is trading around ₹2,590–₹2,600 on the NSE in recent sessions.
📊 1-Week Timeframe Levels
🔼 Resistance (Upside)
These are levels where price may face selling pressure:
₹2,606 – ₹2,610 — Immediate resistance / pivot-R1 zone this week.
₹2,659 – ₹2,660 — next resistance above pivot.
₹2,690 – ₹2,700 — higher weekly resistance zone.
👉 A sustained breakout above ₹2,660–₹2,690 could suggest short-term strength on the weekly chart.
🔽 Support (Downside)
Key support zones where buyers may step in:
₹2,554 – ₹2,550 — first support zone for the week.
₹2,467 – ₹2,470 — next support if the first breaks.
₹2,374 – ₹2,375 — deeper support level below.
📌 Weekly Trend Notes
Current weekly indicators (RSI/MACD etc.) lean bearish or neutral, with RSI low and MACD negative — indicating short-term downward momentum.
The chart is showing below key moving averages (20/50 day) — typically short-term bearish pressure.
Recent news showed a strong earnings rally around Jan 22, 2026, lifting the stock near higher levels, but price remains below longer-term averages.

KFINTECH 1 Week Tme Frame 📌 Current Price Context
Last close / recent price: ~₹1,018–₹1,019 per share on NSE.
The stock has been weakening over the past week (down ~‑4‑5%).
Price range today: high ~₹1,053 / low ~₹1,016.
📊 Key Pivot & Weekly Levels (1‑Week Focus)
🔹 Pivot (Reference)
Weekly pivot: ~₹1,024 area (central weekly level).
📉 Support Levels (Downside Zones)
Level Price Area What it Means
Near‑term support (S1) ₹1,006 Immediate floor — first downside buffer.
Short support (S2) ₹978–₹980 Next support if selling accelerates.
Deeper support (S3) ₹955–₹960 Stronger lower support on weekly chart.
Below ~₹1,006 weakens short‑term structure and increases bearish risk.
📈 Resistance Levels (Upside Barriers)
Level Price Area What it Means
R1 ₹1,056 Immediate resistance — key 1‑week upside test.
R2 ₹1,079 Secondary barrier — sellers often near here.
R3/Strong resistance ₹1,106–₹1,110 Major breakout zone above recent range.
Above ~₹1,056–₹1,060 would signal less bearish pressure and possibly range recovery.
🔍 Quick Reference Levels (1‑Week)
Support: ~₹1,006 → ₹978 → ₹955
Pivot: ~₹1,024
Resistance: ~₹1,056 → ₹1,079 → ₹1,106+

HINDUNILVR 1 Day Time Frame 📊 Live 1‑Day Price Snapshot (Today’s Trading – India NSE)
🔹 Current Price: ₹2,409.50 INR (latest available intra‑day quote)
🔹 Previous Close: ₹2,390.60 INR
🔹 Day’s Trading Range: ₹2,376.80 – ₹2,434.30 INR
🔹 Volume (Approx): ~1.3 M shares traded
🔹 52‑Week Range: ₹2,136.00 – ₹2,750.00 INR
📈 This is live market data for today’s session (latest trading information available from stock exchange and market feeds).

KALYANKJIL 1 Week Time Frame 📌 Current Price Snapshot (Weekly Context)
₹~391–396 — the stock is trading near its 52‑week low range after heavy selling pressure.
NSE/BSE trend is bearish on weekly charts (sell signals and down momentum).
📊 1‑Week Time Frame – Pivot & Key Levels
📉 Weekly Pivot & Levels (from pivot analysis)
(These are derived from weekly pivot point calculations, representing expected turning points for the week)
📌 Weekly Pivot:
Pivot: ~₹479.12
👊 Weekly Resistances:
R1: ~₹495.23
R2: ~₹522.97
R3: ~₹539.08
🛑 Weekly Supports:
S1: ~₹451.38
S2: ~₹435.27
S3: ~₹407.53
👉 The current market price (~₹392–396) is below the first major weekly support (~₹451) and closer to the third weekly support at ~₹407.5 — indicating deep bearish momentum this week.
🧠 Summary – 1‑Week Level Playbook
Bearish near‑term risk:
Break below ~₹407 opens potential towards psychological lower bands.
Key levels for traders this week:
Support to watch: ~₹407 (S3)
Initial resistance to challenge: ~₹451 (S1 on weekly pivot)
Major resistance zones: ~₹495 and ~₹523

VEDL 1 Week Time Frame 📊 Current Price Context (approximate latest)
• Vedanta is trading around ₹660‑₹675 range on NSE as of the latest session.
📈 Weekly Resistance Levels
These are levels where the stock might face selling pressure on an upward move:
Resistance Zones
1. ₹682–₹688 area – near recent intraday highs and 52‑week high cluster.
2. ~₹693–₹700 – broader higher resistance in week ahead.
3. Above ₹700 – extended breakout zone if bullish momentum accelerates.
👉 Bullish breakout triggers shorter‑term targets toward these zones, especially if sustained above daily pivots/resistance.
📉 Weekly Support Levels
These are areas where price might find buyers or pullback cushions:
Support Zones
1. ~₹665–₹658 – immediate weekly support cluster.
2. ~₹647–₹648 – next meaningful support if the price weakens.
3. ~₹620–₹630 – deeper pivot/demand zone from recent action (from broader short‑term analysis).
4. ~₹560–₹570 – more distant support if the stock corrects further from current levels.
👉 A break below ₹658–665 on weekly closes could shift bias toward deeper support ranges.
🔁 1‑Week Bias Summary
Scenario Level to Watch What It Implies
Bullish continuation Above ₹682–₹688 Can target ₹693–₹700+
Neutral / congestion ₹665–₹658 Choppy range, sideways trades
Bearish correction Below ₹658 Deeper support at ₹620–₹570+

CREDITACC 1 Week Time Frame 📌 Current Price Context (21 Jan 2026)
Approx current price: ~₹1,330 – ₹1,370 on NSE as of recent trading session.
📊 Weekly Technical Levels (1-Week Timeframe)
These levels are derived from recent weekly pivot analysis (reflecting highs/lows and average weekly trend):
Weekly Pivot Point: ~ ₹1,300 – ₹1,305
Weekly Resistance Levels:
R1: ~ ₹1,325 – ₹1,330
R2: ~ ₹1,350 – ₹1,360
R3: ~ ₹1,375+
Weekly Support Levels:
S1: ~ ₹1,275 – ₹1,280
S2: ~ ₹1,250 – ₹1,255
S3: ~ ₹1,225 – ₹1,220
(Classic pivot study — see weekly pivot table)
📈 Short Summary of Weekly Bias
Bullish scenario:
if the price sustains above weekly pivot (~₹1,300) and breaks above R1 (~₹1,330), momentum favors moves toward R2 (~₹1,350-1,360) and possibly R3 (~₹1,375) for the coming week.
Neutral / Range scenario:
Between ₹1,275 to ₹1,330, price tends to oscillate within the weekly range with no clear directional bias — traders watch pivot and R1/S1 zones.
Bearish scenario:
A break below S1 (~₹1,275) increases the risk of deeper probes toward S2 (~₹1,250) or S3 (~₹1,220) on the weekly chart.
📌 How to Use These Levels
1. Short-term traders (swing): Watch catalystsensing breaks above R1/R2 for bullish continuation setups or break below S1/S2 for bearish setups.
2. Position traders: Weekly pivot and 50/100 SMA clusters (around ₹1,300-₹1,340) act as key decision zones for holding or trimming positions.

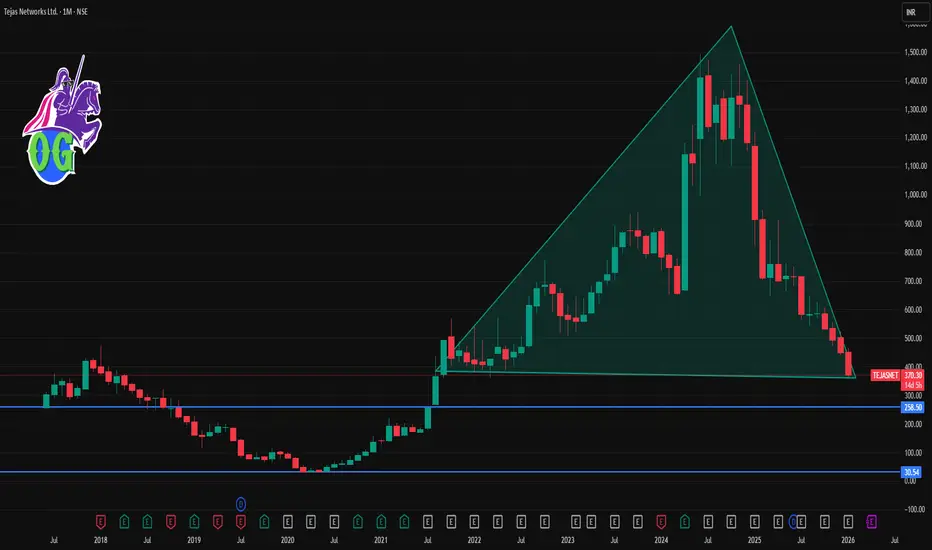
TEJASNET 1 Month Time Frame 📊 Current Price Context (as of mid‑January 2026)
Tejas Networks is trading around ₹370‑₹375 on NSE/BSE.
The stock recently hit a 52‑week low near ₹364 after weak quarterly earnings and sales decline.
📉 Short‑Term Technical Levels (1‑Month View)
🔻 Immediate Support Zones
These are levels where the stock could find buyers or stall further declines:
₹366‑₹370 — current short‑term support (intraday pivot & recent low).
₹362‑₹366 — lower pivot/secondary intraday support.
~₹356‑₹362 — deeper support if momentum remains weak.
📈 Resistance Levels (Upside Hurdles)
For any bounce or recovery attempt:
₹377‑₹380 — near current pivot/resistance range.
~₹390‑₹395 — next resistance zone (prior price congestion).
₹405‑₹410+ — stronger resistance (short‑term target for recovery).
🧠 Trading/Price Action Tips (1‑month)
Bullish Scenario (countertrend bounce):
A break above ₹380‑₹390 with good volume could shift short‑term sentiment and target ₹405‑₹410+.
Bearish/Continued downtrend:
If support at ₹366‑₹370 breaks convincingly, the next zone near ₹362 then ₹356–₹360 becomes focus.
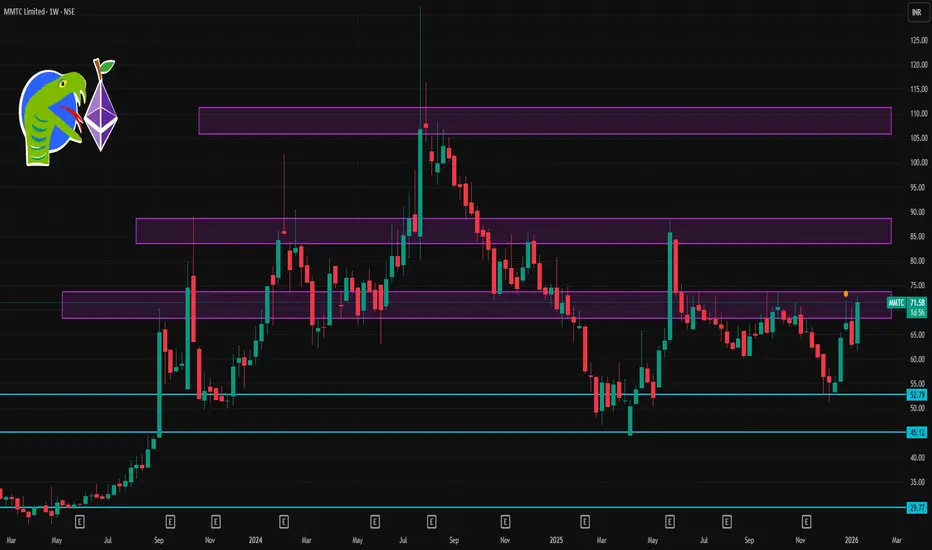
MMTC 1 Week Time Frame 📌 Current Price Snapshot
Latest traded price: ~₹71.5 – ₹72.7 on NSE today with strong intraday volatility. Daily high ~₹72.70 and low ~₹63.86.
This wide daily range suggests higher volatility this week — at least through the next few sessions.
📊 Short‑Term Weekly Levels
🔹 Resistance (Upside)
These are levels where price may face selling pressure or slow gains:
1. ₹72.5 – ₹73.0 — Immediate resistance area (today’s local high).
2. ₹75.0 – ₹76.0 — Next bullish pivot region if the stock holds above ₹72.5 (based on momentum models).
3. ₹78.0 – ₹80.0 — Stronger weekly upward pull target if bullish continuation holds.
👉 Closing above ₹75 on the weekly timeframe would indicate stronger short‑term bullish structure.
🔻 Support (Downside)
Levels where buyers may step in on pullbacks:
1. ₹66.0 – ₹67.0 — First dynamic support (near shorter moving averages).
2. ₹62.0 – ₹63.5 — Key lower support zone (recent daily lows).
3. ₹60.0 – ₹61.0 — Deeper weekly support — important to watch if breakdown accelerates.
👉 A break below ₹62 on weekly closes would weaken the bullish outlook and could open the door toward deeper supports.
📈 Technical Indicator Context
Technical breadth is largely bullish/momentum supportive:
📌 Moving Averages:
5, 10, 20, 50, 100, and 200‑day MAs all skew Buy — suggesting bullish trend alignment.
📌 RSI (14): ~65 — trending up but not yet extremely overbought.
📌 Stoch/RSI: Overbought on shorter timeframes — may hint at near‑term consolidation before higher breakout.
Summary: Momentum still skewed bullish overall, but short‑term traders should watch for near‑term pullbacks or consolidations due to overbought signals.
Nifty 50 1 Week Time Frame📌 Current Weekly Price (Live)
Nifty 50 approx ~25,730–25,740 (latest live level) — slight downside bias today.
📈 Weekly Resistance Levels (Upside)
1. 25,900 – 26,000 zone
• Immediate resistance above current price — key psychological barrier.
2. 26,100 – 26,200 zone
• Strong technical resistance (previous weekly highs & upper band).
3. 26,300+
• If breakout above 26,200 sustains, next upper resistance.
📉 Weekly Support Levels (Downside)
1. 25,600–25,650
• Near-term support from recent weekly structure.
2. 25,300–25,350
• Secondary support; zone where price has bounced previously on weekly charts.
3. 24,800–24,700
• Major structural support — breach here opens deeper correction risk.
📊 Weekly Technical Range to Watch
Neutral/Range-Bound View (Weekly):
⬆️ Bullish: Break & weekly close above 26,000–26,200
⬇️ Bearish: Break & close below 25,300–25,350
Between these levels, the index may consolidate before a clear directional move.
📌 Summary Weekly Levels (2026)
Resistance Zones
• 26,000 (key psychological)
• 26,100–26,200 (secondary)
• 26,300+ (extended)
Support Zones
• 25,600–25,650 (immediate)
• 25,300–25,350 (secondary)
• 24,800–24,700 (major)

REDINGTON 1 Week Time Frame 📌 Weekly Pivot‑Based Levels (from Moneycontrol weekly pivots)
(These are derived from weekly price action, giving support & resistance zones used by chart traders)
Resistance (Weekly)
R1: ~ ₹282.77
R2: ~ ₹289.23
R3: ~ ₹300.12
Pivot (Weekly Reference):
Pivot Point: ~ ₹271.88
Support (Weekly)
S1: ~ ₹265.42
S2: ~ ₹254.53
S3: ~ ₹248.07
📊 Interpretation:
Above ₹282–₹289 zone → broader weekly bullish bias if sustained toward ₹300+.
Below ₹265–₹271 pivot/support zone → weekly downside risk increases.
📊 Current Price Reference
NSE live price is trading around ~ ₹289–₹290+ on 8 Jan 2026.
📊 Summary – Key Weekly Levels to Watch
Level Price (Approx) Significance
Weekly Resistance 3 (R3) ₹300.12 Bullish breakout region
Weekly Resistance 2 (R2) ₹289.23 Near current price – short‑term hurdle
Weekly Resistance 1 (R1) ₹282.77 First weekly resistance
Weekly Pivot ₹271.88 Trend reference – bulls above
Weekly Support 1 (S1) ₹265.42 Key downside support
Weekly Support 2 (S2) ₹254.53 Deeper support
Weekly Support 3 (S3) ₹248.07 Extended downside support
📌 Bullish weekly bias is intact as long as price stays above the weekly pivot (~₹271‑₹272) and clears ₹282‑₹289 convincingly. Below ₹265, the next support zone becomes active.

WIPRO 1 Week Time Frame 🔎 Current Market Price
Approx Current Price: ~₹265–₹272 per share (latest trading range) — price moving around mid‑260s.
📅 1‑Week Timeframe Key Levels
🔥 Resistance (Upside Targets)
Level Meaning
R1: ~₹273.8 First Weekly Resistance — immediate upside ceiling.
R2: ~₹278.7 Higher Weekly Resistance — breakout level for more bullish momentum.
R3: ~₹285.0 Extended Resistance — major top zone for the week if breakout happens.
🛡 Support (Downside Floors)
Level Meaning
S1: ~₹262.7 Immediate Weekly Support — key near‑term buying zone.
S2: ~₹256.4 Secondary Support — next lower cushion if price weakens.
S3: ~₹251.6 Major Weekly Support — broad downside safety zone for this week.
➡️ Weekly Trading Range (expected): ~₹251.6 — ₹285.0 depending on strength and volatility.
📊 What This Implies
📈 Bullish Scenario
Above ~₹273.8: break past this zone could open room toward ~₹278–₹285 resistance.
Bullish continuation may be confirmed if the stock closes the week above ₹278–279.
📉 Bearish Scenario
Below ~₹262.7: breakdown under this support can expose deeper support at ~₹256 and further near ~₹251.6.
A weekly close lower than key supports suggests range continuation or mild negative bias.

CGPOWER 1 Day Time Frame📊 Daily Price Levels (1D Time Frame)
Current price range (recent session)
• Day’s trading range ~ ₹634–₹651 approx on NSE (latest close ~ ₹637–₹647) (as per recent data)
Pivot / Pivot‑based levels
• Daily Pivot: ~ ₹662 (central reference)
(use this as a neutral baseline — above favors bullish bias, below favors bearish bias)
Immediate Resistance
1️⃣ R1 ~ ₹665–₹668 (zone of immediate selling pressure)
2️⃣ R2 ~ ₹675–₹680 (next upside barrier)
3️⃣ Higher resistance (secondary) ~ ₹685–₹695+ (seen in other pivot data)
Immediate Support
1️⃣ S1 ~ ₹656–₹650 (first support zone)
2️⃣ S2 ~ ₹644–₹640 (next downside support)
3️⃣ S3 ~ ₹627–₹630 (deeper support)
📌 Interpretation (1‑Day)
If price holds above ₹656–₹650, the bias may stabilize and test ₹665–₹675 on the upside.
Break below ₹640–₹630 increases risk of further weakness in the short run.
Daily pivot at ~₹662 helps gauge short‑term trend — sustaining above it hints at short‑term buying interest, below it suggests continued pressure.
(These levels are typical pivot/sr zones used by traders; use live charts for exact current quotes.)
🧠 Extra Context (Technical Indicators)
Short‑term technical indicators (RSI & moving averages) have shown mixed to bearish signals recently, with several daily sell signals noted in external analysis.

Chart Patterns (Macro Structure + Psychology + Trading)Chart patterns arise over larger timeframes from the interaction of supply and demand. They help identify continuation or reversal of trends.
⭐ Advantages of Chart Patterns
Helps predict market direction – Shows whether price may continue or reverse.
Easy to understand visually – Patterns are simple shapes (triangles, flags, head & shoulders).
Gives clear entry and exit points – Breakouts and breakdowns guide trading decisions.
Works on all timeframes – Useful for intraday, swing, and long-term trading.
Useful for trend analysis – Helps identify strong or weak trends.
Improves accuracy when combined with volume – Volume confirms true breakouts.

MCX 1 Day Time Frame 📌 MCX Latest Daily Price Snapshot
Approx. Last Traded Price: ~₹10,172 – ₹10,307 range (recent sessions)
Today’s Intraday Range: ~₹10,181 – ₹10,365 (approx)
52‑Week High: ~₹10,847 and 52‑Week Low ~₹4,408
📊 Daily Time‑Frame Levels (1D)
🔹 Pivot Point
Daily Pivot: ~₹10,386 – ₹10,442 zone (central reference)
🔸 Resistance Levels
R1: ~₹10,519 – ₹10,600
R2: ~₹10,596 – ₹10,650
R3: ~₹10,729 – ₹10,800
These levels act as potential upside barriers on daily closes. A sustained breakout above R1/R2 suggests strength into the next resistance zone.
🔻 Support Levels
S1: ~₹10,309 – ₹10,300
S2: ~₹10,176 – ₹10,170
S3: ~₹10,020 – ₹9,993
If price breaks below S1/S2 on daily close, deeper support may be tested near S3.
📈 Trend & Technical Tone
Technical indicators on daily charts signal a bullish bias / strong buy on daily based on moving averages and buy signals vs. sell signals.
📊 How to Use These Levels (1‑Day)
Bullish View
Long/buy setups near S1‑S2 with targets around R1‑R
A breakout above R2 could extend toward R3
Bearish/Correction View
Failure at R1/R2 with reversal momentum could target S1/S2

JAINREC 1 Day Time Frame 📌 Latest price context:
• The stock has been trading around ₹400–₹410 in recent sessions (range today ~396.5–409) with latest close near ₹401.30.
📊 Daily Technical Levels (Approximations)
🔵 Resistance Levels
R1: ~₹418–₹420 — 1st key upside hurdle — pay attention for breakout.
R2: ~₹425–₹430 — Secondary resistance at previous reaction highs.
R3: ~₹435–₹440+ — Strong supply zone from past tops/52‑wk range.
🔴 Support Levels
S1: ~₹400–₹401 — Immediate floor pivot area around current price.
S2: ~₹390–₹392 — Near short‑term support from recent pullbacks.
S3: ~₹383–₹385 — Deeper support zone below recent correction lows.
S4: ~₹370–₹375 — Major support if price loses the current range.
📍 Daily Pivot (approx)
• Pivot ~ ₹400–₹402 — Price around this level gives neutral bias until breakout.

PFC 1 Day Time Frame 📊 Daily Pivot Levels
Pivot Point (Daily): ~₹343.00–₹343.30
Central Pivot (CPR):
• Top: ₹343.60
• Mid: ₹343.00
• Bottom: ₹342.40
📈 Resistance Levels (Daily)
R1: ~₹344–₹346
R2: ~₹347–₹348
R3: ~₹350–₹351
📉 Support Levels (Daily)
S1: ~₹338–₹341 (minor support)
S2: ~₹335–₹337
S3: ~₹332–₹334
🔍 Intraday Range to Watch
Near‑term range: ₹337–₹354, with crucial rejection/resume zones at ~₹337 (support) and ~₹352–₹354 (upper resistance).
📌 How to Use These Levels
Bullish breakout: Sustained close above the pivot ~₹343 with volume could target R1 → R2 (~₹347–₹350).
Bearish continuation: Failure below S1 (~₹338–₹341) increases odds of a drop toward S2/S3 (~₹335 / ₹332).
Pivot flips: Pivot pivots often act as support if price stays above, and as resistance if below.

RIL 1 Day Time Frame 📊 Current Price Context (approx):
RIL is trading near ₹1,540 – ₹1,550 intraday range today.
📈 1‑Day Resistance Levels
These are levels where the stock may face selling pressure or pause on the upside:
Intraday Daily Resistances (Pivots & Speed Levels):
R1: ~₹1,549 – ₹1,550
R2: ~₹1,557 – ₹1,557
R3: ~₹1,562 – ₹1,563
(above current price)
Extended intraday pivot R4 (if breakout):
~₹1,570+ (from broader pivot series)
📉 1‑Day Support Levels
Key levels where buyers may step in on dips:
Intraday Daily Supports:
S1: ~₹1,536 – ₹1,537
S2: ~₹1,531 – ₹1,532
S3: ~₹1,523 – ₹1,524
(below current price)
Weekly pivot support band (if selling accelerates):
Around ₹1,531 – ₹1,505+ (broader support zone)
