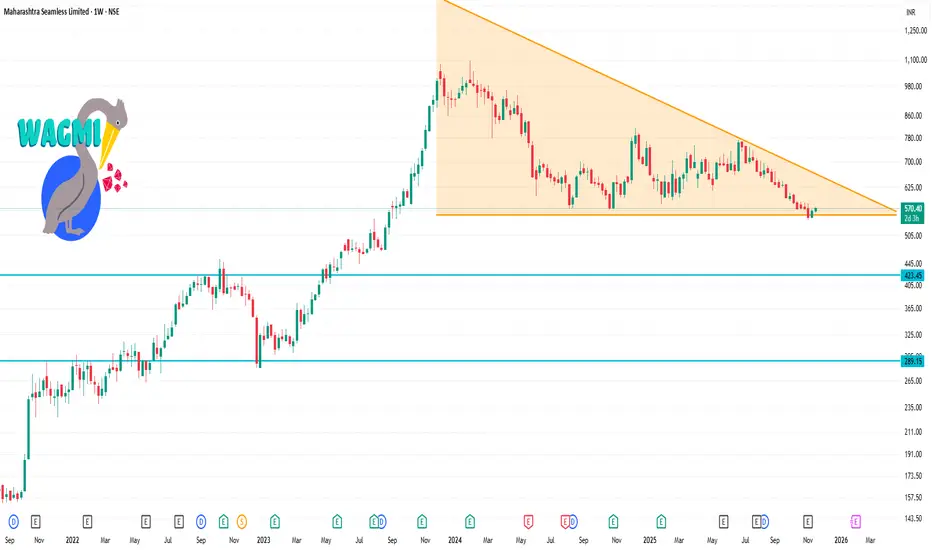
MAHSEAMLES 1 Week Time Frame 🔍 Current Price & Context
Latest price ~ ₹570 (on NSE as of today)
52-week low ~ ₹540.50, 52-week high ~ ₹814.30
On the daily technicals: recent signals show moving averages (shorter term) are positive, but the 200-day MA is still signalling “sell”.
📏 Weekly Timeframe Key Levels & Structure
Based on pivot-levels, support/resistance calculations and previous ranges:
Weekly pivot (Standard) around ~ ₹571.30
Support zone:
~ ₹557-560 region (S1) from pivot table.
A major structural support near ~ ₹540-550, given the 52-week low and previous reaction zone.
Resistance zone:
Immediate resistance ~ ~₹579-580 region (R1-R2) from weekly pivot table.
Broader resistance / upside hurdle near ~ ₹600+, and medium term near ~ ₹650-700+ (based on higher pivots & prior highs)
Chartpaterns
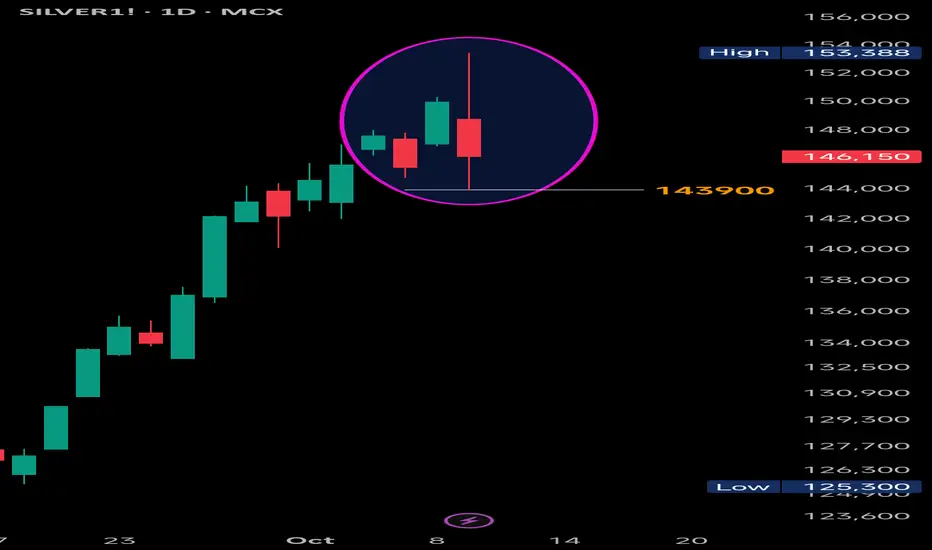
Silver: Bearish Engulfing – Is the Top In?#Silver View:
Just like Gold, Silver has formed a strong Bearish Engulfing pattern on the daily chart, potentially signaling a temporary top in the current trend. While it’s still early to confirm a full reversal, the price action suggests caution for bulls.
✅ Confirmation:
A daily close below 143,900
(today's low), especially with increased volume, would confirm the pattern and likely trigger further downside momentum.
❌ Negation:
If Silver manages to close above 153,388 (today’s high), the bearish structure will be invalidated.
🎯 Key Levels to Watch:
Resistance: 153,388 (pattern high)
Support: 143,900 (pattern low)
Stay alert for follow-through candles and volume spikes in coming sessions.
#Silver | #XAGUSD | #BearishEngulfing | #CandlestickPatterns | #TechnicalAnalysis | #PriceAction | #SilverAnalysis
📌 Disclaimer: This analysis is shared for educational purposes only. It is not a buy/sell recommendation. Please do your own research before making any trading decisions.
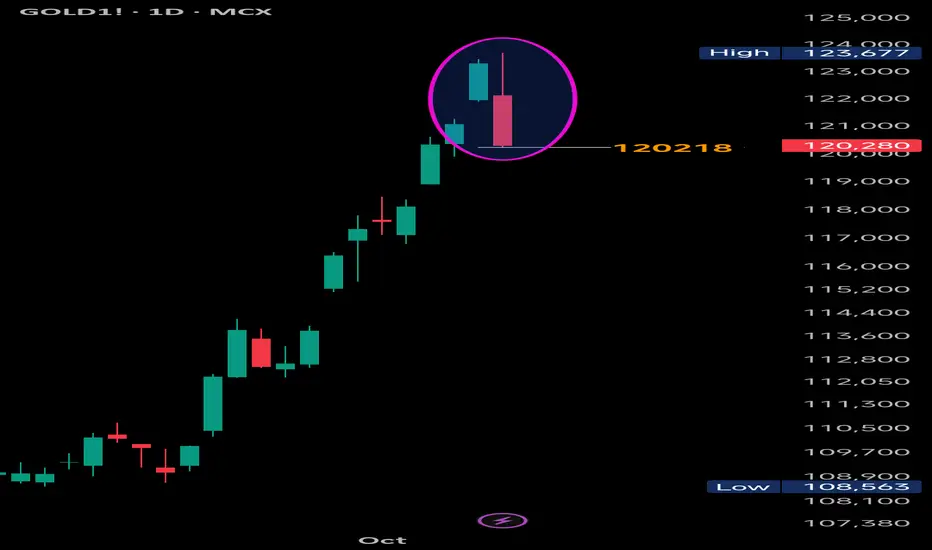
Gold: Bearish Engulfing – Is the Top In?Gold View:
Potential temporary top may be forming in Gold, marked by a strong Bearish Engulfing pattern on the daily chart. While it’s still early to confirm a full reversal, price action suggests caution for bulls.
✅ Confirmation:
A daily close below today's low 120,218 , especially with increased volume, would confirm the pattern and likely trigger further downside momentum.
❌ Negation:
If Gold manages to close above 123,677 (today’s high), the bearish structure will be invalidated.
🎯 Key Levels to Watch:
Resistance: 123,677 (pattern high)
Support: 120,218 (pattern low)
Stay alert for follow-through candles and volume spikes in coming sessions.
#Gold | #XAUUSD | #BearishEngulfing | #CandlestickPatterns | #TechnicalAnalysis | #PriceAction | #GoldAnalysis
📌 Disclaimer: This analysis is shared for educational purposes only. It is not a buy/sell recommendation. Please do your own research before making any trading decisions.
Ashok Leyland – Technical Research ReportAshok Leyland continues to maintain a strong uptrend across all time frames, forming higher tops and bottoms. The weekly chart confirms a "Rounding Bottom Breakout" above ₹134, backed by strong volume participation, which indicates sustained bullish interest.
The stock is comfortably trading above key moving averages (20, 50, 100, 200 SMA), adding further confirmation to the trend strength. A margin of safety zone has been identified near ₹134–₹136 levels, where value buying is likely to emerge in case of dips.
Strategy: Buy on dips towards support levels.
Targets: As per measurement rule
Stop-Loss: As per classic chart pattern rule
Overall outlook remains bullish with momentum indicators like RSI supporting continued upside.

SBI Card | Double Bottom Breakout | Bullish BiasSBI Card is showing signs of strength on the daily timeframe, completing a double bottom pattern, a classic bullish reversal setup. The stock is expected to close positively today around ₹830, confirming breakout intentions.
🔹 RSI is hovering near 60, indicating rising bullish momentum without being overbought.
🔹 The 20 EMA is sloping upward, reinforcing the short-term bullish trend.
🔹 Watch for resistance near ₹880, which coincides with a falling window gap — a likely profit-booking and supply zone.
📌 Key Levels:
Breakout above ₹830 can trigger momentum towards ₹880.
₹880 remains a crucial level to watch for follow-through or rejection.
🔔 Keep an eye on volume confirmation to validate the breakout.

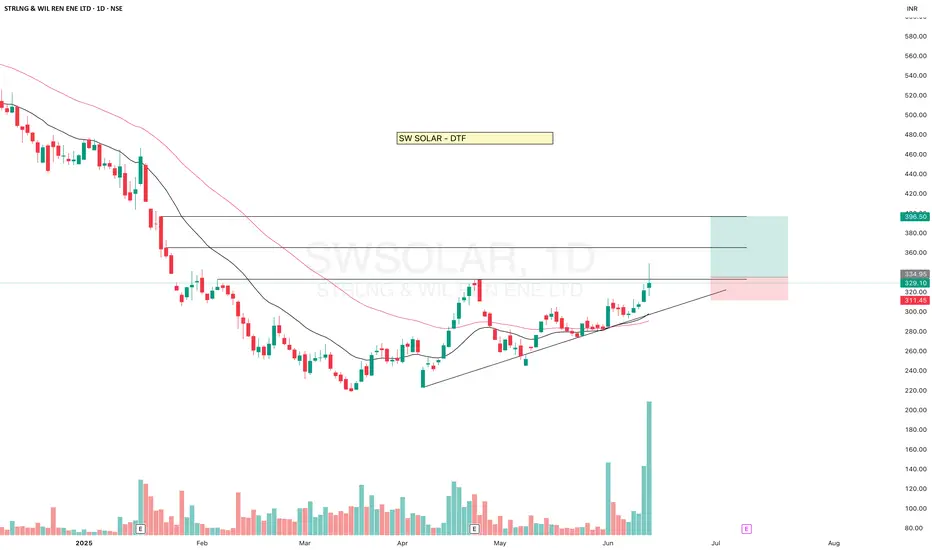
SW SOLARSW SOLAR gave BO but came down, heavy volume, if sustain this level then it may give a good upside move.
Moving above 20-50ema.
✅ If you like my analysis, please follow me as a token of appreciation :)
in.tradingview.com/u/SatpalS/
📌 For learning and educational purposes only, not a recommendation. Please consult your financial advisor before investing.
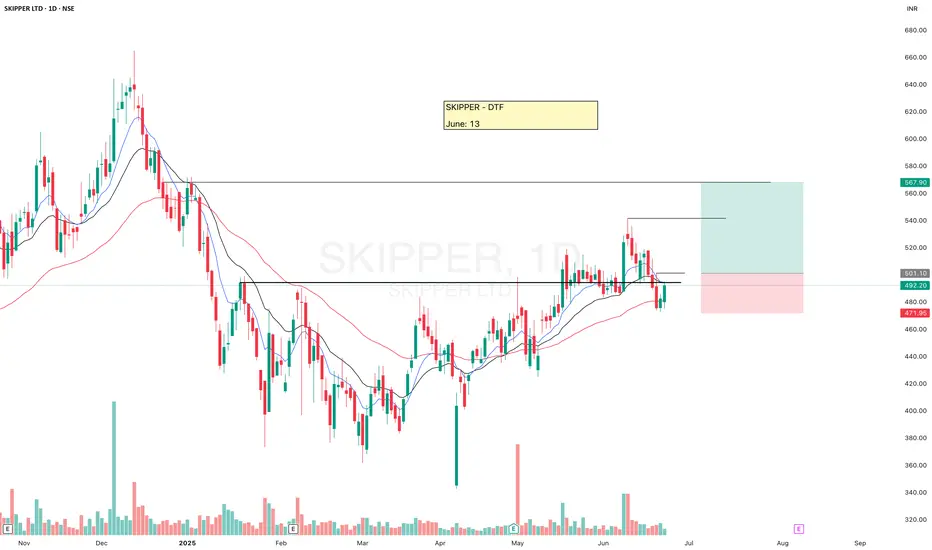
SKIPPERSKIPPER has been re-testing the recent breakout. It is moving above 50ema. Now the breakout above 500 may give an upside move.
Keep following.
✅ If you like my analysis, please follow me as a token of appreciation :)
in.tradingview.com/u/SatpalS/
📌 For learning and educational purposes only, not a recommendation. Please consult your financial advisor before investing.
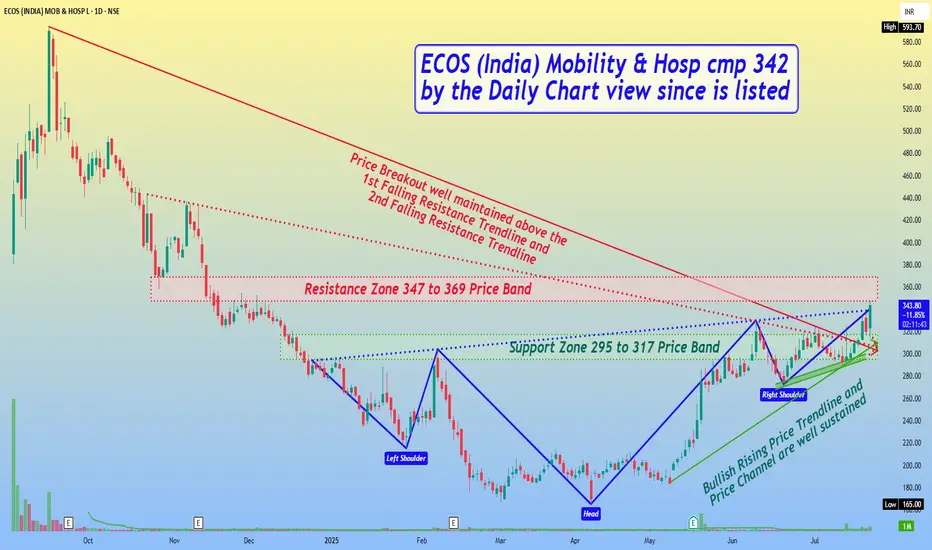
ECOS (India) Mobility & Hosp cmp 342 by Daily Chart since listedECOS (India) Mobility & Hosp cmp 342 by the Daily Chart view since is listed
- Support Zone 295 to 317 Price Band
- Resistance Zone 347 to 369 Price Band
- Bullish Rising Price Trendline and Price Channel are well sustained
- Above may also be interpreted as a Bullish "W" Double Bottom pattern
- *Rising Bullish Head & Shoulders pattern completed at Resistance Zone Neckline
- Volumes are intermittently spiking heavily indicative of demand based buying on the stock counter
- Price Breakout well maintained above the 1st Falling Resistance Trendline and 2nd Falling Resistance Trendline
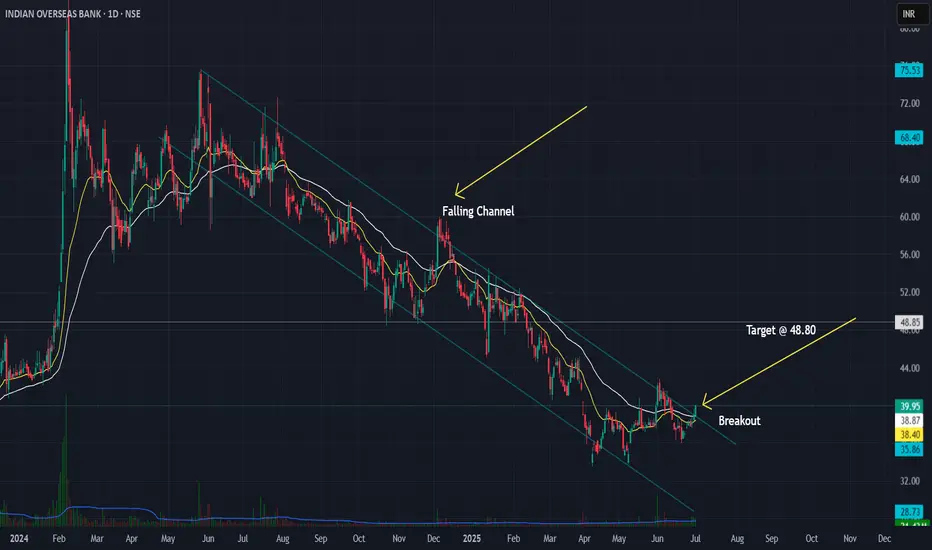
Indian Overseas Bank (IOB) - Falling Channel Breakout Setup📈 Indian Overseas Bank (IOB) – Falling Channel Breakout Setup
Watching a classic falling channel on the daily timeframe with multiple touches on both trendlines. Recent breakout above ~38.8 confirms the channel break.
✅ Planned Trade Details:
- Entry above 38.8 (confirmation)
- Stop-loss: 35.90
- ATR-based stop option: ~37.45 for tighter risk control
- Target zone: 48.80 based on channel height projection
Volume confirmation and follow-through will be key for validating the breakout. Tracking this for a positional swing trade.
RAJRATAN (Rajratan global wire ltd.)RAJRATAN is consolidating, making higher lows and equal highs, above 20-50ema.
Breakout may give a good upside move.
✅ If you like my analysis, please follow me as a token of appreciation :)
in.tradingview.com/u/SatpalS/
📌 For learning and educational purposes only, not a recommendation. Please consult your financial advisor before investing.

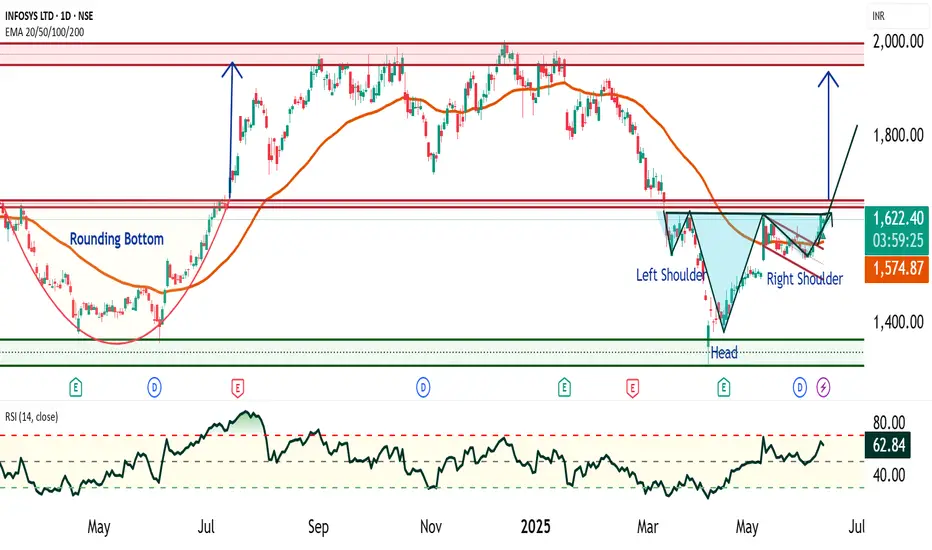
Infosys - Bullish Flag and Head & Shoulder Patterns🔍 1. Infosys Current Price Range and Key Levels
Since January 2021, Infosys has been trading in a broad range between ₹1300 and ₹2000, consolidating for over 4 years. Within this range, there are three key support and resistance levels to watch closely:
Support: ₹1300 (major floor)
Intermediate Resistance/Support Zone: ₹1600 – ₹1650
Strong Resistance: ₹2000 (upper bound)
📈 2. Bullish Flag Pattern: A Bullish Flag is a continuation pattern that forms after a strong upward price move "flagpole", followed by a period of consolidation in a narrow downward or sideways channel "flag". It typically signals a pause before the uptrend resumes.
Infosys recently broke out of a bullish flag pattern and crossed above ₹1580 with a strong closing on higher volume, indicating renewed buying interest.
Price is currently trading above the 50-day Exponential Moving Average (EMA), confirming the continuation of the mid-term uptrend.
However, the zone around ₹1650 remains a strong and key resistance level to monitor closely.
🧩 3. Potential Bullish Head and Shoulders Pattern Above ₹1650
Should Infosys break decisively above ₹1650, it is likely to form another significant bullish pattern known as the Bullish Head and Shoulders.
This pattern signals a trend reversal from bearish to bullish and is considered highly reliable.
Trend: Appears after a downtrend or consolidation, signaling reversal
Touchpoints: Three lows – left shoulder, head (lowest point), and right shoulder, roughly at similar levels
Neckline: The resistance line connecting the highs between shoulders and head
Timeframe: Medium-term, often forming over weeks up to 6 months
Volume: Typically higher volume on left shoulder and head formation, volume dips on right shoulder, and surges on breakout
⚠️ 4. Key Concerns in Infosys Chart Pattern
Price-Volume Divergence: During the head formation, volume increased sharply as price fell — indicating strong selling pressure. However, volume was low when price approached the neckline — suggesting weak buying interest to confirm breakout. This divergence signals potential caution.
Resistance Zone: Price remains below the key resistance at ₹1650, which has acted as a ceiling multiple times. A decisive breakout is required to sustain further upside momentum.
⚠️ Disclaimer
This report is intended solely for educational and training purposes and does not constitute investment advice. Traders and investors should conduct their own research and consult financial advisors before making trading decisions.
MAN INDUSTRIES – Explosive CT Breakout with Volume Cluster Surge🔴 CT Breakout: The red trendline marks a major weekly CT, now decisively breached by a strong bullish candle.
📈 Volume Cluster Breakout: This is not a one-week spike — it's a cluster of multiple high-volume weeks, indicating consistent accumulation before the breakout. Current volume stands tall at 2.23M+, validating this move.
🟢 Demand Zones Respected: Price respected key demand zones (green boxes) on multiple occasions, forming a strong base with higher lows.
⚪ Hidden Resistances Cleared: Two dotted white hidden resistance lines have been cleanly taken out, suggesting deeper supply has been absorbed.
🟥 Supply Zone Ahead: The next visible hurdle, giving the current move significant open air to run.

NIFTY - Breakdown OR Support...Nifty is third time at it's channel support line (Lower Channel Level). Weekly close below it will confirm breakdown.
Nifty's next two support after breakdown are marked with green lines.
Disclaimer: This is for demonstration and educational purpose only. This is not buying or selling recommendations. I am not SEBI registered. Please consult your financial advisor before taking any trade.

Exideind | All Resistance Trendline Breakout ⭕️ Swing Trading opportunity: Price Action Analysis Alert !!!⭕️
💡✍️Technical Reasons to trade or Strategy applied :-
✅Inverted Head & Shoulder Chart Pattern Bull Breakout
✅Breakout confirmed
✅Rise in Volume
✅Good 3 touches Trendline Breakout with volume
✅Clear uptrend with HH & HLs sequence
✅ Order block as potential Target
✅Check out my TradingView profile to see how we analyze charts and execute trades.
🙋♀️🙋♂️If you have any questions about this stock, feel free to reach out to me.
📍📌Thank you for exploring our idea! We hope you found it valuable.
🙏FLLOW for more !
👍LIKE if useful !
✍️COMMENT Below your view !

LAXMI ORGANIC, BULLISHThe stock has seen correction since Sept 2021, formed strong base,
and is rising with HH-HL pattern. Important levels are indicated in the
chart. Target price shown is based on rounding bottom pattern.

Polyplex - Classic double bottom chart patternClassic double bottom chart pattern formed in Polyplex.
Price has corrected from top and after 2 years forming a bullish reversal chart pattern called double bottom. Double bottom is a bullish reversal pattern is forming after a strong downtrend.
Price is printing lower top and lower bottom and finally price has settled at 760.
Twice touch bottom at 760 formed a support and finally breakout of price swing high 960 confirm the double bottom chart pattern.
Target would 1150..

Basic Chart Pattern is very effectiveHello Traders !
I ussually use basic chart pattern on my technical analysis. I think it's very useful for traders. Many trader still use it and CMT book still write and train it for many student in the world.
Some chart pattern which I appreciate like as :
1/ Head and Shoulder
2/ 2 Top -2 Bottom
3/ Flag pattern
4/ Wedge
Example, Gold chart (h1) as bellow, I use only 2 top-2 bottom to trade and you can see that it is very effective.

Peninsula Land Ltd - Cup with handle patternThe "Cup with Handle" pattern is a bullish continuation chart pattern that signals a potential continuation of an uptrend after a period of consolidation. When observed in Peninsula Land's stock chart, this pattern indicates the possibility of further price increases. Cup with handle pattern formation complete in 4 months
Key Characteristics:
Cup Shape: The pattern starts with a rounded "U"-shaped bottom, resembling a teacup. This indicates a period of consolidation where the price declines slightly, then gradually recovers to approximately the same level as before the decline.
Handle Formation: After the cup is formed, a smaller consolidation or slight pullback occurs, forming the "handle." This handle often slopes downward slightly, indicating a brief pause before the next move upward.
Breakout Point: The breakout occurs when the price moves above the resistance level formed by the highs on either side of the cup.
Implications for Peninsula Land:
Market Sentiment: The cup with handle pattern indicates a period of accumulation and investor confidence, suggesting that the stock is likely to continue its upward trajectory after the handle formation.
Entry Point: Traders often consider entering a long position once the price breaks out above the handle's resistance level 75, confirming the pattern.
Target Price:
Long above 75
SL below 63
Target 1 92, 100 and 120

TITAN - Triple Top Chart PatternTitan has formed a bearish chart pattern called Triple Top.
Triple top is a bearish chart pattern which is formed in an uptrend where three tops are lying on a flat horizontal resistance line and pattern will activate only when closing below the neckline or support. Pattern will activate only below the closing 3475 marks.
Triple top pattern is one the rarest chart pattern with high accuracy.
Thank You
Arvind Share Academy

Yashpakka can look for tp of 177-180Yashpakka can look for tp of 177-180
sl of 84 on daily closing basis
Disclaimer : only for education and learning purpose

Balrampur Chini - Daily CMP 394Flag and Pole + Bullish Penant pattern.
Respecting the 50 MA line
Targets of 414-430-450 canbe achieved on breakout.
Keep SL below the demand zone or a closing below 50 MA line.
If breakdown, then short targets can be 380-368-360
Undercurrent is bullish.
*Always trail your profits.
*This is just a view, trade at your own risk.

GBPCHF 240, Continue DowntrendGBPCHF is continuing downtrend on the 4 h chart. So that the only open SELL trade this time. Today market close and this pair price 1.11409 on current time, And retest again on the 1.2200 key level. My first target 1.09300 and second target 1.05200.

TVS Motor - Cup with HandleTVS Motor forming a cup with handle chart pattern.
ADX in between 20-25 showing the strength and possible to give breakout.
Waiting for price confirmation over breakout level then after will update the trading levels.
