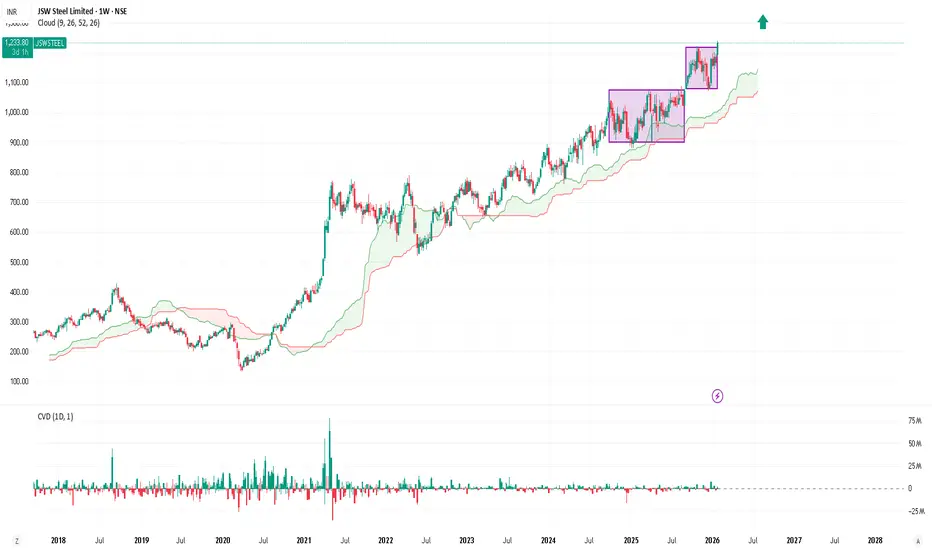
JSW Steel | Bull Continuation After Range Breakout target 1450🏭 Business Snapshot
JSW Steel is one of India’s largest integrated steel producers
Key beneficiary of infrastructure, construction, and capex-led growth
Strong domestic presence with improving capacity utilisation
Steel cycle + government infra spending provide sector tailwinds
(Business context added for background only; trade is purely technical.)
🔍 Technical Structure
Weekly chart shows a clear HH–HL staircase
Price broke out above ₹1160–1180 multi-week range
Breakout followed by healthy consolidation (no distribution)
Price holding above VWAP & EMA cluster
Volume stable → no exhaustion signs
✅ Ideal Buy Zone
₹1180 – ₹1210
Prior resistance turned support
VWAP + value area support
Avoid chasing above ₹1240
🎯 Targets
Target 1: ₹1380
Target 2: ₹1450
(Trail stop after T1 if price holds above VWAP)
❌ Stop Loss / Invalidation
₹1145 (Daily closing basis)
Below support zone
Breakdown of HL structure invalidates setup
📐 Risk–Reward
Risk: ~₹35–45
Reward: ₹160–240
R:R ≈ 1:3+
🧠 TradingView Disclaimer
This chart is shared for educational purposes only.
Levels are based on price action and market structure.
Trade only if aligned with your own risk managemen
Chart Patterns
BEL | HH–HL Structure | Swing Continuation Setup🏭 Business Snapshot
BEL is a Navratna PSU under the Ministry of Defence
Core business: defence electronics, radar systems, avionics, communication & EW systems
Strong presence in indigenisation and defence modernization programs
Order book visibility and government capex provide long-term earnings stability
(Business view added for context only; trade is based on technicals.)
🔍 Technical Structure
Weekly HH–HL structure intact
Range breakout above ₹420
Prior resistance turned demand zone
Price holding above VWAP & short-term EMAs
Breakout supported by volume expansion
✅ Ideal Buy Zone
₹410 – ₹420
Demand + high volume node
Retest zone of breakout
Avoid chasing strength above ₹445
🎯 Targets
Target 1: ₹480
Target 2: ₹520
(Trail stop after T1 if momentum sustains)
❌ Stop Loss / Invalidation
₹398 (Daily close)
Breakdown below demand
Structure invalid if HL fails
📐 Risk–Reward
Approx Risk: ₹15–20
Reward: ₹60–100
R:R ≈ 1:3 to 1:4
🧠 TradingView Disclaimer
This chart is shared for educational purposes only.
Levels are based on price action and market structure.
Trade only if aligned with your risk management.

Part 5 Best Trading Strategies Simple Example to Understand
Scenario
Nifty at 21500
You expect it to go to 21650.
Call Option Buy
Buy 21500 CE
If Nifty moves up → premium increases → profit
If Nifty falls → premium collapses → loss
Put Option Buy
Not useful in this scenario
Option Seller’s View
If seller expects market to remain sideways:
Seller sells 21600 CE
Seller sells 21400 PE
Both sides decay → seller profits

XAUUSD/GOLD CORRECTION BUY PROJECTION 29.01.26XAUUSD / Gold – Correction Buy Setup (29-01-2026)
Market View:
Gold is in a strong bullish trend. The current move is a normal correction, not a trend reversal.
Buy Zone:
Support S2 + Fair Value Gap (FVG)
0.618 Fibonacci Golden Ratio
Area around 5396 – 5400
Trade Plan:
Look for buy confirmation in the marked support zone.
Expect price to respect the uptrend line and move higher.
Targets:
First target: Resistance R1
Main target: 5600+
Stop Loss:
Below Support S2 / below recent structure low.

IPCA Labs – Trend Reversal After Long ConsolidationNSE:IPCALAB has successfully transitioned from a downtrend into a bullish structure after months of sideways consolidation. The breakout above the falling trendline followed by a controlled pullback suggests accumulation.
As long as price holds above ₹1450, the trend remains positive and a fresh breakout above ₹1500 can open the door for further upside.

XAUUSD (GOLD) | BREAKOUT VS BREAKDOWN LEVEL | 29th Jan'2026XAU/USD (Gold) Outlook | 29 Jan 2026
Gold (XAU/USD) is trading near 5513, maintaining a strong bullish structure across daily, weekly, and monthly timeframes. Price is holding well above key moving averages, indicating sustained buying momentum. As long as gold stays above the 5515–5495 support zone, the upside bias remains intact with potential continuation toward 5555–5590. A decisive break below 5495 may trigger short-term corrective pressure, but the broader trend remains positive.
Breakout & Breakdown Levels
Bullish Breakout: Above 5555 | Bearish Breakdown: Below 5495
Disclaimer: This content is for educational purposes only and not financial advice. Trading involves risk; manage your position size wisely.

ZENTECH Bullish Breakout: Falling Wedge Resolves Within Long-TerZENTECH is currently trading within a long-term triangle structure, indicating prolonged consolidation before a directional move.
On the intermediate timeframe, price has broken out of a falling wedge pattern, which is a classic bullish reversal setup.
The breakout is confirmed above the ₹1384 zone, which now acts as an important support.
If price sustains above this breakout level, the structure suggests a continuation towards higher levels.
📈 Minimum projected target: ₹1600
As always, watch for volume confirmation and price holding above the breakout zone for further strength.
#ElliottWave #ChartPatterns #FallingWedge #Triangle #BullishBreakout #TechnicalAnalysis

Gold at Make-or-Break Zone | Channel Support Under TestGold is currently trading inside a rising channel and has pulled back toward the lower side of the structure. This move looks more like a healthy correction rather than a breakdown, as long as price continues to hold the marked support area.
If buyers step in near channel support, upside continuation remains possible toward the higher zone. A clear break below support, however, would weaken the structure and shift the bias to the downside. For now, this is a wait-and-react zone, not a chase.
⚠️ Disclaimer
This analysis is for educational purposes only and should not be considered financial advice. Trading involves risk. Please do your own research and use proper risk management.

TATASTEEL C&H WEEKLY BREAKOUTTatasteel breaking c&h pattern weekly basis
trading at ATH,metal sector doing well
good volume last few weeks
RSI above 60,macd crossover seen
immediate target 206,after breaking 206 can lead toward 227
NO BUY/SELL RECOMENDATION

Part 4 Technical Analysis Vs Institution Option TradingA. When to Buy Options
Breakout from consolidation
High volume at breakout
Trend confirmed
IV low → premiums cheap
Clear direction available
B. When to Sell Options
Range-bound market
No trending structure
IV high → premiums expensive
Event after event → IV crash expected

GOLD MAINTAINS BULLISH TREND POST-FOMC; VOLATILITY RISKS📰 FOMC Update (Jan 29)
The Fed kept rates unchanged, as expected.
Powell remained data-dependent, avoiding any aggressive hawkish shift.
Markets read this as no urgency to tighten further, keeping real yields capped.
Result: USD hesitates → Gold volatility expands, but trend stays intact.
This is not “buy the news” — it’s flow reacting to policy clarity.
📊 Technical Structure (H1–H4 Context)
Clear bullish Break of Structure before FOMC → trend already established.
Post-FOMC impulse pushed price into ATH territory, followed by a healthy pullback.
No bearish Change of Character confirmed → structure remains bullish continuation, not distribution.
Price is correcting within trend, not reversing.
🔑 Key Zones to Watch
ATH / Premium Reaction: ~5560
FVG 1 (shallow pullback): ~5436
FVG 2 (deeper rebalancing): ~5353
These are reaction zones, not FOMO levels.
🧠 Scenarios (If – Then)
Primary Scenario – Continuation (≈70%)
If price holds above 5436, expect continuation toward new highs after rebalancing.
Alternative Scenario – Deeper Pullback (≈30%)
If 5436 fails, price may rebalance into 5353 FVG.
Only a clear H1 close below 5353 would weaken the bullish bias.
✅ Summary
FOMC created volatility, not a trend change.
Gold is respecting structure, absorbing liquidity, and preparing for the next leg.
Trade the reaction, not the headline.
Buy pullbacks. Respect structure. Let price confirm.

Part 3 Technical Analysis Vs Institution Option TradingImportant Tools for Option Trading
Option Chain (NSE)
TradingView
Volume Profile
Market Structure
Open Interest
India VIX
PCR
Institutional flow
Heatmaps

hind copper crucial update after breakout hind copper trading in close range if break 578 or sustain abv than will see 630--700+++ soon or blow 500 level can we see 465++++ in short term these are in terms of short term . where copper demand looks like zoom

IOC 1 Day time Frame 📊 Current Daily Price (Live / Latest)
Current price: ~₹162.8 – ₹163.8 (NSE) on 29 Jan 2026 during the session.
Today’s range so far: Low ~₹161.7, High ~₹164.6.
📈 Key Daily Levels (Support & Resistance)
📌 Immediate Support
S1: ~₹161.0 – ₹161.8 — today’s low region.
S2: ~₹158.6 – ₹159.0 — short‑term near support zone.
S3: ~₹156 – ₹157 — broader support if prices weaken further.
📌 Pivot / Neutral Zon
Pivot level: around ₹161.8 – ₹162.5 — inside today’s trading range.
📌 Immediate Resistance
R1: ~₹164 – ₹165 — today’s high zone.
R2: ~₹167 – ₹168 — next upside resistance cluster.
R3: ~₹170 – ₹170+] — stronger breakout region above recent swings.
📌 How to Use These Levels Today
Bullish scenario:
A clean break above ₹164–₹165 on strong volume could open the way toward ₹167–₹168+.
Bearish scenario:
A drop below ₹161 and especially below ₹158–₹159 could lead to deeper testing of ₹156–₹155 support.

hind copper cuphind copper enetred cup pattern with big volume.
metal index is bullish
copper looks good as commodity

IIFL 1 Week Time Frame 📊 Current Price Snapshot
IIFL Finance share price: ~₹560–₹565 on NSE (today’s range) — with highs around ₹565 and lows near ₹540.45 earlier in today’s session.
📈 Weekly Support & Resistance (Key Levels)
These levels are derived from weekly pivot and longer‑term technical distribution — useful for swing/weekly traders:
🔹 Major Weekly Pivot Zone
Weekly Central Pivot (CPR): ~₹562–₹564 — this zone acts as the pivot around which weekly direction may tilt.
🔹 Weekly Resistance Levels
R1: ~₹613–₹616 — first major resistance if price rallies above current.
R2: ~₹650–₹672 — next higher resistance zone aligned with recent 52‑week highs.
R3: ~₹705+ — extended bullish breakout target.
🔻 Weekly Support Levels
S1: ~₹470–₹472 — first major support if selling accelerates.
S2: ~₹418–₹420 — secondary support from larger weekly pivots.
S3: ~₹326–₹330 — lowest weekly pivot support (deep correction scenario).
🧠 What this means (Weekly Macro View)
📍 Bullish Scenario
If price closes above the pivot zone (~₹562–564) on weekly charts, look for upside momentum toward ₹613–₹650 next.
📉 Bearish Scenario
A weekly close below ~₹470–₹472 could open deeper correction toward ₹418–₹380 support cluster.

Gold ATH after FOMC: Reaction or New Wave?Before the FOMC meeting, the market shared the same question:
would gold rally ahead of the meeting and then face a sharp sell-off afterward, or continue breaking higher and extend the trend?
After the FOMC, the Fed kept interest rates unchanged — which was not a surprise.
What really mattered was the Fed’s tone, and Powell clearly chose a balanced stance:
neither too dovish nor too hawkish.
More importantly, the Fed has effectively ruled out further rate hikes, while still maintaining a high interest-rate environment.
As a result, gold did not experience a heavy sell-off after the FOMC, and continues to hold its structure near the highs.
At this stage, market focus is shifting toward external risk factors:
The risk of a U.S. government shutdown
U.S.–Iran tensions
Ongoing trade war risks with major partners
Questions surrounding the independence of the Fed
👉 The current macro backdrop is not bearish for gold.
👉 SELL setups are reactionary, not the core narrative of the trend.
⏱️ H1 Observation Range
Lower bound: 5,415
Upper bound: 5,600
Price is consolidating near the highs with a wide range and may gradually push toward higher round-number levels.
🟢 Support / BUY zones
5,505 – 5,410 – 5,310 – 5,250 – 5,100
🔴 Resistance / Key observation zones
5,660–5,665 – 5,700 – 5,800 – 6,000
🧠 Primary scenario
Wide volatility → risk management is key.
SELLs are only short-term reactions at resistance.
BUY pullbacks to support to ride the broader move, not to pick the top.
⚠️ Key notes for the current phase
Reading the chart is a skill.
Reading the Fed is a strategy.
Reading Trump’s statements is survival.
Markets don’t reward being right —
they reward discipline and alignment with the trend.
👉 SELL to react — BUY to stay in the game.
📌 Follow me to track macro scenarios, key price levels, and the ongoing journey of finding opportunities in the market.

GRSE 1 Day Time Frame 📈 Live Price & Intraday Range (as of mid‑session)
Current Price (approx): ₹ 2,570 – ₹ 2,573 (NSE) — showing a positive move vs previous close.
Today’s High: ~₹ 2,647.90
Today’s Low: ~₹ 2,550.00
This indicates bullish participation intraday so far.
📌 Intraday Pivot & Support / Resistance Levels
Based on standard pivot calculation using the previous session’s range:
Pivot Point (PP): ~₹ 2,480.8
Resistance Levels:
R1: ~₹ 2,565.9
R2: ~₹ 2,613.1
R3: ~₹ 2,698.2
Support Levels:
S1: ~₹ 2,433.6
S2: ~₹ 2,348.5
S3: ~₹ 2,301.3
📌 Interpretation (Day Trading)
Above pivot (~₹ 2,480): bullish bias for the session.
Key breakout trigger: above R1/R2 levels (~₹ 2,565–2,613).
Downside support zones: around ₹ 2,433 then ₹ 2,348 if sellers step in.
🧠 How Traders Use These Levels Today
✅ Bullish scenario:
If the stock sustains above R1 (~₹ 2,566) and R2 (~₹ 2,613) with volume, buyers could push towards R3 (~₹ 2,698).
❗ If price weakens below S1/S2 (~₹ 2,433 / ₹ 2,348), short‑term downward pressure could emerge.
📍 Pivot (~₹ 2,480) is the key “bull vs bear” session decision level — staying above it generally suggests bulls are in control.
⚠️ Quick Risk Notes
These are intraday technical levels, not investment advice.
Stock prices can move fast; levels won’t guarantee direction.
Combine with volume and real‑time charts for best intraday decisions.

NIFTY 50 – 1H | Bullish Breakout ViewDespite the presence of a Head & Shoulder–like structure, NIFTY is holding above the neckline zone and showing higher lows on the right shoulder, indicating absorption of selling pressure.
Price is currently compressing below the neckline / 50 SMA, forming a tight consolidation, which often precedes an upside breakout rather than a breakdown. Failure of the Head & Shoulder pattern can result in a fast short-covering rally.
A strong 1H close above the neckline and 50 SMA will invalidate the bearish structure and confirm bullish continuation.
Key Levels
Immediate Support:
🟢 25,200 – 25,250 (neckline support)
Breakout Zone:
🔵 25,350 – 25,420 (neckline + 50 SMA)
Upside Targets
🚀 Target 1: 25,550
🚀 Target 2: 25,750
🚀 Target 3: 26,000
🚀 Extended Target: 26,200 (trend reversal zone)
Invalidation (Bullish View)
❌ 1H close below 25,200 will activate the Head & Shoulder breakdown and shift bias to bearish.
Conclusion
As long as NIFTY holds above 25,200, the market shows signs of pattern failure, which is often more powerful than pattern completion.
A confirmed breakout above 25,420 can trigger short covering and fresh longs, pushing price towards 25,750–26,000.
⚠️ For educational purposes only. Not SEBI registered.

DIXON 1 Week Time Frame 📊 Current Price Context
Current share price is roughly around ₹10,150–₹10,300 on NSE/BSE.
📅 1‑Week Time‑Frame Key Levels
📌 Major Weekly Support Levels
These act as zones where buyers may step in if price dips:
Support 1 (S1): ~₹10,040–₹10,050 – first defensive zone this week.
Support 2 (S2): ~₹9,720–₹9,730 – deeper weekly support if S1 breaks.
Support 3 (S3): ~₹9,170–₹9,180 – wide range lower support in extended sell‑off.
👉 A close firmly below ~₹10,040 could accelerate downside momentum for the week.
📌 Weekly Resistance Levels
These are upside caps for the short‑term:
Resistance 1 (R1): ~₹10,900–₹10,910 – immediate upside hurdle.
Resistance 2 (R2): ~₹11,460–₹11,470 – secondary resistance if R1 breaks.
Resistance 3 (R3): ~₹11,780–₹11,790 – higher weekly target zone.
👉 A weekly close above ₹10,900–₹11,000 improves short‑term bullish bias.
📉 Short Summary — 1W Levels
Bullish breakout zone:
↗️ Close above ~₹10,900 → next target ₹11,460 / ₹11,780
Range‑bound / neutral:
↔️ ₹10,040 – ₹10,900
Bearish breakdown zone:
↘️ Close below ~₹10,040 → deeper support at ₹9,720 → ₹9,170

Part 2 Technical Analysis Vs Institution Option TradingDirectional Strategies- Long Call: Bet on price going up.
- Long Put: Bet on price going down.
- Covered Call: Sell call on stock you own, generate income.
Volatility Strategies- Straddle: Buy call and put at same strike, profit from big moves.
- Strangle: Buy call and put at different strikes, profit from big moves.
Income Strategies- Credit Spreads: Sell options to collect premium.
- Iron Condor: Sell call and put spreads, profit from low volatility.
Hedging Strategies- Protective Put: Buy put on stock you own, limit downside.
- Collar: Buy put, sell call on stock you own, limit risk.

DATAPATTNS 1 Week time Frame 📌 Current Price Snapshot (Live / Latest Data)
Data Patterns (India) Ltd price (approx): ~ ₹2,592 — ₹2,620 per share (NSE) based on latest trading session updates.
52‑Week Range:
• High: ₹3,268.80
• Low: ₹1,351.15
📈 Weekly Pivot & Levels (classic method)
Level Price (Approx)
Weekly Pivot (central) ₹2,943.7
Weekly R1 ₹3,277.0
Weekly R2 ₹3,453.4
Weekly R3 ₹3,786.7
Weekly S1 ₹2,767.3
Weekly S2 ₹2,433.9
Weekly S3 ₹2,257.6
🔁 Weekly Fibonacci Pivot Levels (Alternate)
Level Price (Approx)
Weekly Pivot (Fibo) ₹2,943.7
R1 (Fib) ₹3,138.4
R2 (Fib) ₹3,258.7
R3 (Fib) ₹3,453.4
S1 (Fib) ₹2,748.9
S2 (Fib) ₹2,628.7
S3 (Fib) ₹2,433.9
📌 Quick Weekly Levels Summary
Current level (approx): ₹2,592 – ₹2,620
Weekly Pivot: ~₹2,943
Weekly Resistance 1: ~₹3,277
Weekly Resistance 2: ~₹3,453
Weekly Support 1: ~₹2,767
Weekly Support 2: ~₹2,433
Weekly Support 3: ~₹2,258

ASIANPAINT 1 Week Time Frame 📊 Current Price Context
Recent share price was trading around ₹2,423–₹2,515 range (latest intraday/previous close range) according to market data.
📈 Weekly Timeframe Levels — Asian Paints (NSE)
🔴 Resistance (Upside)
These are levels where price may face selling pressure or pause on the upside in the coming week:
1. ₹2,560–₹2,565 — Immediate near‑term resistance zone seen from short weekly consolidations.
2. ₹2,720–₹2,760 — Mid resistance zone where upside moves often stall on weekly/daily clusters.
3. ₹2,820–₹2,860+ — Higher weekly resistance zone — breakout above this could indicate stronger momentum.
🟢 Support (Downside)
These are levels where price might find buying interest or a floor on weekly charts:
1. ₹2,440–₹2,460 — Immediate support from weekly lower bands and short pivot support.
2. ₹2,340–₹2,380 — Secondary support zone seen from historical price clusters and volatility bands.
3. ₹2,300–₹2,250 — Major structural support — breakdown here could lead to deeper correction.
📉 Pivot Zone
₹2,500–₹2,530 — A central pivot/neutral range this week; trading above suggests short bullish bias, below suggests bearish.
📌 Weekly Technical Bias (Summary)
Bullish Scenario: A sustained weekly close above ₹2,560–₹2,565 opens path toward ₹2,720–₹2,860.
Bearish Scenario: Failure to hold ₹2,440–₹2,460 could drag price toward ₹2,340–₹2,300 on the weekly chart.
Range Play: Price oscillating between ₹2,440 – ₹2,560 indicates consolidative behavior typical in neutral markets.
